Update for Precious Metals (GDX, GLD, SLV), Healthcare (XLV, IBB, XBI) and Bond Proxies (TLT, XLU, XLRE)

Today’s report is in PDF format (link below) and covers the following:

The Gold SPDR (GLD), Gold Miners ETF (GDX) and Silver ETF (SLV) remain with bullish continuation patterns and bounced over the last few days. Breakouts could be imminent, but gold seems to be moving in tandem with the stock market.

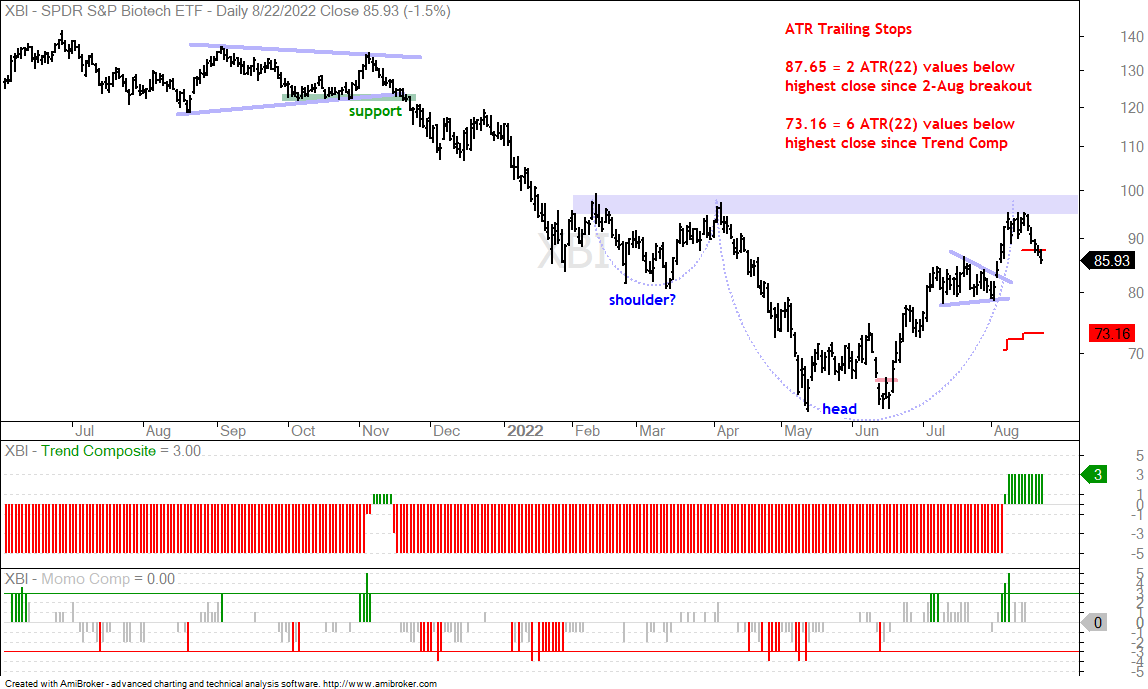
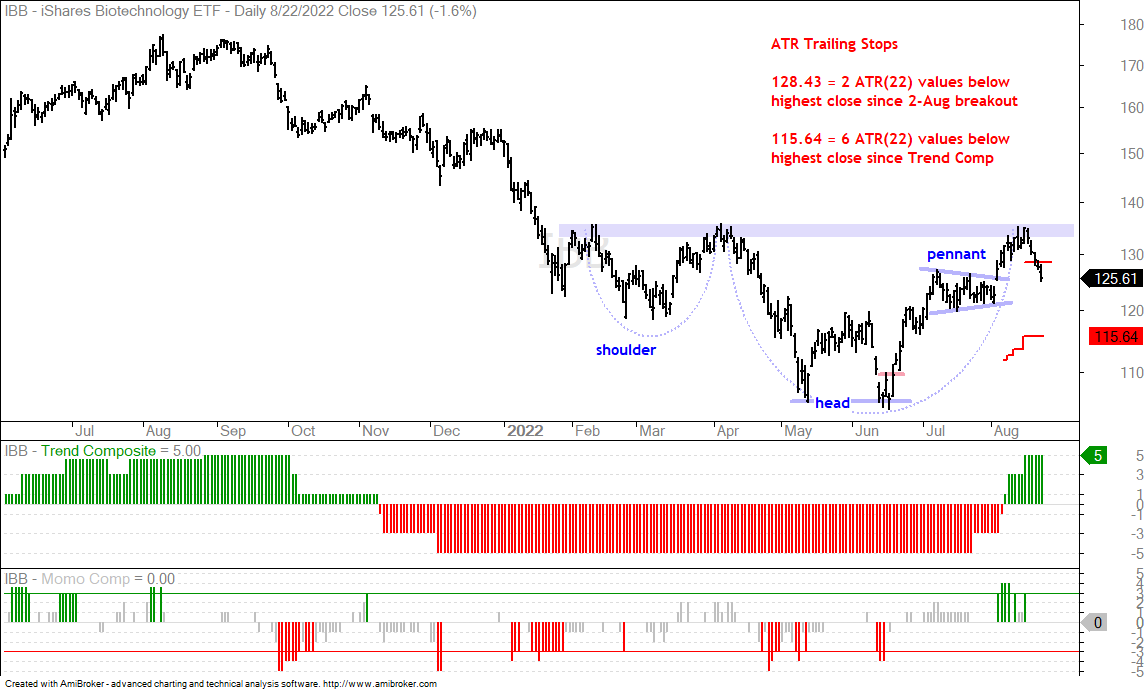
The Healthcare SPDR (XLV) continues to hold above its resistance zone and bounced on Monday with biotechs leading the charge. The Biotech ETF (IBB) and Biotech SPDR (XBI) made big moves and finally broke out of their falling channels to signal an end to their corrections.

Elsewhere, I am also watching the 20+ Yr Treasury Bond ETF (TLT) and the bond proxies, which moved on Monday. TLT was flat, but the Utilities SPDR (XLU) advanced and the Real Estate SPDR (XLRE) was up 2.45%, the most since July 1st. The cup remains half-full for XLRE and IYR because they have Bollinger Band breakouts and are above their 200-day SMAs.

Thanks for tuning in and have a great day!

Weekend Video – Acceleration, Outsized Decline, Mixed Indicators, Waning Breadth, Golden Pennants, TLT Battles Breakout …

Today’s video starts with the S&P 500 and breaks down the reversal over the last two weeks. We can see the index becoming overextended, accelerating higher and then suddenly reversing with an outsized decline. Such reversals occurred in the past and we will show what it means going forward. Elsewhere, the medium-term indicators turned

Weekend Video – Acceleration, Outsized Decline, Mixed Indicators, Waning Breadth, Golden Pennants, TLT Battles Breakout … Read More »

Timing Models – Accelerations, Trend Shocks, Indicators turn Mixed, Downside Targets and Breadth Models

The stock market was overextended in late August and the bulls gave it one more push higher with a small acceleration higher into late September. Technically, an acceleration higher signals an increase in momentum, which can be bullish. However, as with most technical signals, perspective is needed for interpretation. Today we will look at the accelerations that led to a reversal and the outsized decline. What do they portend going forward?

Timing Models – Accelerations, Trend Shocks, Indicators turn Mixed, Downside Targets and Breadth Models Read More »

ETF Grouping and Ranking Report – Outsized Declines, Retracement Targets, Patience During Corrections, Gold and Bonds Balk

Stocks were hit hard from Friday to Tuesday with the S&P 500 SPDR, Nasdaq 100 ETF and others recording outsized declines. Today we start with these outsized declines and show what they entail going forward. Stocks were already extended and these sharp declines signal the start of a corrective period. At this point, I will treat any weakness in SPY and QQQ as a correction within a bigger uptrend.

ETF Grouping and Ranking Report – Outsized Declines, Retracement Targets, Patience During Corrections, Gold and Bonds Balk Read More »

Weekend Video – Spinning Top, Indicators Turn Mixed, Correction Targets, Bond Breakouts Fail, Banks Buck Selling and More

The extended uptrend in stocks hit a speed bump this week with a sharp decline on Thursday-Friday. Today we will review the percent above 200-day SMA indicators and their extended nature. Attention then turns to the medium-term indicators, which turned mixed this week. The odds for a correction were already brewing and it looks like some sort of correction is unfolding. I will look at potential targets for SPY and QQQ, as well as for several ETFs in the ChartBook. Elsewhere

Weekend Video – Spinning Top, Indicators Turn Mixed, Correction Targets, Bond Breakouts Fail, Banks Buck Selling and More Read More »

Timing Models – Bears Fire a Shot, SPY Tags and Pulls Back, Volatility Ticks Up and Breadth Model Review

The bears fired a shot across the bow, but one or two days is not enough to reverse a strong uptrend. There were already warnings of a correction or pullback because SPY has been more than 10% above its 200-day since August 12th and QQQ has been 20% above its 200-day since July 6th. Of course, overbought indicators are not very good for timing a correction. In fact, I have yet to find a good indicator for timing a peak/pullback during a strong uptrend.

Timing Models – Bears Fire a Shot, SPY Tags and Pulls Back, Volatility Ticks Up and Breadth Model Review Read More »

ETF Trend/Pattern Grouping – Overextended get More So, Flag Breakouts, Pennants, Falling Wedges and Bollinger Band Squeezes

Overextended its an incredibly nebulous term. Many ETFs were considered overextended last week and simply became even more so as strong buying pressure persisted. This is a classic case of becoming overbought and remaining overbought because the uptrend is strong. These ETFs, which are in the first few groups, are in the trend-monitoring phase.

ETF Trend/Pattern Grouping – Overextended get More So, Flag Breakouts, Pennants, Falling Wedges and Bollinger Band Squeezes Read More »

Weekend Video – Breadth and Key Indicator Overview, Flag Breakouts (IWM), REITs Perk Up, GLD Winds UP and Bonds Extend Pullback

Today’s video starts with an overview of the breadth models for the S&P 500, Nasdaq 100, Mid-caps and Small-caps. We then turn to the all important medium-term trend and the four key indicators to watch. Diving into the chartbook, there are flag breakouts working in IWM and XLI. REITs are perking up and making good on their Bollinger Band breakouts. The gold and silver ETFs have bullish patterns and mean-reversion setups in the making. Bond ETFs, however, extended their pullbacks after the Fed announcement. The video finishes with

Weekend Video – Breadth and Key Indicator Overview, Flag Breakouts (IWM), REITs Perk Up, GLD Winds UP and Bonds Extend Pullback Read More »

Timing Models – Overextended, but Breadth and Medium-term Indicators Support Current Upswing

We all know that the S&P 500 is driven by large-caps, especially the big four, which account for over 20% of the index (AAPL, MSFT, AMZN, GOOGL). Furthermore, most of us are aware that breadth measures are not as strong as the S&P 500 and this is reflected in the S&P 500 EW ETF (RSP), which has yet to clear its June high. Breadth, however, is not exactly weak. It is just strong enough to sustain the advance. In other words, the cup is half full, not half empty.

Timing Models – Overextended, but Breadth and Medium-term Indicators Support Current Upswing Read More »

ETF Trend/Pattern Ranking and Grouping – Strong Extensions, Second Winds, Modest Extensions, Corrective Patterns, Laggards and Breakdowns

Stock-related ETFs remained strong and many so-called overbought ETFs became even more overbought as their uptrends extended. Many ETFs are in the trend-monitoring or waiting phase. The early breakouts occurred in July and these ETFs followed through with further gains the last several weeks. Some tech-related ETFs stalled in late July and early August, but caught a second wind with breakouts over the last few weeks.

ETF Trend/Pattern Ranking and Grouping – Strong Extensions, Second Winds, Modest Extensions, Corrective Patterns, Laggards and Breakdowns Read More »

Timing Models – SPY Tags a New High, Medium-term Indicators Favor the Bulls and SPX Breadth Model Remains Bullish

The bulk of the evidence remains bullish for large-caps, large-cap techs and mid-caps, but mixed for small-caps. I am also seeing mixed performance within the S&P 500, especially when looking at the equal-weight sectors. Technology, Healthcare and Consumer Discretionary remain strong, while Finance, Energy and REITs are weak. Finance is the only big sector that shows underlying weakness though.

Timing Models – SPY Tags a New High, Medium-term Indicators Favor the Bulls and SPX Breadth Model Remains Bullish Read More »

ETF Trend/Pattern Video – Bonds Oversold, Gold Turns Volatile, XLY Holds Chandelier, REITs Vulnerable and Dollar Springs Bear Trap

Today’s video will focus on the core ETF charts. We will start with the scatter plot and see that the bond ETFs in the upper left, which means they are oversold and in uptrends. On the ranking tables, ETFs related to Consumer Discretionary, Healthcare and Technology are leading. I continue to follow the Chandelier Exits for several ETFs as their uptrends extend (XLY, ITB, XRT). Elsewhere

ETF Trend/Pattern Video – Bonds Oversold, Gold Turns Volatile, XLY Holds Chandelier, REITs Vulnerable and Dollar Springs Bear Trap Read More »

ETF Ranking, Grouping and Analysis – Mean-Reversion Setups in Bond ETFs, Bounces in Biotech ETFs and Breakouts in Two Healthcare ETFs

Despite the usual pockets of weakness, there is still plenty of strength out there in ETF land. Housing, Retail and Consumer Discretionary ETFs moved to new highs. Tech-related ETFs remain mixed with some hitting new highs and some moving back into their consolidation patterns. Precious metals ETFs got sizable mean-reversion bounces, but it looks like volatility is picking up in this group.

ETF Ranking, Grouping and Analysis – Mean-Reversion Setups in Bond ETFs, Bounces in Biotech ETFs and Breakouts in Two Healthcare ETFs Read More »

Q&A – How to Use the ETF Rankings, RSI65 versus StochClose, Settings for Chandelier Exits and Trend-Timing the Broader Market

I received some pertinent questions over the weekend and create a post to share the answers. My email answers were not as detailed as in this post, which provides more details and examples. The first question deals with the StochClose ranking and how to use it. This answer will also highlight seven broad trading strategy groups. Second

Q&A – How to Use the ETF Rankings, RSI65 versus StochClose, Settings for Chandelier Exits and Trend-Timing the Broader Market Read More »

Weekend Video – Participation Broadens as Mid-caps, Industrials and Banks Perk Up

Today’s video starts with a long-term weekly chart of the S&P 500 SPDR and the reason I consider this advance as a medium-term uptrend. The medium-term trend indicators remain in bull mode and the mid-cap breadth model turned bullish this week as participation broadened. We can see this in the ranking tables as the StochClose values shot up for the Industrials SPDR and Regional Bank ETF.

Weekend Video – Participation Broadens as Mid-caps, Industrials and Banks Perk Up Read More »

Timing Models – Participation Broadens as Two Key Sectors Perk Up and Mid-cap Breadth Improves

Even though the current advance is getting quite extended, the broad market environment remains bullish and the medium-term uptrends rule. Tech-related ETFs and stocks drove the market higher from late March to late June. Even though the tech surge slowed, participation broadened over the last six weeks as other groups picked up the slack. The Industrials SPDR (XLI) is the top performing sector since July 1st

Timing Models – Participation Broadens as Two Key Sectors Perk Up and Mid-cap Breadth Improves Read More »

ETF Ranking and Grouping – Uptrends, Overbought Conditions, Pullbacks and Breakout Failures

There are still a lot of uptrends out there in ETF land, and this includes some key stock-related ETFs. Nevertheless, we are seeing some rotation at work the last few weeks. The tech-related ETFs slowed their advance and some even failed to hold their breakouts. Meanwhile, ETFs related to consumer discretionary continued higher and are leading the pack. However, some of these new leaders are getting extended (XLY, XHB).

ETF Ranking and Grouping – Uptrends, Overbought Conditions, Pullbacks and Breakout Failures Read More »

Weekend Video – Participation Wanes, but Low Vol and Key Indicators Support Uptrend as Money Rotates

Today’s video starts with the medium-term indicators and the overall trends for the S&P 500 SPDR, S&P 500 EW ETF, S&P MidCap 400 SPDR and Russell 2000 ETF. These are the broadest index ETFs out there and money moved into mid-caps and small-caps this week. The advance since April is marked by falling volatility and we will look at two indicators to monitor volatility.

Weekend Video – Participation Wanes, but Low Vol and Key Indicators Support Uptrend as Money Rotates Read More »

Timing Models – Falling Volatility Powers SPY and Breakouts Hold, but Participation Continues to Wane

The chart below shows year-to-date performance for the top 20 stocks in the S&P 500. Overall, the year is mixed with eleven up and nine down. Amazon is up over 70%, Apple is up over 50% and Microsoft is up over 30%. Facebook and Home Depot are dragging their feet with gains greater than 20%. As strong as the stock market seems, strength is clearly concentrated in a few stocks. Moreover, these few stocks are up big, really big.

Timing Models – Falling Volatility Powers SPY and Breakouts Hold, but Participation Continues to Wane Read More »

ETF Ranking and Grouping – Breakouts Hold, Small-caps Come to Life, Banks and Energy Still Lagging

After some volatility and big moves in March, April and May, trading has turned downright boring the last few weeks. Nevertheless, the majority of breakouts are holding and there are plenty of leaders. Tech, housing, retail, precious metals and Healthcare continue to lead. ETFs related to Finance and Energy continue to lag. Industrials and small-caps perked up this week and extended on their breakouts, which were looking rather feeble just last week.

ETF Ranking and Grouping – Breakouts Hold, Small-caps Come to Life, Banks and Energy Still Lagging Read More »

Weekend Video – Medium-term Uptrends Battle Waning Participation, Seasonal Patterns and Excesses

Today’s video starts with the medium-term uptrend and key indicators for the S&P 500 because they hold the key as we move into August. The bulk of the evidence remains bullish, but fewer stocks participated in the July advance and the market took a more defensive tone. The breakouts in IWM and XLI were not inspiring, XLF continues to lag and XLU was the top performing sector in July. I will also review the excesses in QQQ, the seasonal patterns, the breadth models, the ChartBook, the Fed balance sheet and yield spreads.

Weekend Video – Medium-term Uptrends Battle Waning Participation, Seasonal Patterns and Excesses Read More »

Scroll to Top