After becoming very oversold in mid June, the major index ETFs are in the midst of oversold bounces or consolidations over the last three weeks. Predicting the extend of a bounce is tricky, but the current bounce since mid June is within a downtrend and still considered a counter-trend move. Today’s commentary will look at the bounces in SPY, QQQ and IWM. We will then define the downswings in oil, XLE and XES, and update performance for commodities. Coffee and palladium are still holding up relatively. Attention then turns to Healthcare, Biotech and Aerospace & Defense.
About the ETF Trends, Patterns and Setups Report
This report contains discretionary chart analysis based on my interpretation of the price charts. This is different from the fully systematic approach in the Trend Composite strategy series. In this ETF Trends, Patterns and Setups report, I am looking for leading uptrends and tradable setups within these uptrends. While I use indicators to help define the trend and identify oversold conditions within uptrends, the assessments are mostly based on price action and the price chart (higher highs, higher lows, patterns in play). Sometimes the chart assessment can be at odds with the indicators.
You can learn more about my chart strategy in this article covering the different timeframes, chart settings, StochClose, RSI and StochRSI.
SPY Gets Oversold Bounce within Downtrend (SPY, QQQ, IWM)
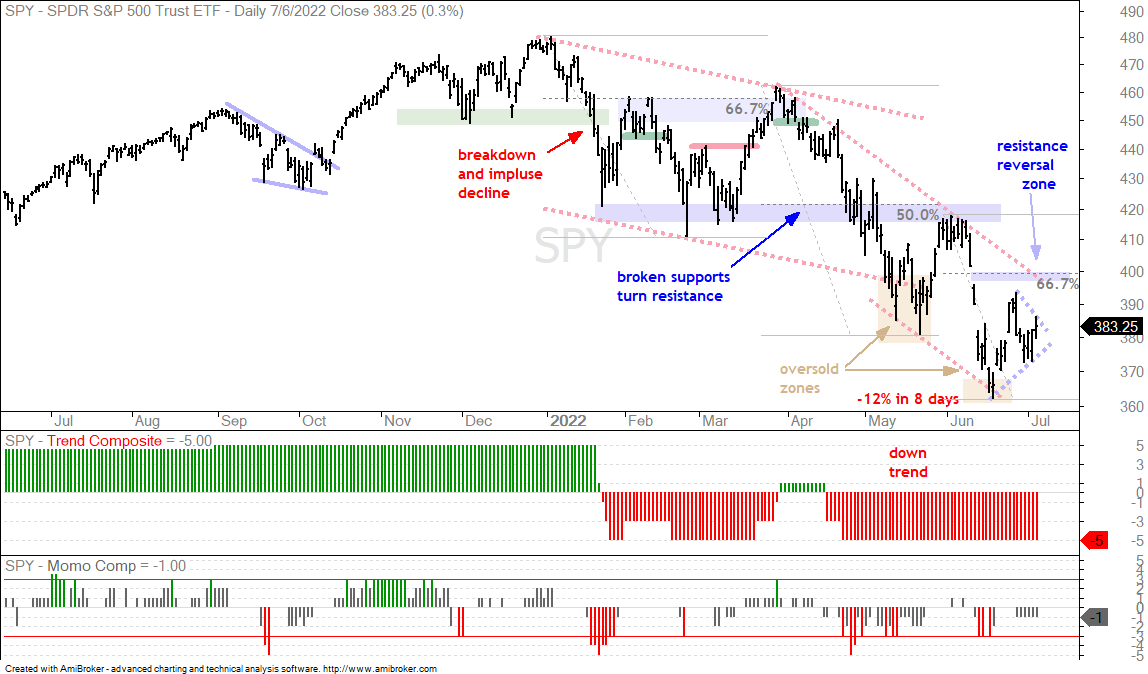
SPY and the broad market ETFs, QQQ and IWM, are in the midst of oversold bounces or consolidations within bigger downtrends. All three recorded 52-week lows in mid June, bounced from 20 to 27 June, fell back last week and edged higher this week. Should the bounce extend, the blue shading marks the resistance-reversal zones. These are defined using retracements, broken support levels and/or resistance levels. The chart below shows SPY with a bounce off the mid June low and the resistance-reversal zone around 395-400 (66.7% retracement and channel line).
Should SPY fail to extend further here in July or fail to exceed its late June high, a pennant type consolidation could take shape. These are short-term continuation patterns and this one would be bearish because the prior move was down (-12% in 8 days). The dashed blue lines show this potential pattern. A break below the early July low would break pennant support and signal a continuation lower.
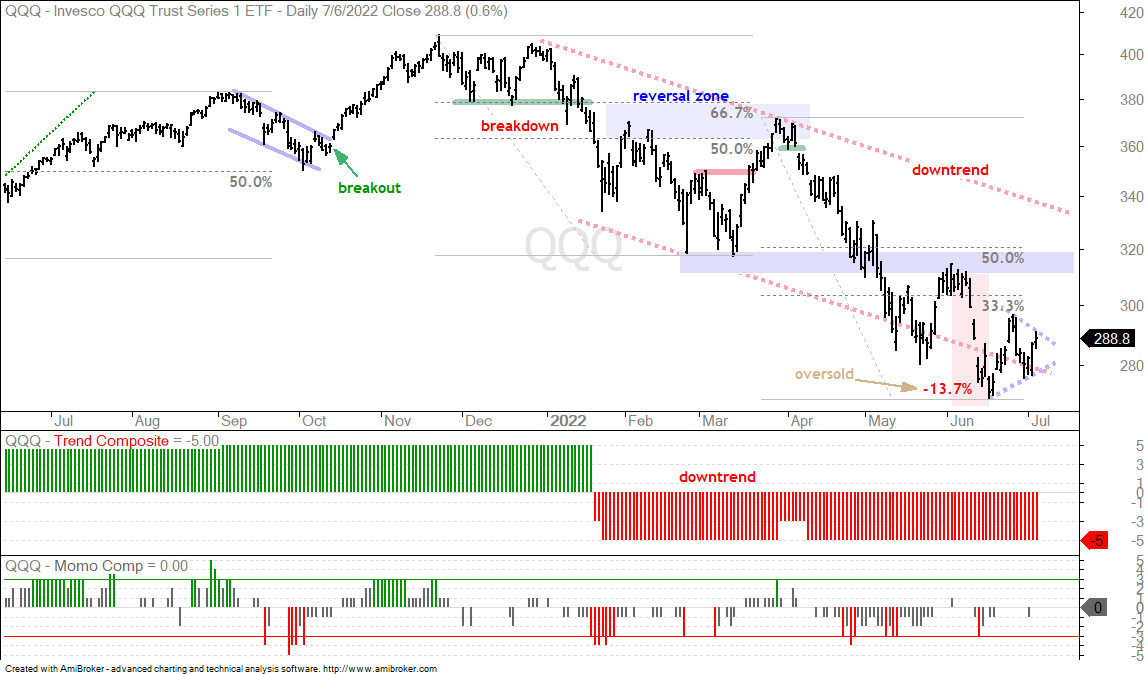
The next chart shows QQQ flirting with the lower line of the falling channel. Dips below this line create oversold conditions that can give way to bounces. QQQ is trying to bounce, but this bounce is not getting much traction and a pennant is also possible (blue dashed lines). Should the bounce extend, the resistance reversal zone is set in the 310-320 area.
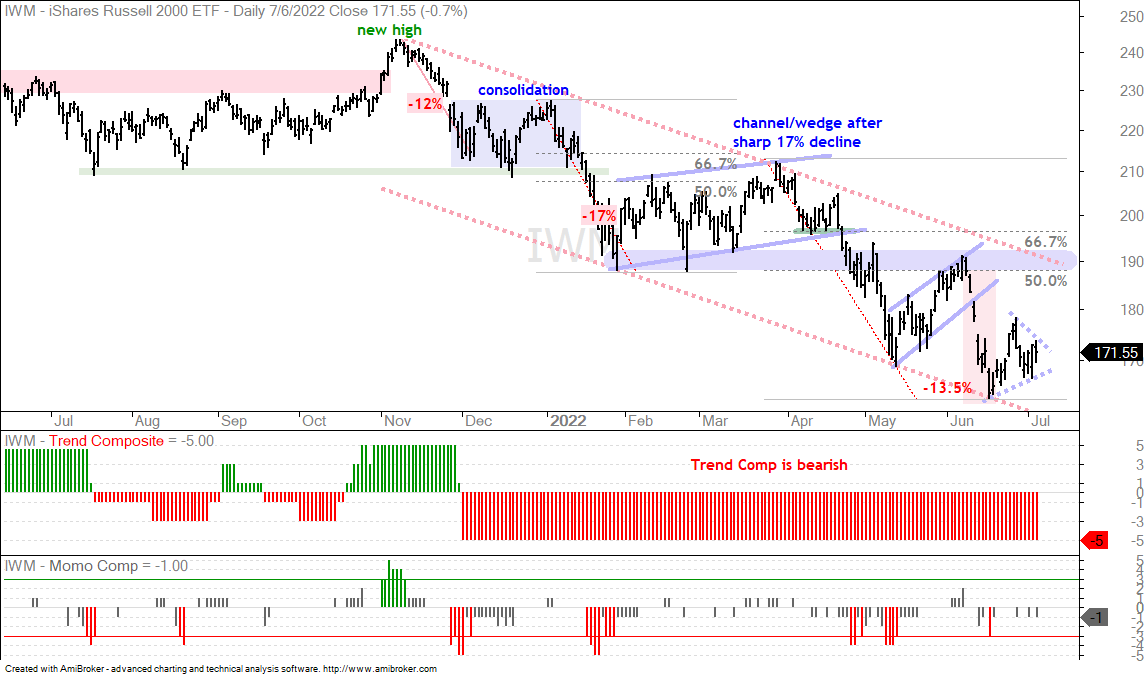
The next chart shows IWM with a resistance reversal zone around 190 and a possible pennant taking shape.
The Trend Composite aggregates signals in five trend indicators: Bollinger Bands (125,1), Keltner Channels (125,2), 5-day Rate-of-Change of 125-day SMA, StochClose (125,5) and CCI-Close (125). The Trend Composite and ten other indicators are part of the TIP Indicator Edge Plugin for StockCharts ACP
Oil Breaks Short-Term Support
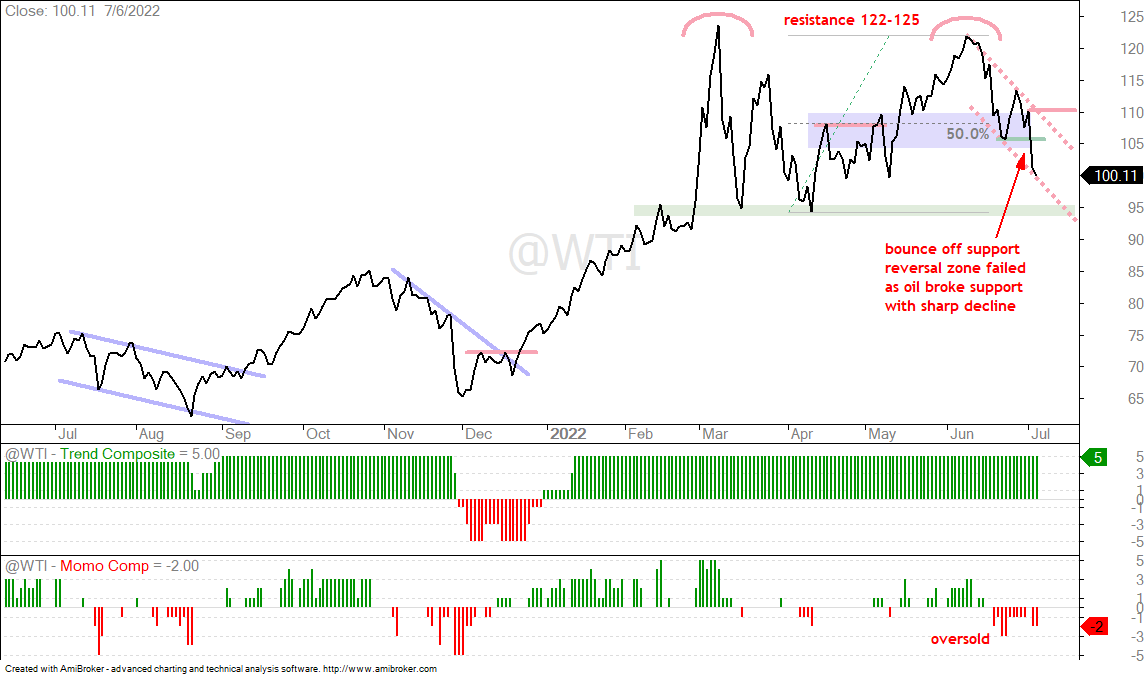
West Texas Intermediate ($WTIC) fell 10% the last two days and broke support at 105 with a vengeance. Technically, the long-term trend is up because WTI remains above the April low and the Trend Composite is still positive. The short-term swing is clearly down as WTI hit resistance in the 123 area twice (red arcs) and fell sharply the last few weeks. The red falling channel defines this downswing with resistance marked at 110.
The Momentum Composite aggregates signals in five momentum-type indicators to identify short-term overbought and oversold conditions. This indicator is part of the TIP Indicator Edge Plugin for StockCharts ACP
Energy SPDR Hangs on to Uptrend (XLE)
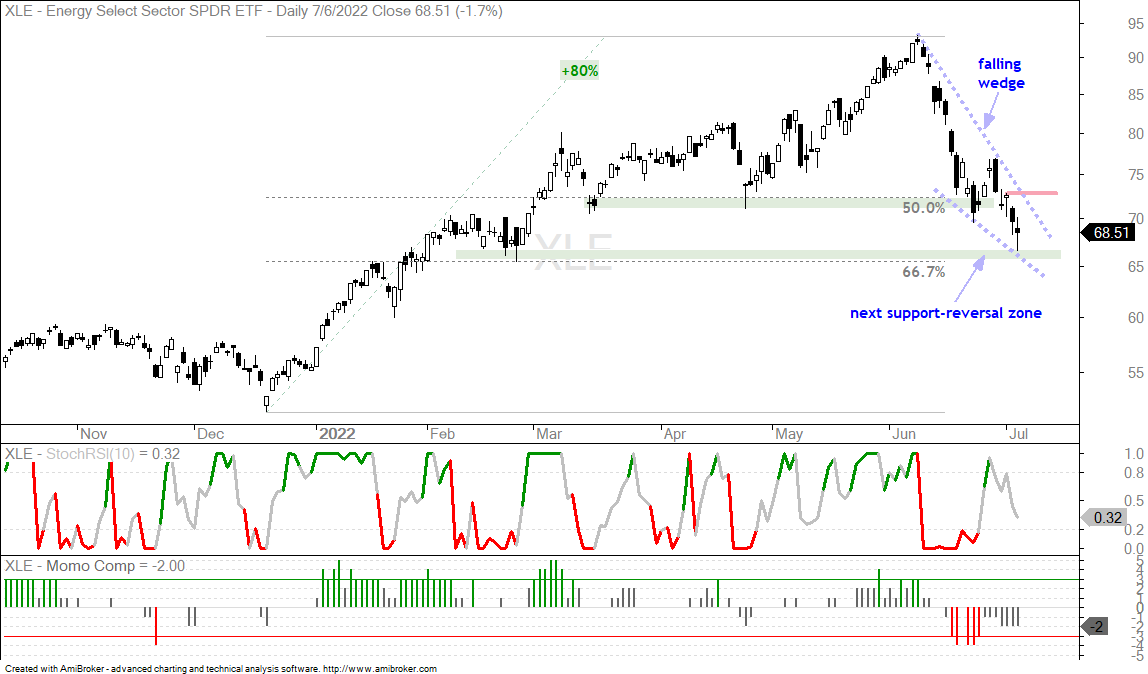
The Energy SPDR (XLE) and other energy-related ETFs fell along with oil and natural gas the last few weeks. A few were setting up in support-reversal zones in late June and even popped on 27-28 June, but these pops failed to hold as they dropped below their June lows this week. The declines triggered the ATR Trailing Stops and it is back to the drawing board. XLE is now at its second support-reversal zone marked by the February low and 66.7% retracement line. A possible falling wedge is also taking shape (blue dashed lines). A break above the July 1st high (red line) would provide the first sign that this correction is ending.
Oil & Gas Equipment & Services ETF Overshoots (XES)
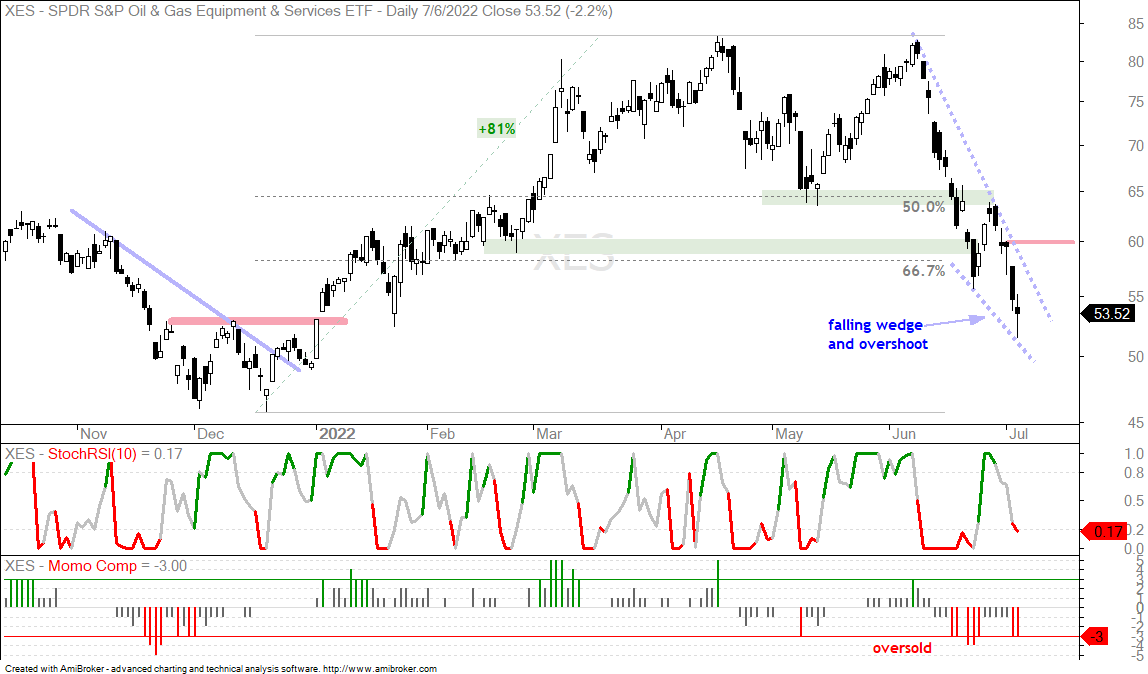
Keep in mind that volatility in oil, XLE and especially the Oil & Gas Equipment & Services ETF (XES) is high. Oil and XLE are still in uptrends technically, but the Trend Composite turned negative for XES as it fell some 35% the last four weeks. Also note that an 81% advance preceded this decline. As with XLE, a falling wedge is taking shape. XES, however, overshot its support-reversal zone by a wide margin. Oil, XLE and XES are highly correlated and will move in the same direction. As such a breakout at 110 in oil and breakout in XLE would be bullish for XES. The immediate swings is down for XES and I am marking resistance at 60.
Commodities Hit Across the Board
It has been a blood bath in the commodity markets since June. The PerfChart below shows the continues futures contracts for twelve commodities. Nine of twelve are down more than 10% and five of twelve are down more than 20% ($COPPER, $NATGAS, $WHEAT, $SOYBEANS, $CORN). The three with the smallest declines are $PALLADIUM, $GOLD and $COFFEE. Note that I would not read too much into the smaller decline in gold because it has relatively low volatility. The monthly annualized standard deviations are $GOLD (15.5%), $COFFEE (33%) and $PALLADIUM (42%). A 5% decline in gold is much more significant than a 5% decline in the other two.
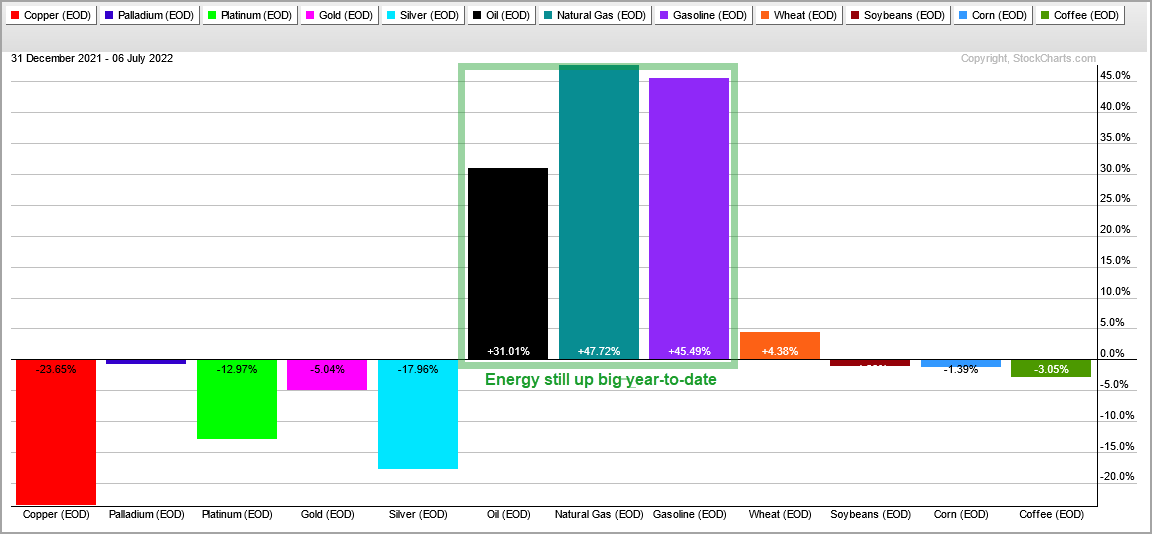
The next PerfChart shows year-to-date performance. The metals are down year-to-date and $PALLADIUM shows the smallest loss. $WTIC, $NATGAS and $GASO are up big still. The grains are mixed with $WHEAT holding on to a small gain and $COFFEE is down around 3%.
Coffee Battles to Hold its Breakout (JO)
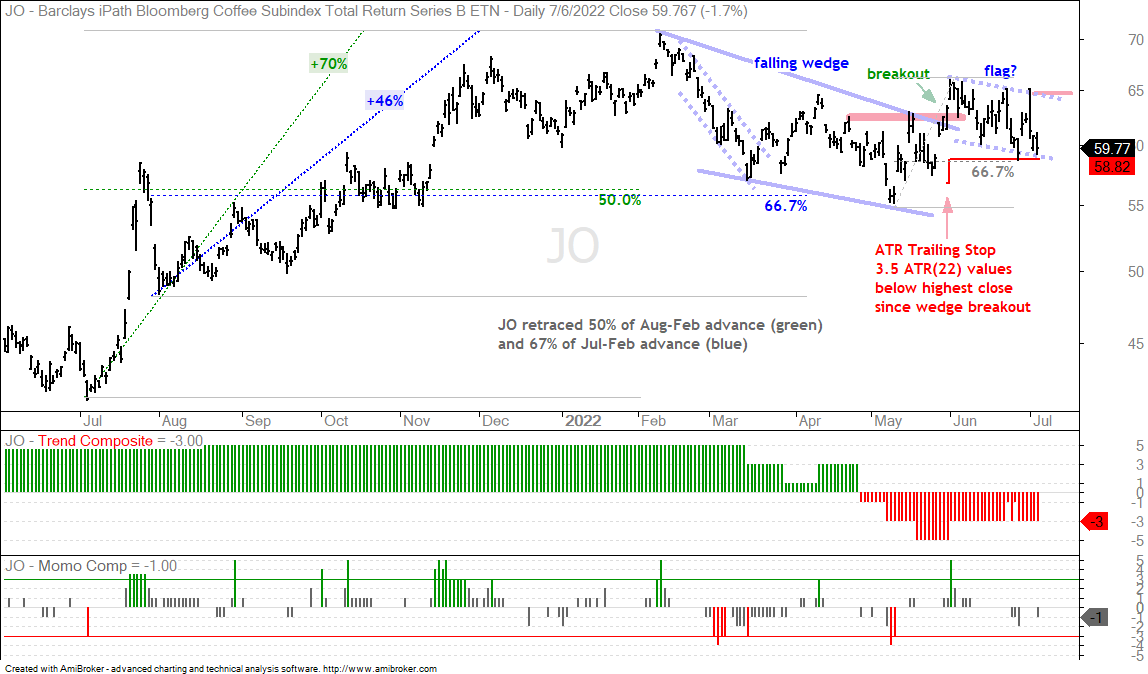
The Coffee ETF (JO) remains with a potentially bullish setup, but it is very close to triggering the ATR Trailing Stop. JO broke out of a falling wedge pattern in late May and then edged lower the last five weeks. There was no follow through to the wedge breakout as commodities got slammed in June. JO, however, is holding above its late May low and is just above the ATR Trailing Stop, which is 3.5 ATR(22) values below the highest close since the late May breakout. I will cry uncle should JO close below 58.82. It is also possible that there is a falling flag forming and this flag retraced 66.7% of the prior surge (blue dashed lines). A breakout at 65 would be bullish.
You can learn more about exit strategies in this post, which includes a video and charting options for everyone.
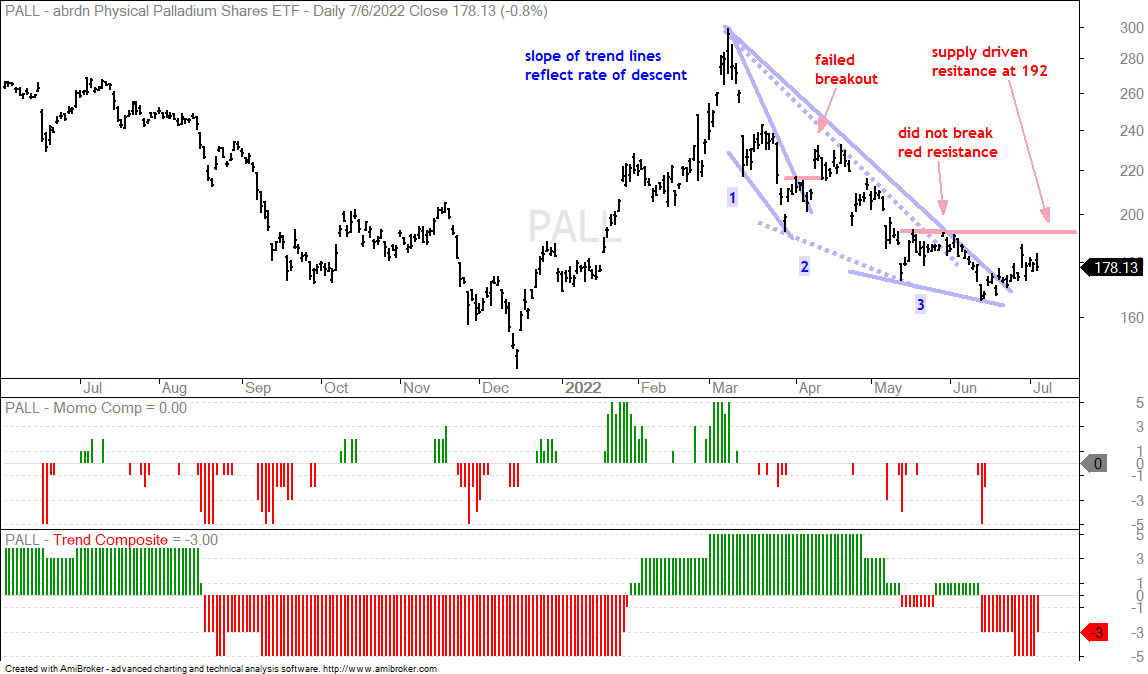
A Third Wedge Unfolds for Palladium (PALL)
The Palladium ETF (PALL) is holding up better than the other commodity ETFs the last five to eight weeks, but it is still in a downtrend. The first chart tells the story of three wedges. PALL broke out from the first wedge with a big move in early April, but this breakout failed with an even bigger move lower. The ETF was on the verge of breaking out from the second wedge, but never broke the prior high (red resistance line). This brings us to the third wedge. The ETF broke the upper trendline, but this just tells us that the rate of descent is slowing. The slope of the trend reflects the rate of descent. Even though PALL broke the trendline, the true resistance level is the supply driven resistance line at 192. PALL was turned back at this level twice in May and once in early June. A breakout at 92 would signal an increase in demand and produce a demand driven breakout.
Healthcare SPDR Show Relative Strength and Bull Flag (XLV)
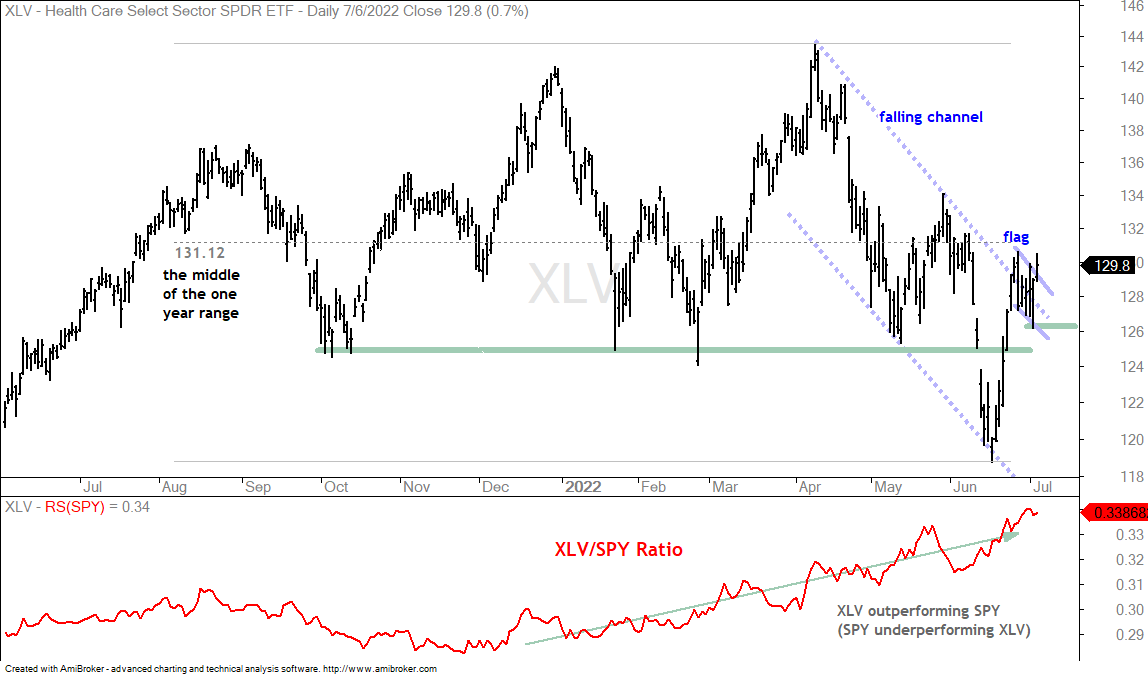
The defensive groups are holding up better than the broader market and showing “relative” strength, but the trends on their price charts are flat. Relative strength can be measured using ratio charts, such as the XLV/SPY ratio. The ratio rises when the numerator (XLV) rises faster than the denominator (SPY). The ratio ALSO rises when the denominator (SPY) falls faster than the numerator (XLV). In an ideal world, we want the price of the underlying to be in an uptrend and the relative performance line to be in an uptrend. This means price is rising and the ETF is outperforming. Currently we are seeing prices move sideways for XLV and others, while the relative performance lines move higher. This is not an ideal trading setup because the rise in these relative performance lines is driven by the faster decline in SPY (not the faster rise in XLV).
The chart above shows XLV trading just below the mid point of its one year range, which is 131.15 (left side). XLV forged a 52-week high in April and a 52-week low in June. The trend is flat at best. XLV showed relative strength since mid June as it surged above the channel trendline. The ETF then consolidated with a falling flag and broke out of this flag on Thursday. A flag is a short-term continuation pattern. The prior move was up (June surge) and this makes it a short-term bullish continuation pattern. The flag breakout is holding, but be careful because overall conditions are less than ideal. A move below 126 would negate this setup.
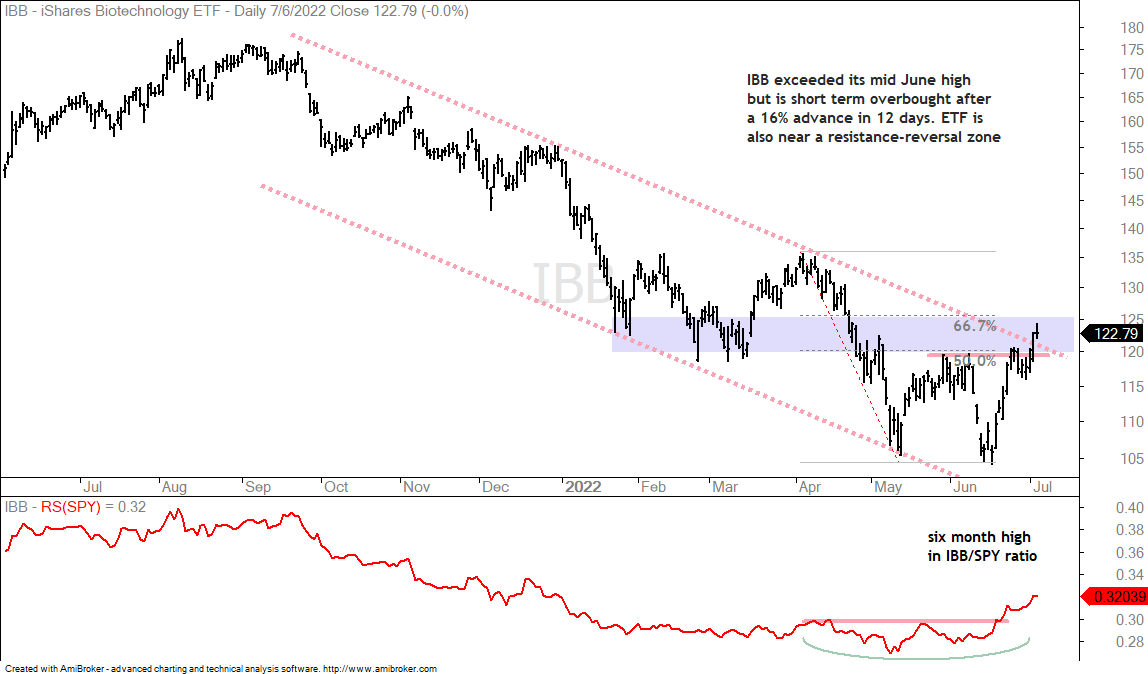
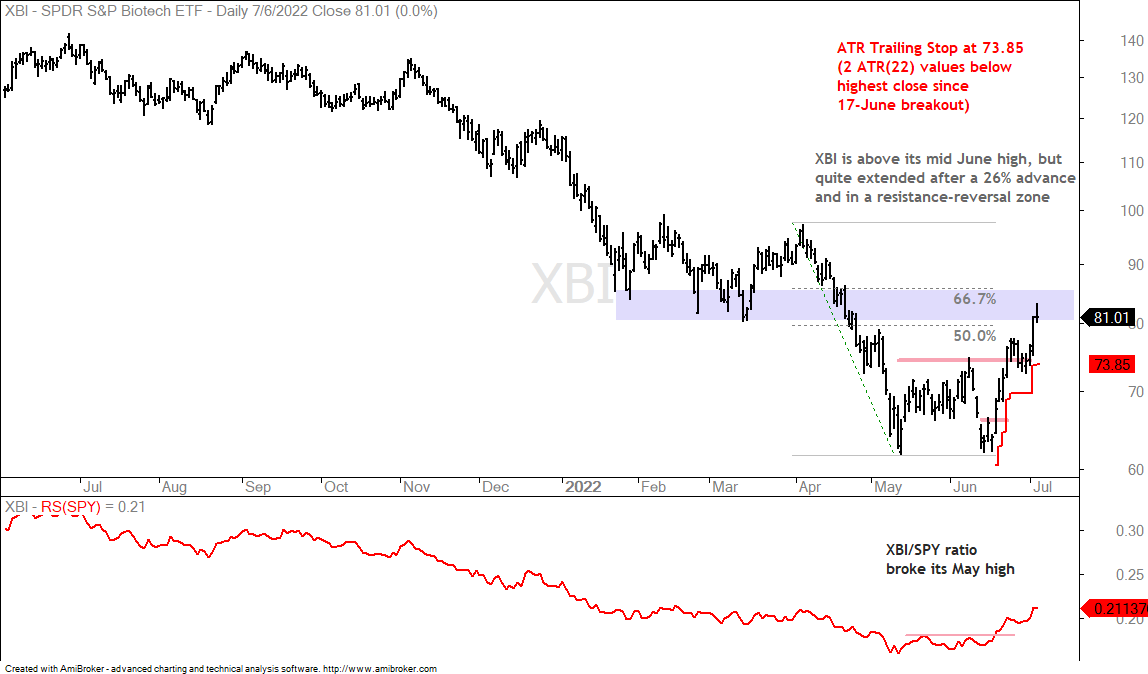
Biotech ETFs Extended after big Moves (XBI, IBB)
The Biotech ETF (IBB) also led the market over the last few weeks with a 16% advance in 12 days. The ETF broke the upper line of the falling channel and the price relative (IBB/SPY ratio) hit its highest level of the year. IBB is starting to outperform SPY and a 16% advance in 12 days is an outsized move that can jump start a trend reversal. IBB may be in the process of reversing its downtrend, but the ETF is short-term overbought after the sharp 12 day advance and in a resistance-reversal zone marked by the 50-67% retracements, broken supports and early May high (blue shading). Now is probably not the time to chase.
The next chart shows the Biotech SPDR (XBI) with a 26% advance the last 12 days. As with IBB, XBI is overbought short-term and in a resistance-reversal zone marked by broken supports and the 50-67% retracement. This red line marks the ATR Trailing Stop, which is at 73.85 currently.
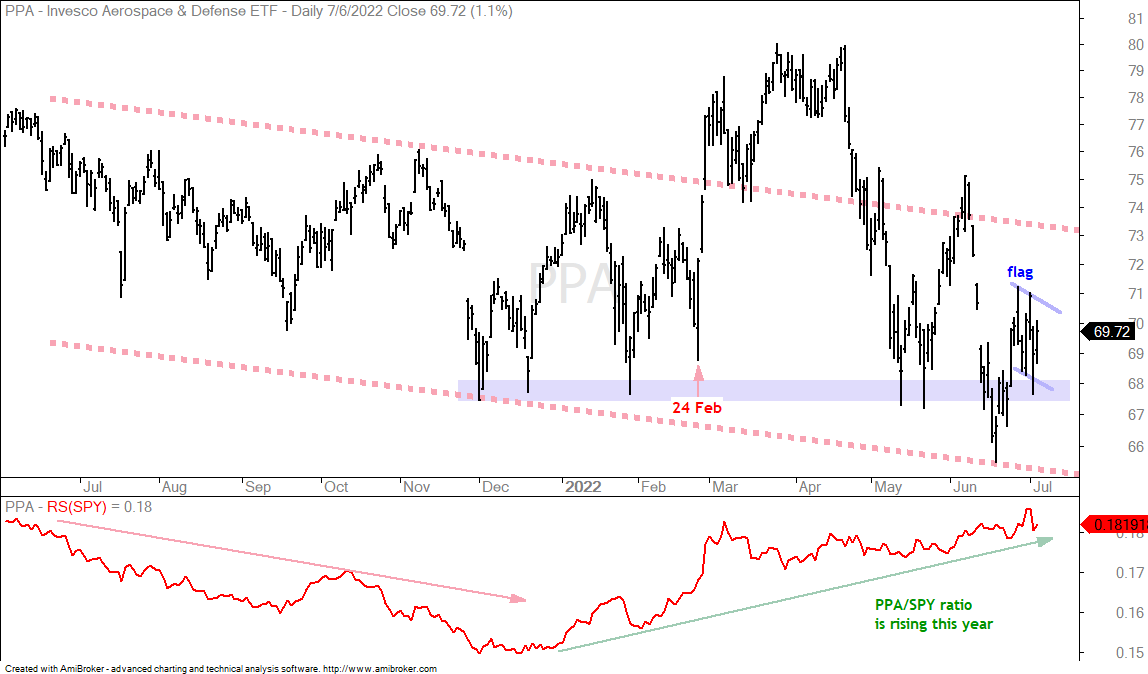
Aerospace & Defense ETF Holds Up Better than SPY (PPA)
I highlighted the Aerospace & Defense ETF (PPA) in Wednesday’s video because it showed relative strength. PPA is back above its December-May lows and holding up better than SPY, which is well below its December lows. As with XLV above, PPA is not in an uptrend. In fact, PPA is more in a downtrend because it is back in the falling channel that existed before Russia invaded Ukraine (24 February). The price relative (PPA/SPY ratio) is rising because PPA is holding up better than SPY. PPA bounced back above the blue zone, which marks the December-May lows and then formed a volatile consolidation that could be a fat flag. A breakout at 71 would be short-term bullish here.
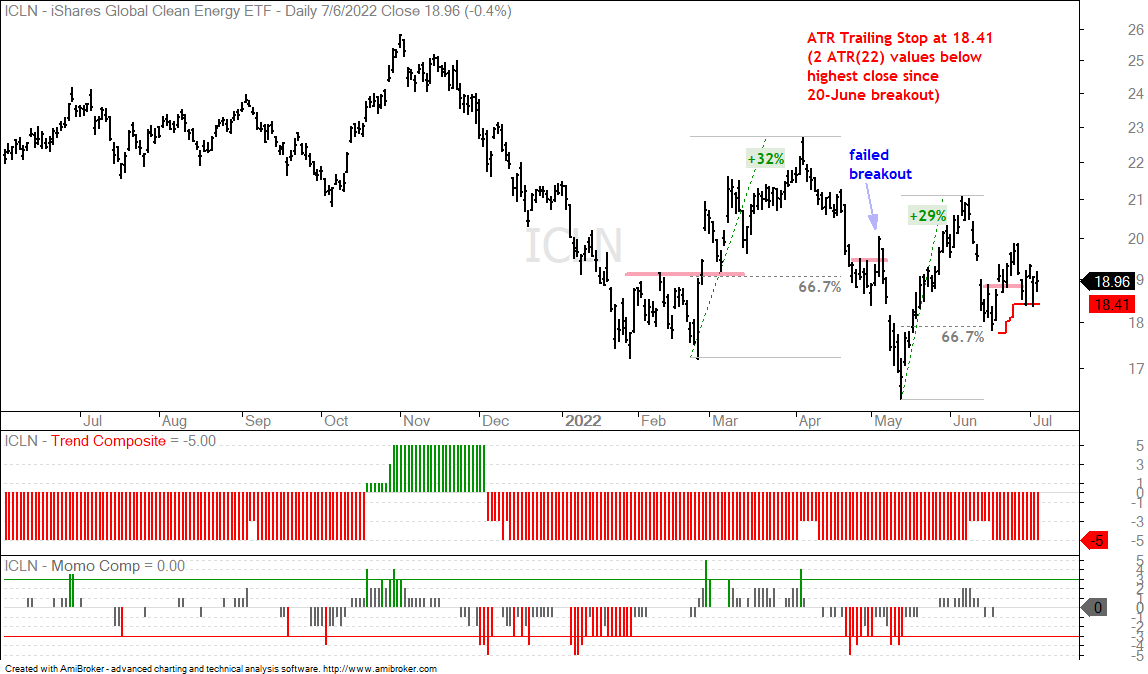
Global Clean Energy ETF Holds above Stop (ICLN)
The next chart shows the Global Clean Energy ETF (ICLN) holding just above its ATR Trailing Stop, which is at 18.41 currently.
")