")
As noted in Tuesday’s report and in Wednesday’s video, the majority of ETFs in the Master List (274) are in downtrends. There are a few groups holding up, but even energy and agriculture were hit with selling pressure here in June. Mr Market is dazed, confused and volatile. Today’s report will highlight some ETFs that held up this year and in June. We are still in a bear market and the seas are rough so think hard and plan your trade before making it.
About the ETF Trends, Patterns and Setups Report
This report contains discretionary chart analysis based on my interpretation of the price charts. This is different from the fully systematic approach in the Trend Composite strategy series. In this ETF Trends, Patterns and Setups report, I am looking for leading uptrends and tradable setups within these uptrends. While I use indicators to help define the trend and identify oversold conditions within uptrends, the assessments are mostly based on price action and the price chart (higher highs, higher lows, patterns in play). Sometimes the chart assessment can be at odds with the indicators.
You can learn more about my chart strategy in this article covering the different timeframes, chart settings, StochClose, RSI and StochRSI.
Year-to-date and June Performance
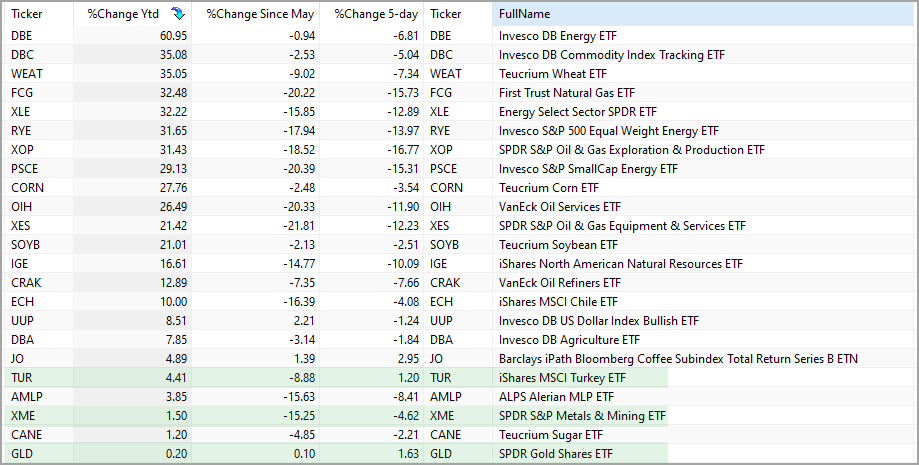
It has been a brutal year for most assets outside of energy and agriculture commodities and energy-base stock ETFs. Of the 274 ETFs in the Master ETF List, only 23 are up year-to-date. The MSCI Turkey ETF (TUR) is the only stock-index ETF that is positive year-to-date (+4.41%), while the Gold SPDR (+.20%) and the Metals & Mining SPDR (+1.5%) are the only non-energy non-agriculture ETF with gains. For reference, 133 of the 274 ETFs (48.5%) are down more than 20%, including the S&P 500 SPDR (SPY), which is down 21.17% this year.
June has also been a brutal month with 258 of the 274 ETFs (94%) falling this month. 107 of the 274 ETFs (39%) are down more than 10%. The table below shows the ETFs that are positive so far in June with one group standing out: Chinese equities. Several Chinese ETFs are up so far this month with the China A-Shares 300 ETF (ASHR) up 4.57%. Talk about relative and absolute strength.
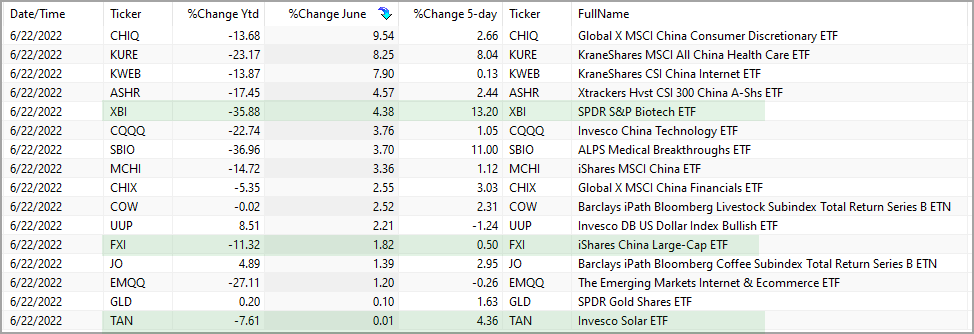
The table above highlights two others: the Biotech SPDR (XBI) and the Solar Energy ETF (TAN). Solar is probably tied to strength in China. Biotech, however, is its own beast and showing some strength here in June.
The next table shows the overlap between the two. Only three ETFs are up year-to-date and up here in June. They are the Gold SPDR (GLD), Coffee ETF (JO) and Dollar Bullish ETF (UUP). Yes, gold and the Dollar are both positive. This alone tells us that something is not quite right in the markets.

China A-Shares 300 ETF Nears Resistance-Reversal Zone
The first chart shows the China A-Shares 300 ETF (ASHR) with a failed wedge breakout and failed Trend Composite signal in December-January. ASHR broke down with the rest of the world in January. After a 30% decline into early May, the ETF formed a small Double Bottom and broke out in late May with a big move into June.
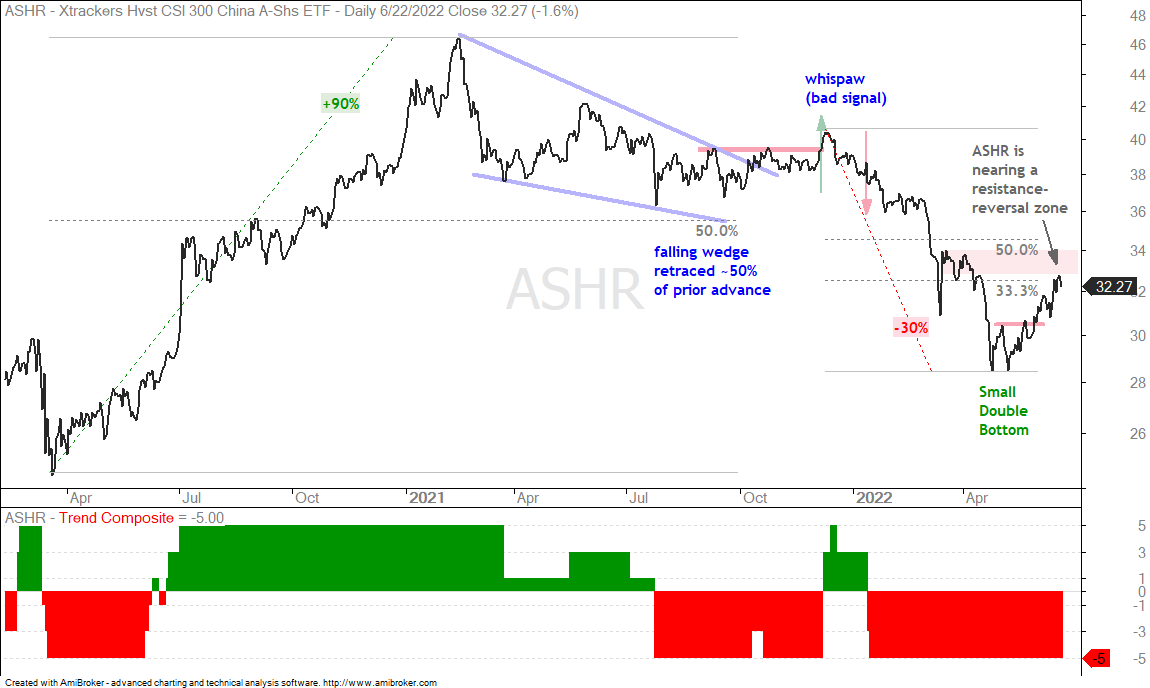
While I am impressed with relative and absolute strength in ASHR and other Chinese equities, the Trend Composite is still negative and the ETF is nearing a resistance-reversal zone. Notice that this decline retraced just over 33% of the prior decline and is nearing a resistance zone in the 33-34 area (red shading). This is also the first big move and I am more of a second mover trader. In other words, either wait for the Trend Composite to turn bullish for a signal or wait for a tradable pullback after the Trend Composite turns positive. Patience can be a virtue.
Coffee ETF and the Tale of Two Trend Composites
The price chart for Coffee ETF (JO) has been covered regularly over the last few weeks because there is a falling wedge breakout working. Even though the Trend Composite (125) is negative, an objective (hopefully) look at the price chart suggest that this wedge is a normal pullback after a new high. The wedge breakout, therefore, signals a continuation higher.
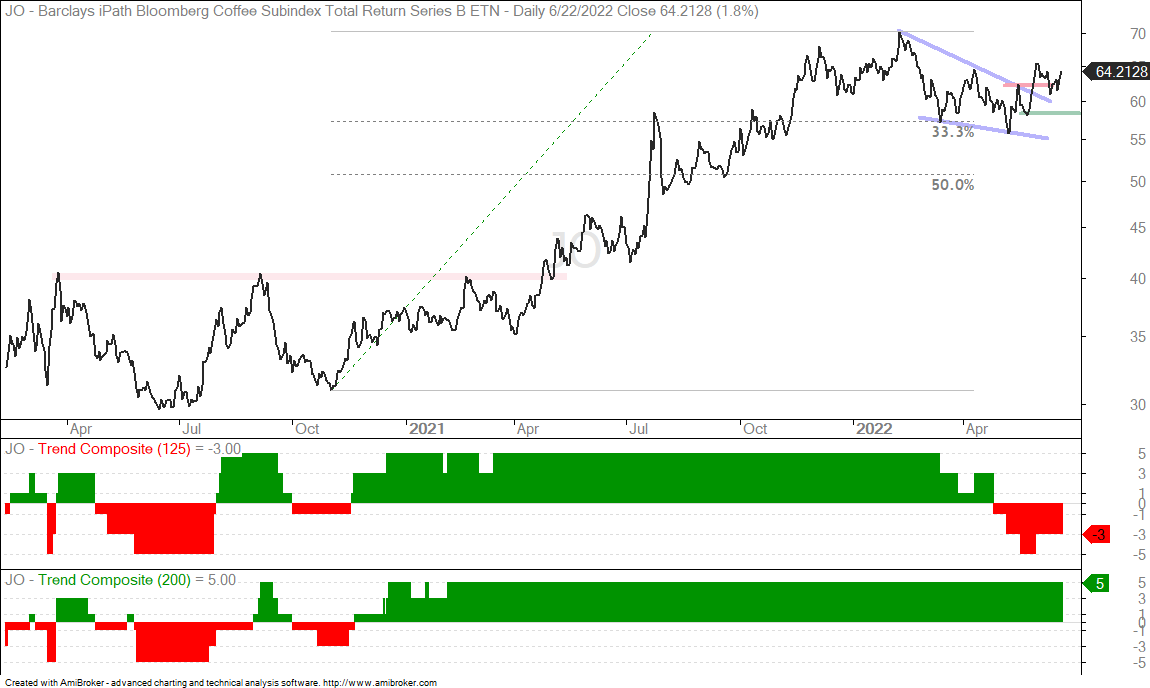
The bottom windows show the Trend Composite with two settings: 125 days and 200 days. 125 days covers six months and 200 days covers a little over nine months. Choosing a setting is often the most challenging decision for indicators. A more sensitive setting (125) typically generates earlier signals and more whipsaws. A longer setting (200) has more lag and fewer whipsaws. This is almost always the tradeoff. The key is to pick a setting and stick with it.
The more sensitive Trend Composite (125) turned negative in late April, but the less sensitive Trend Composite (200) remains positive. Which one is right? In this case, I defer to the price chart and consider the wedge breakout as bullish until proven wrong with a close below 58 (green line).
The Trend Composite aggregates signals in five trend indicators: Bollinger Bands (125,1), Keltner Channels (125,2), 5-day Rate-of-Change of 125-day SMA, StochClose (125,5) and CCI-Close (125). The Trend Composite and ten other indicators are part of the TIP Indicator Edge Plugin for StockCharts ACP
Biotech SPDR Forms Small Double Bottom (XBI)
I covered the Biotech SPDR (XBI) on Tuesday and will show a longer term chart today. XBI tested the lows from January 2018 and March 2020 with two bounces in as many months. I am not a big fan of long-term support levels that are more than a year old. XBI some 140 component stocks, these components change over time and each has its own support/resistance levels. The fact that XBI is bouncing off the January 2018 and March 2020 lows is more of a coincidence, in the Book of Hill.
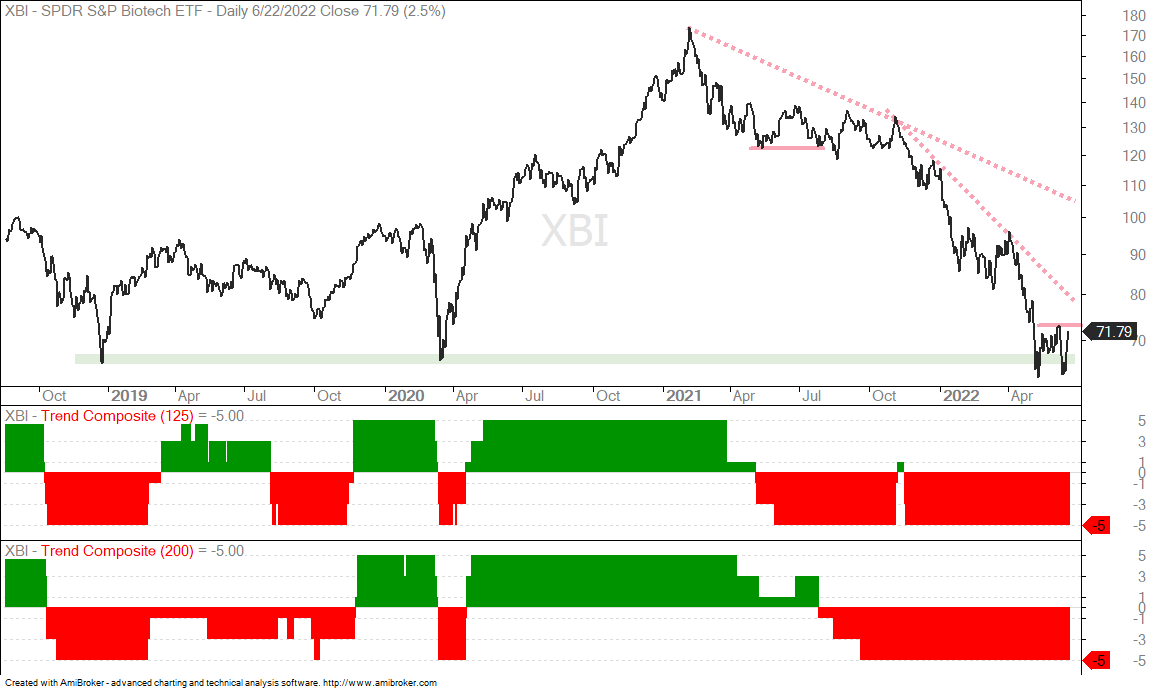
Having demeaned long-term support levels, it is perhaps worth noting that XBI held its May low in June and most other ETFs broke this low. This means XBI held up better than most and a small Double Bottom could be taking shape, as with ASHR above. This is a bottom picking setup because the trend is down, the ETF hit a 52-week low in May and both Trend Composites are negative.
You can learn more about exit strategies in this post,
which includes a video and charting options for everyone.
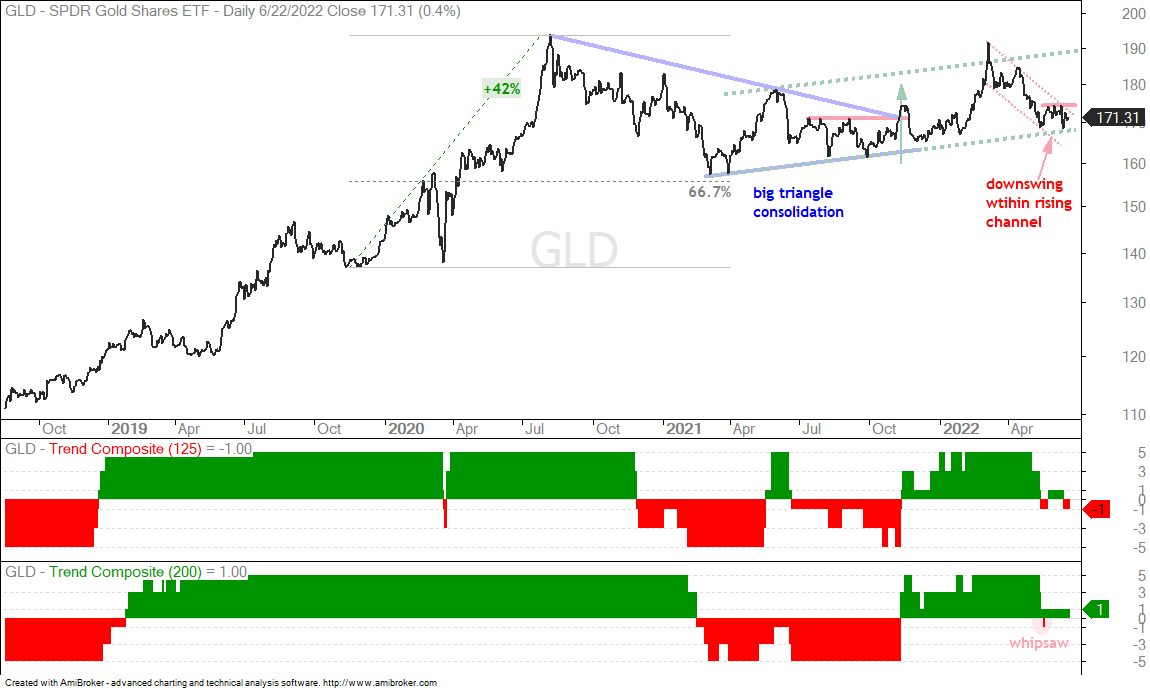
Gold SPDR Tests Channel Support (GLD)
The Gold SPDR (GLD) fell with other metals-based commodities over the last few months, but remains above its January lows. Even though I can make a long-term bullish case for this chart, the immediate trend is down and GLD is at a make or break point. First, GLD hit a new high in August 2020, formed a large triangle with a 67% retracement of the prior advance and broke out with a surge in early November 2021 (green arrow). The ETF then traced out a rising channel and is trading near the lower trendline after a sharp decline from the early March high. A falling channel defines this downswing and a break above 175 would be bullish (make). A break below the May-June lows (168) would be bearish (or break).
SPY Forges Island Reversal from Oversold Levels
The S&P 500 SPDR (SPY) became extremely oversold last week with a gap-plunge below 370 on Thursday. The ETF then formed an indecisive spinning top candlestick on Friday and gapped up on Tuesday. Overall, the gap down on Thursday, stall on Friday and gap on Tuesday formed an island reversal, which is short-term bullish.
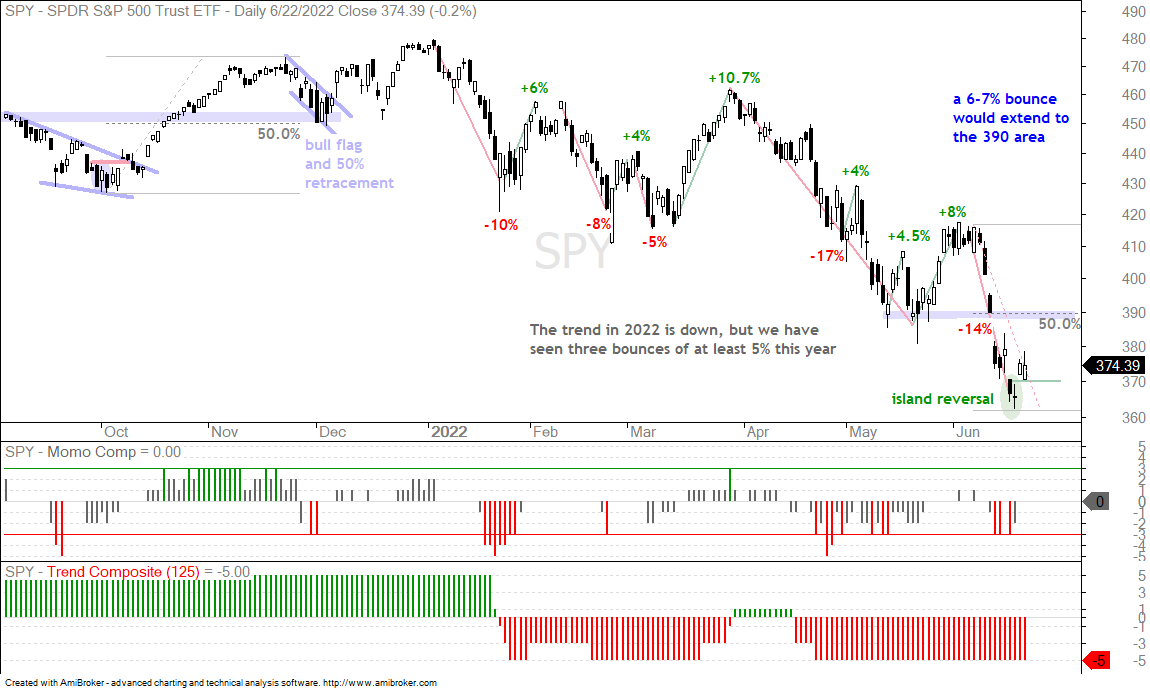
This is, however, a short-term bullish reversal pattern within a bigger downtrend, and in a bear market. An island reversal after a pullback within an uptrend and within a bull market would be worth trading in my book. While this island reversal could give way to further gains, any bounce from a 52-week low and within a bigger downtrend is considered a counter-trend bounce. Be careful. A close below 370 would start filling the gap and provide the first sign of trouble. Broken support and the 50% retracement mark first resistance in the 390 area.
The Momentum Composite aggregates signals in five momentum-type indicators to identify short-term overbought and oversold conditions. This indicator is part of the TIP Indicator Edge Plugin for StockCharts ACP
Previous Commentary and Video
Wednesday Market and ETF Video (here)
Market Regime Update with Breadth Model and Yield Spreads (here)
Topics Covered in Tuesday’s Report (here)
- Breadth Model Negative and Yield Spreads Elevated
- TopTradersUnplugged (Macro Overview)
- Decline Steepens as SPY Becomes Oversold (plus QQQ, IWM)
- Slim Pickings and Lots of Downtrends (Trend Table)
- West Texas Intermediate Enters Support-Reversal Zone ($WTIC, DBE)
- Energy-base Stock ETFs Get Hit Hard (XLE, XES)
- Agriculture ETFs Pull Back within Uptrends (DBA, JO, CANE, WEAT)
- Gold Channels Lower with Short-term Volatility (GLD)
- Three ETF Groups Showing Relative Chart Strength (ICLN, LIT, XBI)
You can learn more about my chart strategy in this article covering the different timeframes, chart settings, StochClose, RSI and StochRSI.