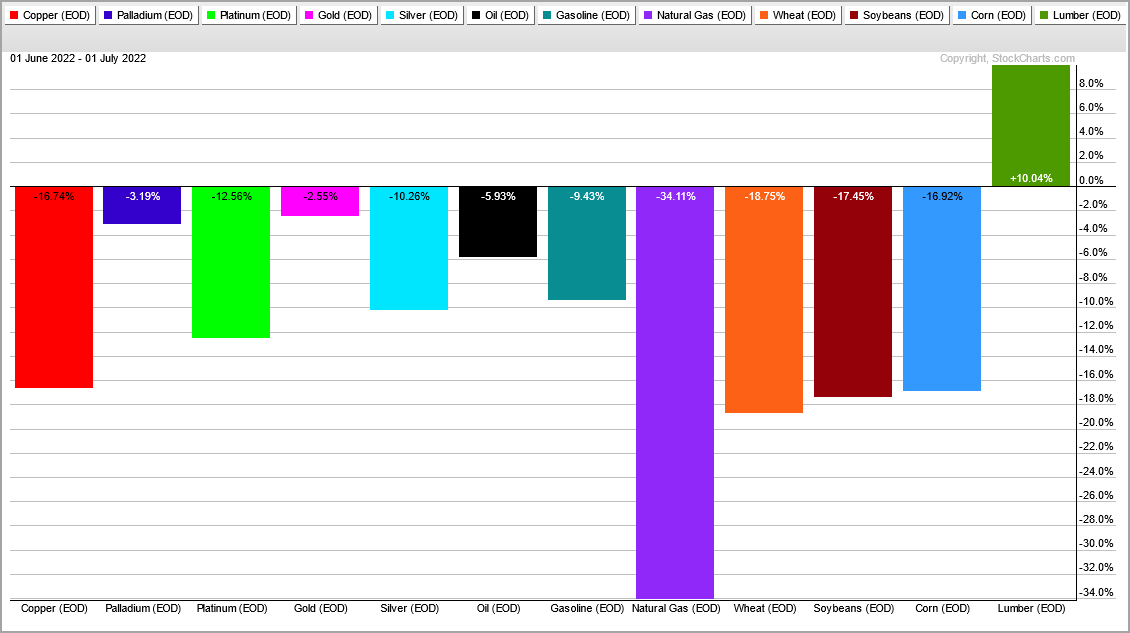
My screen for today’s pre-market price action is a sea of red right now. Stock futures are modestly lower, energy futures are lower, gold is slightly lower, industrial metals are sharply lower and agricultural commodities are sharply lower. The US Dollar Index and Treasury bonds are the only things higher and it is trading at a new high. One day does not a trend make, but this sea of red extends to the medium and long term trends for most ETFs and assets. Almost all stock-based ETFs are in downtrends, industrial metals ETFs are in downtrends and agricultural commodity ETFs broke down in the second half of June. In fact, the PerfChart below shows that most commodities are down since June 1st. Lumber is the exception. The bear market continues to spread and it is most treacherous out there.
About the ETF Trends, Patterns and Setups Report
This report contains discretionary chart analysis based on my interpretation of the price charts. This is different from the fully systematic approach in the Trend Composite strategy series. In this ETF Trends, Patterns and Setups report, I am looking for leading uptrends and tradable setups within these uptrends. While I use indicators to help define the trend and identify oversold conditions within uptrends, the assessments are mostly based on price action and the price chart (higher highs, higher lows, patterns in play). Sometimes the chart assessment can be at odds with the indicators.
This Week's Commentary Schedule
Tuesday – 5 July: Market-ETF Report and Signal-Rank Table Update
Wednesday – 6 July: Market-ETF Video and Market Regime Update
Thursday – 7 July: Market-ETF Report and Signal-Rank Table Update
Saturday – 9 July: ETF Signal and Rank Table
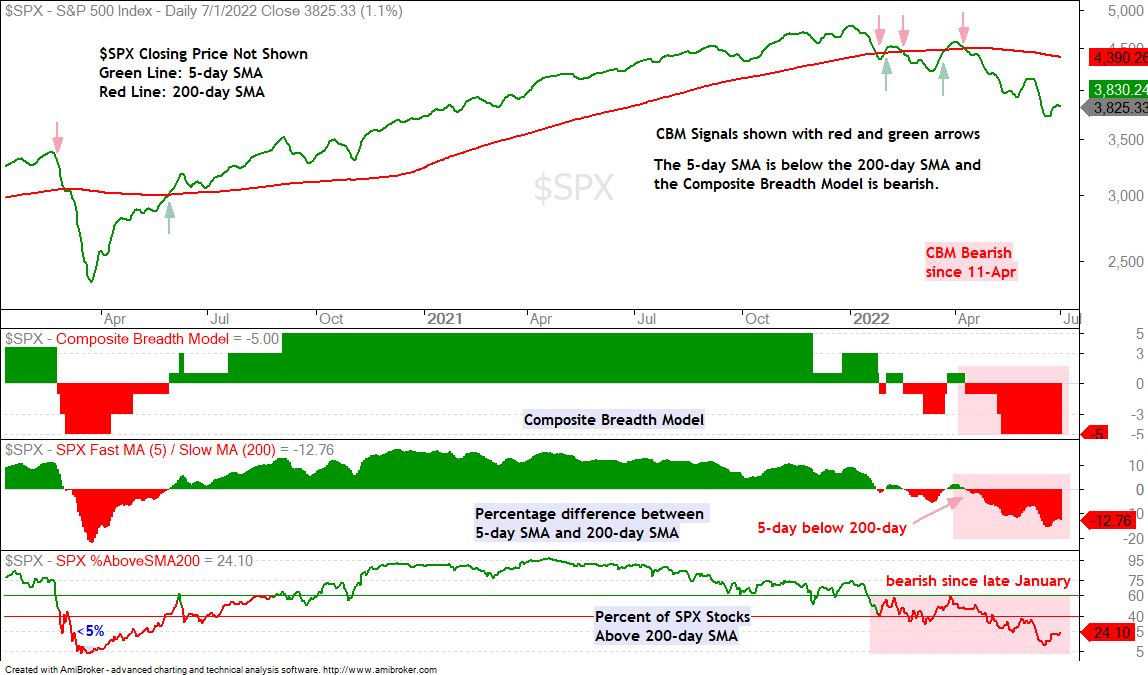
Breadth Model is Negative and Yield Spreads Show Stress
The Composite Breadth Model remains at -5, which means all five inputs are on bearish signals. Overall, the CBM has been bearish since April 11th. The 5-day SMA for the S&P 500 is over 12% below the 200-day and the 200-day SMA is falling. Fewer than 25% of S&P 500 stocks are above their 200-day SMAs, which means more than 75% are below. Note that fewer than 20% of Nasdaq 100, S&P MidCap 400 and S&P SmallCap 600 stocks are above their 200-day SMAs. These are bear market numbers across the board.
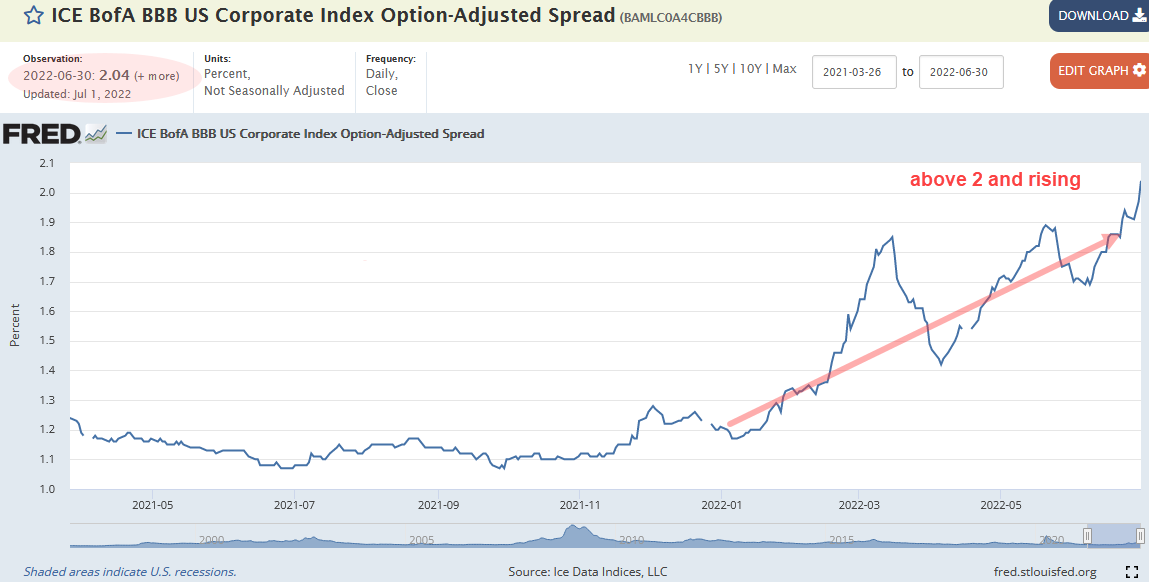
The credit markets continue to show stress as the BBB spread hit a new high for the move on July 1st (2.04). The widening started slowly in October, picked up steam in late November and accelerated in 2022. The spread exceeded 2 for the first time since early July 2020, two years ago. Note that the spread was above 2 and narrowing in July 2020. It is now above 2 and widening, which is negative for the financial markets.
Bear Market and Above Average Volatility
A bearish Composite Breadth Model and rising BBB spread translate into a bearish Market Regime for stocks. In addition, volatlilty is above average so we have the worst of both worlds (downtrends and volatility). Some stocks will buck the bear, but trading the long side during bear markets is a challenge, to say the least. The short side is not any easier because bear market rallies can be very sharp and swift.
260 and the 274 ETFs on the ETF Trend Signal and Ranking Table are on downtrends. Just 14 are in uptrends. Dozens of ETFs are near 52-week lows or recorded 52-week lows in June. Notable 52-week lows over the last five days include: Semiconductor ETF (SOXX), Retail SPDR (XRT), Global Auto ETF (CARZ), Gold Miners ETF (GDX), DB Base Metals ETF (DBB), Copper ETF (CPER), Platinum ETF (PLTM), Silver Miners ETF (SIL), Silver ETF (SLV) and Steel ETF (SLX)
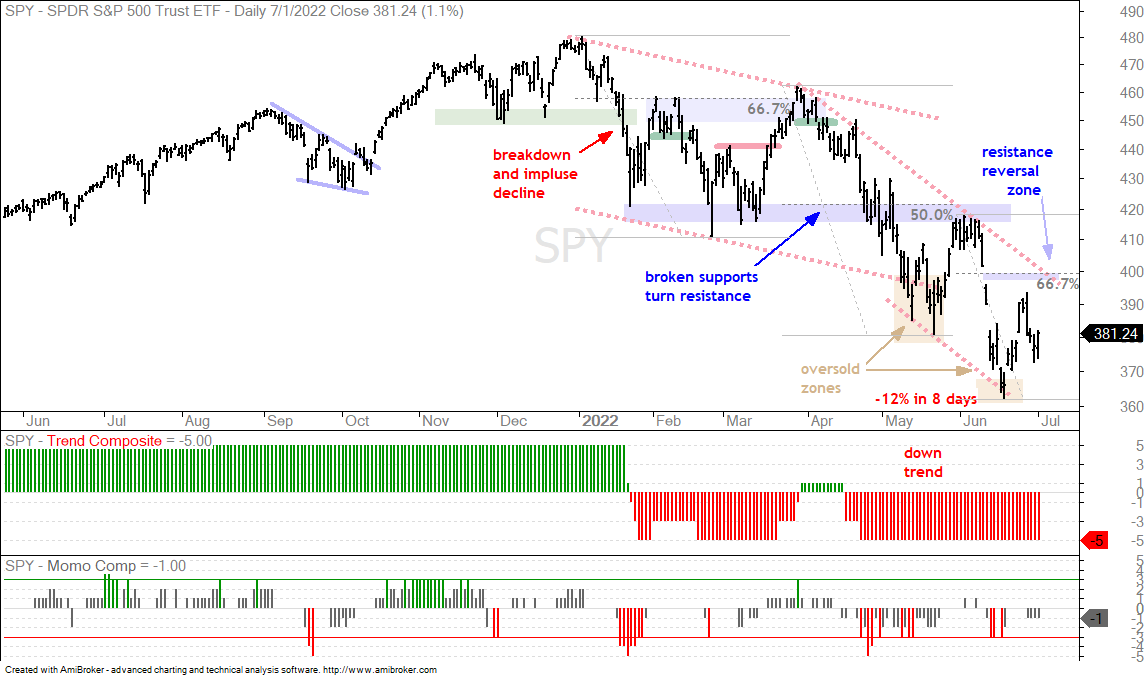
SPY Bounces within Clear Downtrend
SPY, QQQ, IWM
SPY remains in a clear downtrend with two falling channels taking shape this year (red dashed lines). The second from April to June is steeper because the decline accelerated. SPY became very oversold in mid June after a 12% decline in eight days and got an oversold bounce into late June. This 6% four day advance was sharp, but still an oversold bounce or counter-trend bounce within a bigger downtrend. Predicting what will happen within a downtrend is tricky because volatility is above average right now. We could see a bounce to the 400 area or simply choppy trading before a continuation lower. The odds still favor lower prices in the coming weeks and months because the weight of the evidence is bearish.
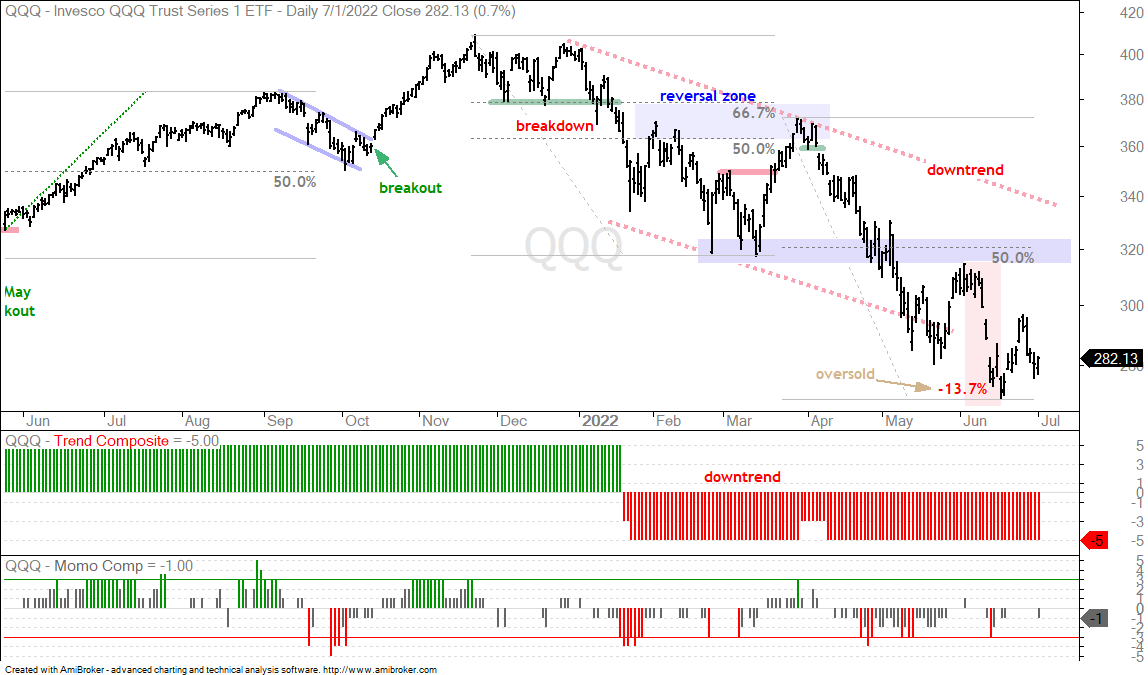
QQQ is also in a clear downtrend.
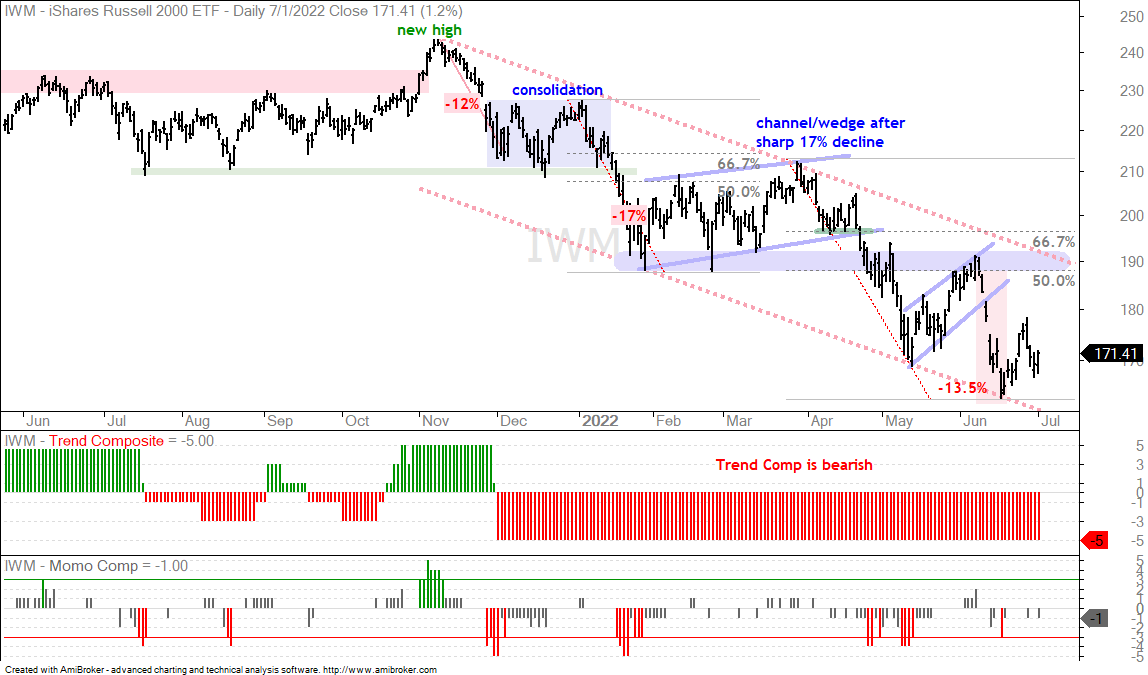
Ditto for IWM.
You can learn more about my chart strategy in this article covering the different timeframes, chart settings, StochClose, RSI and StochRSI.
Oil Stands Alone
$WTIC
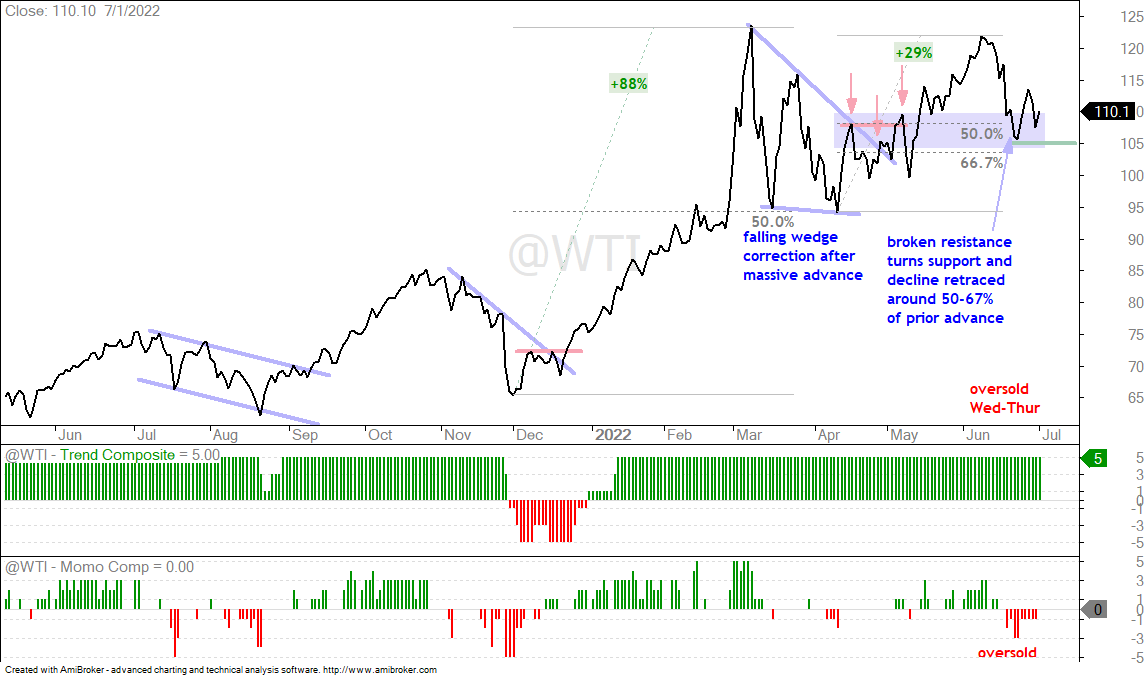
Oil remains in an uptrend and has yet to break down, unlike other commodities. Despite concerns, the trend is up and the June decline is viewed as a pullback within that uptrend. The breakout zone in the 105-110 area turned support and held in late June as oil bounced back above 110. Oil was also oversold in late June as the Momentum Composite dipped to -3 twice. Thus, an oversold bounce within a bigger uptrend is currently in play. The concerns are the downtrends across the board, the breakdowns in industrial metals and possible demand destruction. A break below 105 would be bearish for oil.
DB Energy ETF Hits Support Zone
DBE
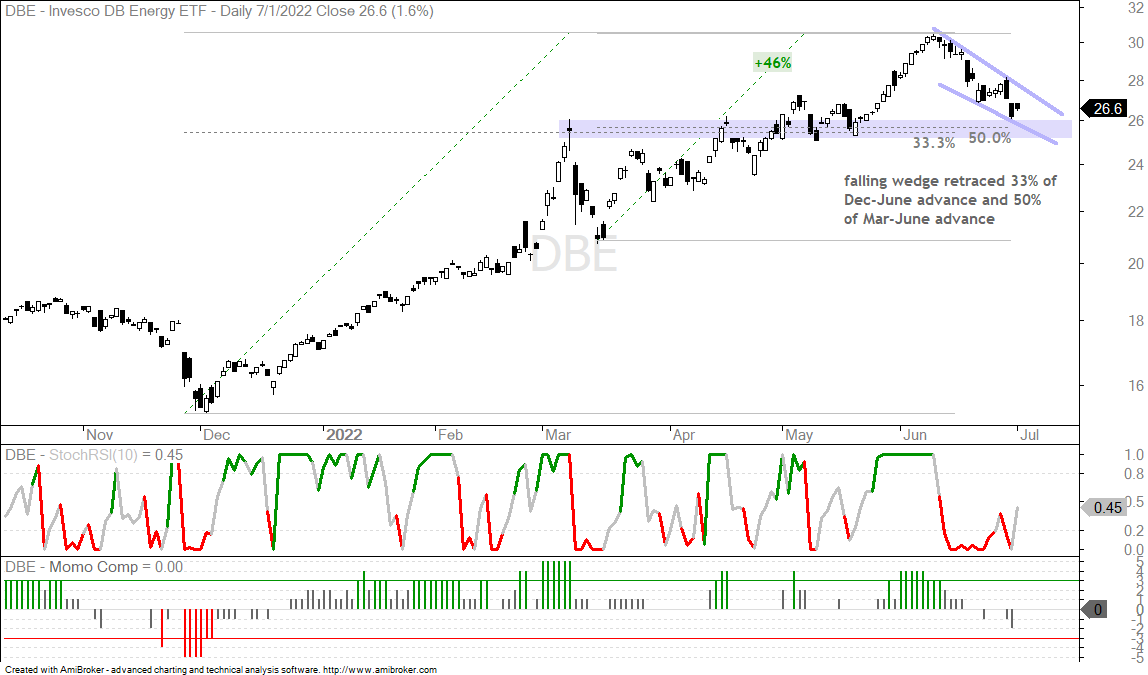
The DB Energy ETF (DBE) is around 50% gasoline, 39% oil and 11% natural gas. This means there are other dynamics at work, but oil is still the main driver here. The ETF fell sharply at the end of June because natty fell 16.5%, gasoline fell 6% and oil fell 3.5% on June 30th. Overall, DBE declined the last few weeks with a falling wedge that retraced 33% and 50% of the prior advances. This looks like a pullback within a bigger uptrend, but the short-term trend is down until we get some sort of bullish signal. A wedge breakout at 28 or a StochRSI pop above .80 would do the trick.
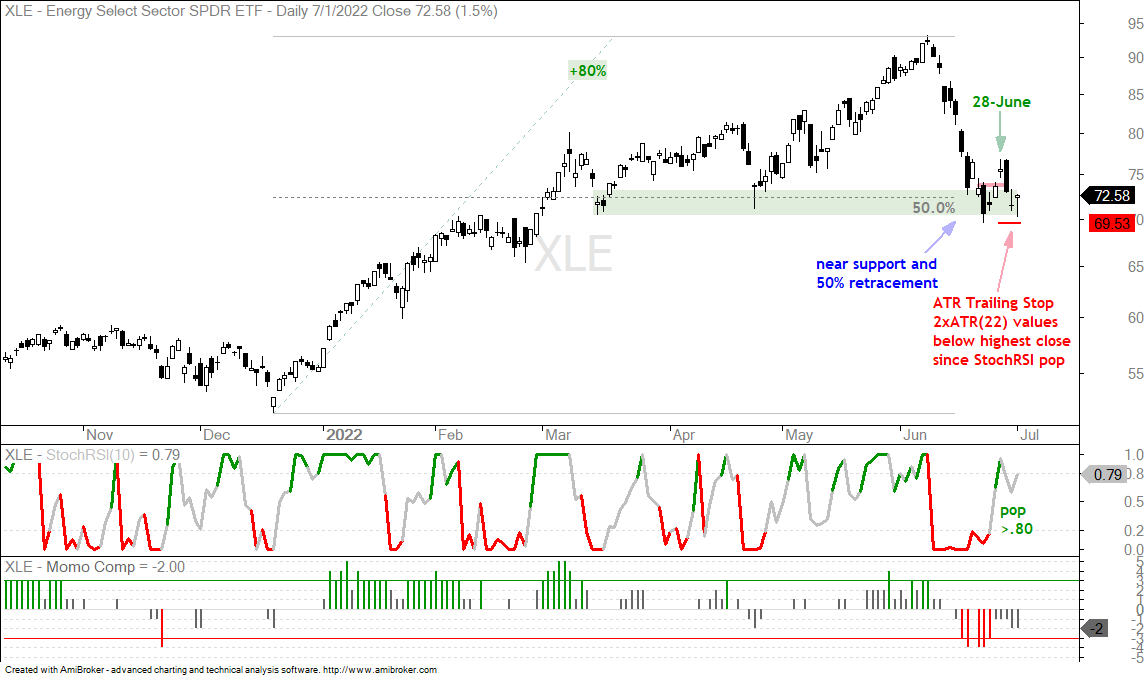
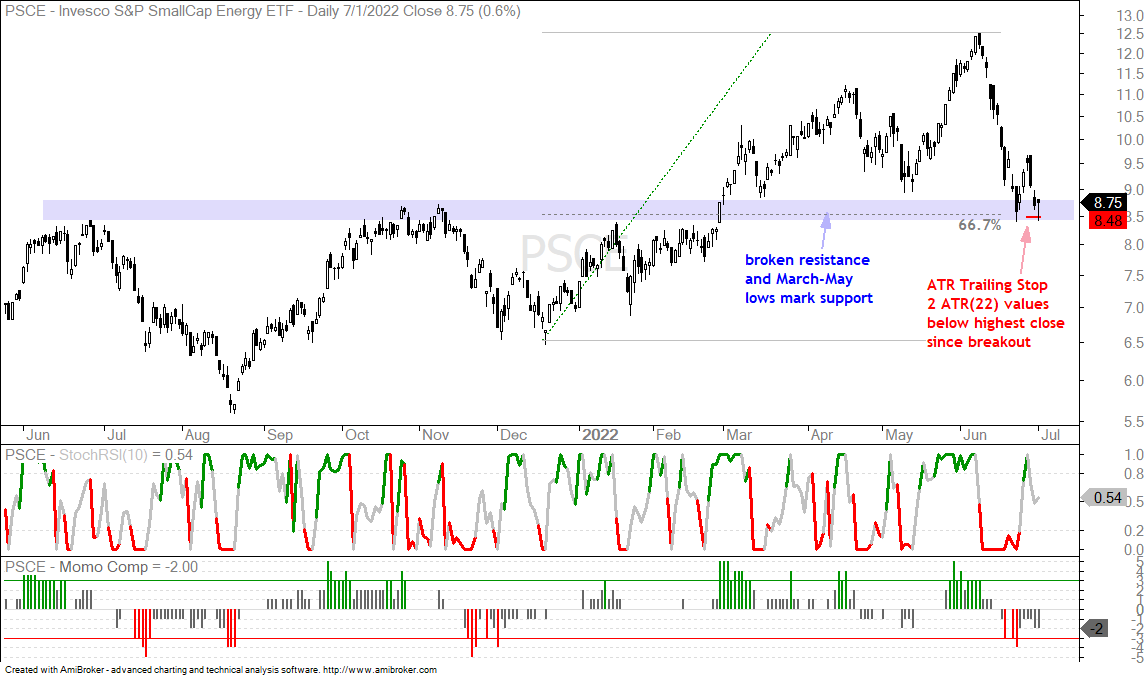
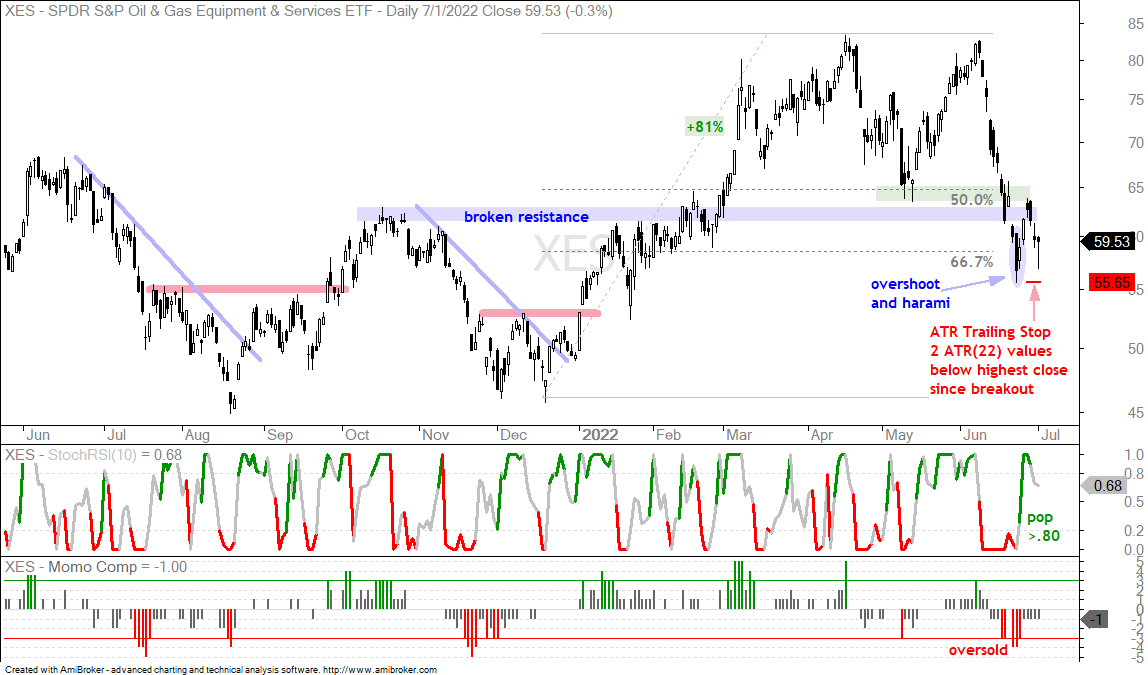
Energy SPDR Tests Support with Volatility
XLE, PSCE, XES
Thursday’s report noted that XLE was by far the most volatile sector and therefore one with above average risk. XLE is living up to this reputation with a 5.7% bounce on June 27-28 and a 5.5% decline the next two days. Ideally, we want uptrends with low volatility. XLE is still in an uptrend, but volatility is high and this makes it less than ideal. XLE firmed on Friday with a hammer type candlestick and continues to tests the support-reversal zone around 70-75. There was a StochRSI pop (bottom window) with the short-term breakout on June 28th. XLE fell back to the support zone and remains above the ATR Trailing Stop, which is 2 ATR(22) values below the highest close since the breakout. A close below 69.53 would trigger this stop. Note that this stop was around 10% below the open the day after the breakout. This reflects the level of risk and volatility.
The Momentum Composite aggregates signals in five momentum-type indicators to identify short-term overbought and oversold conditions. This indicator is part of the TIP Indicator Edge Plugin for StockCharts ACP
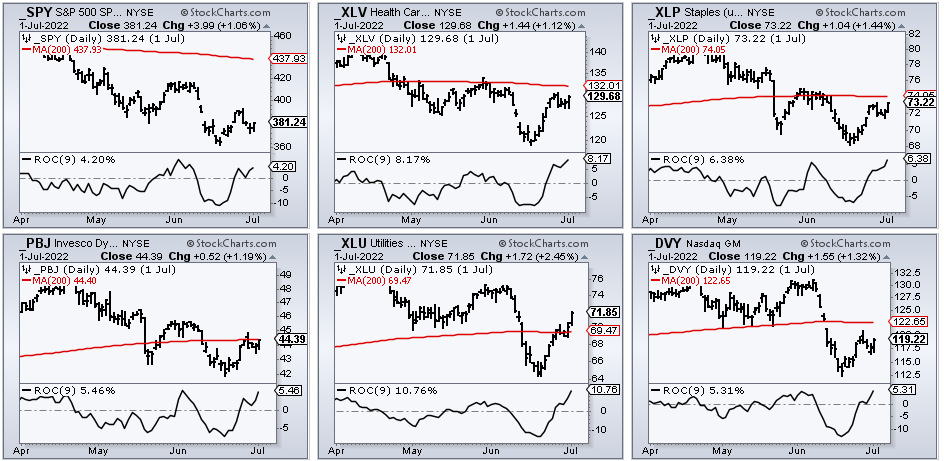
Defensive ETFs Lead Rebound
XLV, XLP, XLU, PBJ, DVY
Stocks bounced in the second half of June, fell back the last three days of the month and then bounced on July 1st. Defensive ETFs show the most chart strength, but they are not really in uptrends because they broke down with the broader market in June. Even though the bounces over the last nine days are strong in percentage terms, they started from lower lows and after breakdowns. The defensive ETFs include the Healthcare SPDR (XLV), Consumer Staples SPDR (XLP), Food & Beverage ETF (PBJ), Utilities SPDR (XLU) and the Select Dividend ETF (DVY). The candlestick charts below show SPY and these ETFs with the 9-day Rate-of-Change in the indicator window. SPY is up 4.2% the last nine trading days and these are up between 5.3% (DVY) and 10.76% (XLU). The candlestick charts below show SPY well below its 200-day SMA (red line). XLU is back above its 200-day, PBJ is right at its 200-day, and XLV and XLP are just below their 200-day lines.
Healthcare and Biotechs Show Relative Strength
XLV, IBB
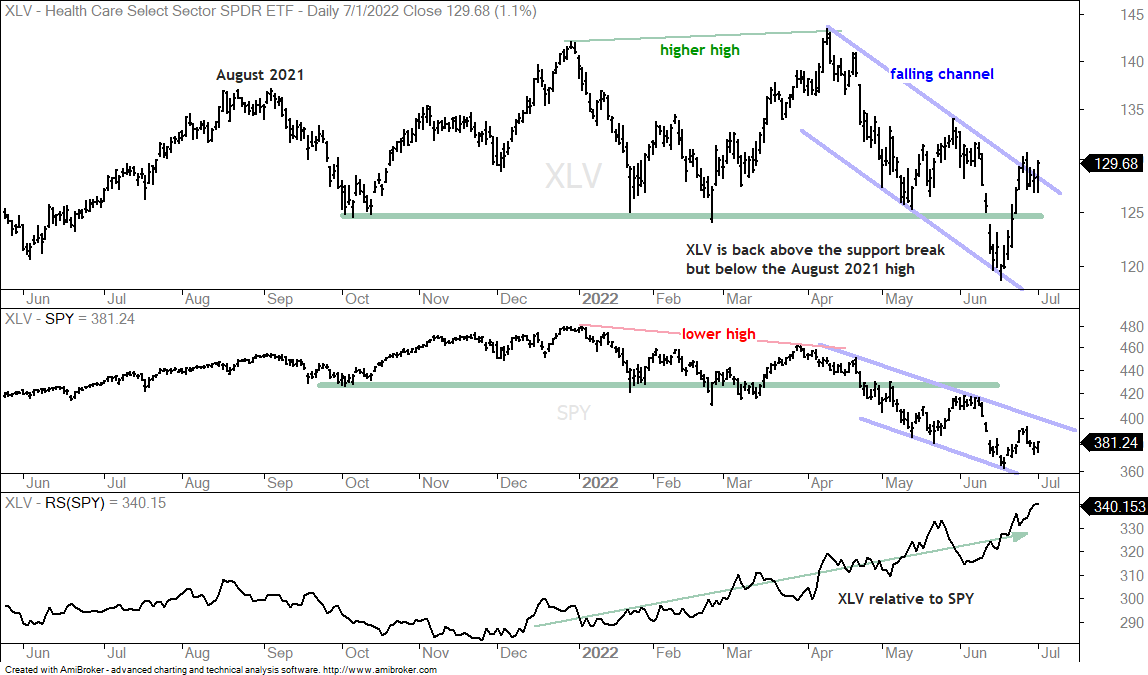
The Healthcare SPDR (XLV) led the rebound off the June low and moved back above its prior support break. The chart below shows XLV in the top window and SPY in the lower window for comparison. XLV was leading and holding up into early April, but then fell with the market from mid April to June (falling channels). With the rebound over the last nine days, XLV is back above its October low and above the upper trendline of the falling channel.
XLV is clearly stronger (or less weak) than SPY over most timeframes and the relative performance line in the bottom window has been trending higher since December. An uptrend in relative performance confirms that XLV is holding up better than SPY (going down less). The price chart reflects the absolute trend in the top window and it is largely flat because XLV has gone nowhere since August 2021. It could be making a turn with the channel breakout though and I will keep it on my radar for a bullish setup in the coming weeks.
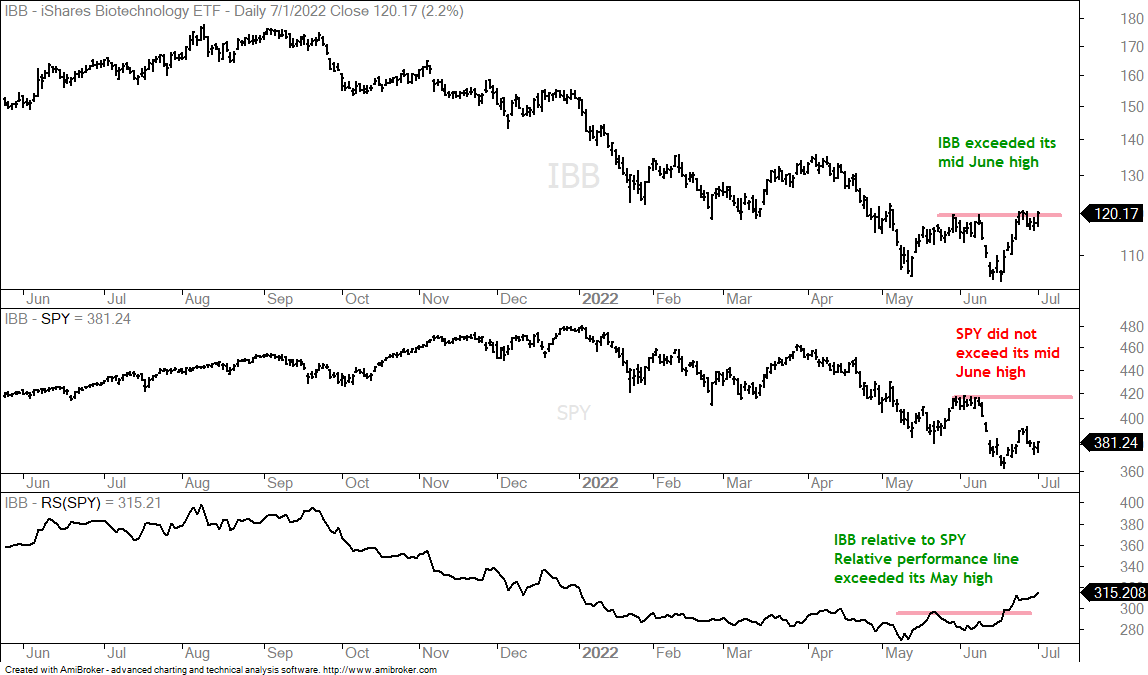
Recent relative and absolute strength in biotechs is helping the Healthcare sector. The next chart shows the Biotech ETF (IBB), SPY and the relative performance line (IBB relative to SPY). IBB underperformed from September to May and is starting to outperform as the relative performance line rose the last eight weeks and broke its mid May high. In the top window, IBB is just above its late May and early June highs, whereas SPY is well below. IBB is showing some promise so I will keep it on the radar for a setup in the coming weeks. No need to rush things in a bear market.
Biotech, Clean Energy and Lithium ETF Updates
XBI, ICLN, LIT
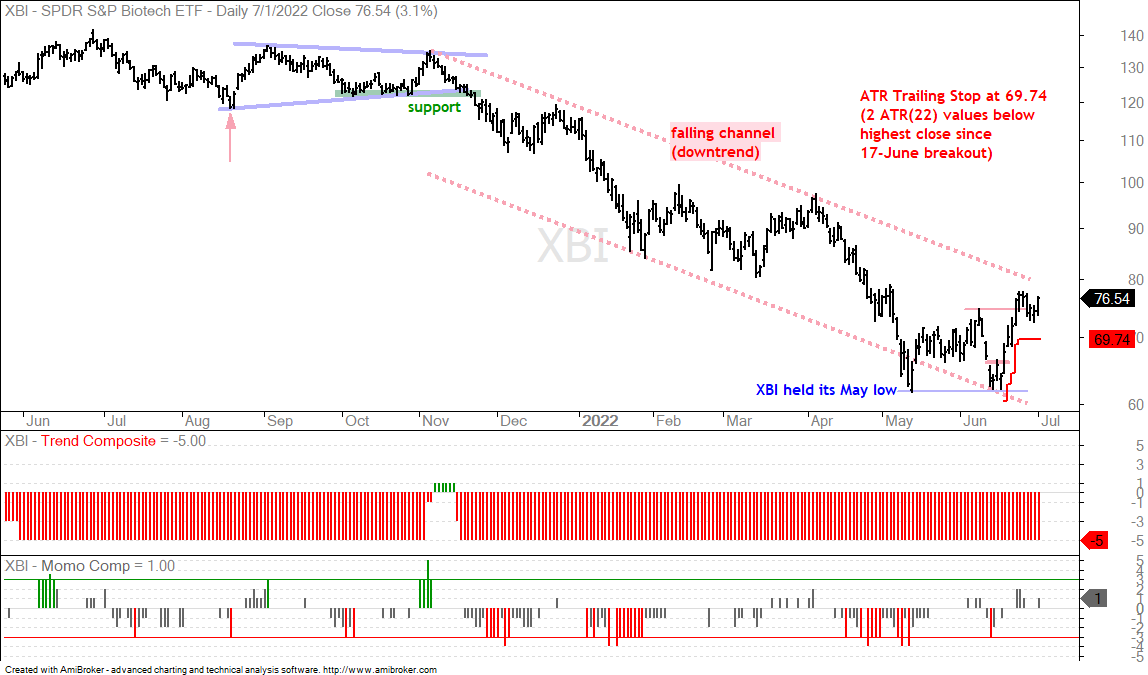
I highlighted the Biotech SPDR (XBI), Global Clean Energy ETF (ICLN) and Lithium Battery Tech ETF (LIT) on June 21st because they were showing short-term relative strength. All three were, and still are, in downtrends. We were, and still are, in a bear market as well. This means risk is above average for all stock-based ETFs. The first chart shows XBI holding its May low in mid June and showing relative strength because SPY broke its May low. XBI broke short-term resistance on June 17th and followed through with a break above the May high. The red line shows the ATR Trailing Stop at 69.74 for reference. The breakout is holding, but XBI is now in no-man’s land because it is short-term extended after a 20+ percent bounce off the lows and still in a downtrend.
You can learn more about the ATR Trailing Stop and exit strategies in this post, which includes a video and charting options for everyone.
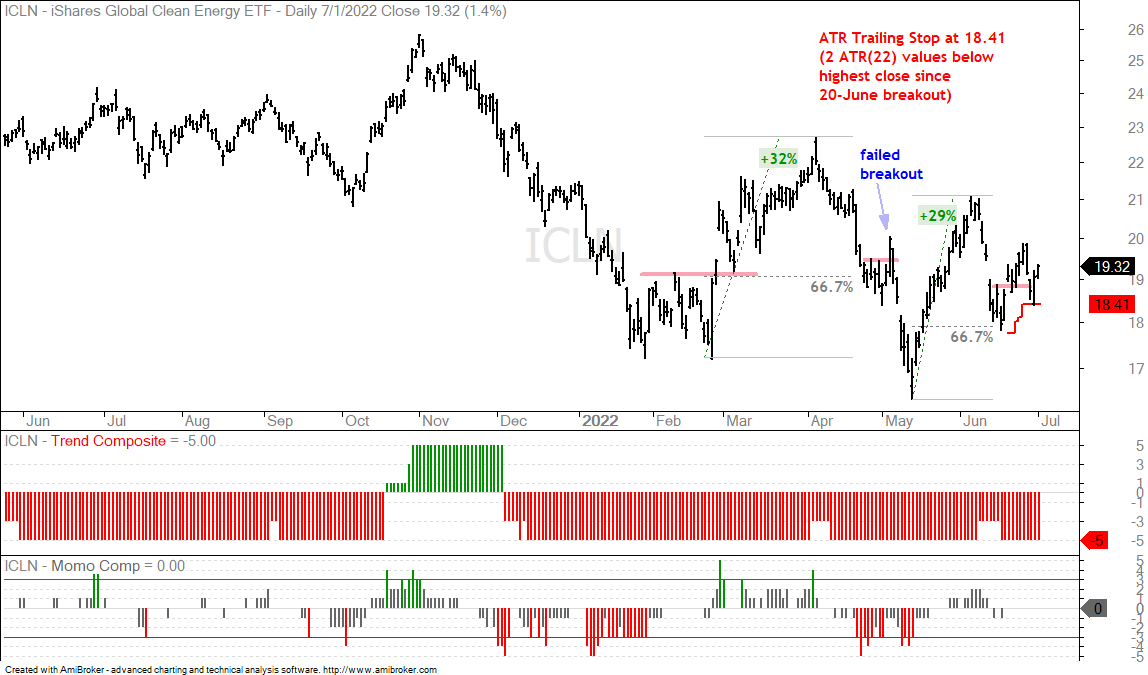
The next chart shows the Global Clean Energy ETF (ICLN) with a higher low from May to June (relative strength). The ETF broke short-term resistance with a pop on June 20th and then turned choppy. Again, risk in the financial markets is above average right now, and so is volatility. The red line shows the ATR Trailing Stop at 18.41 for reference.
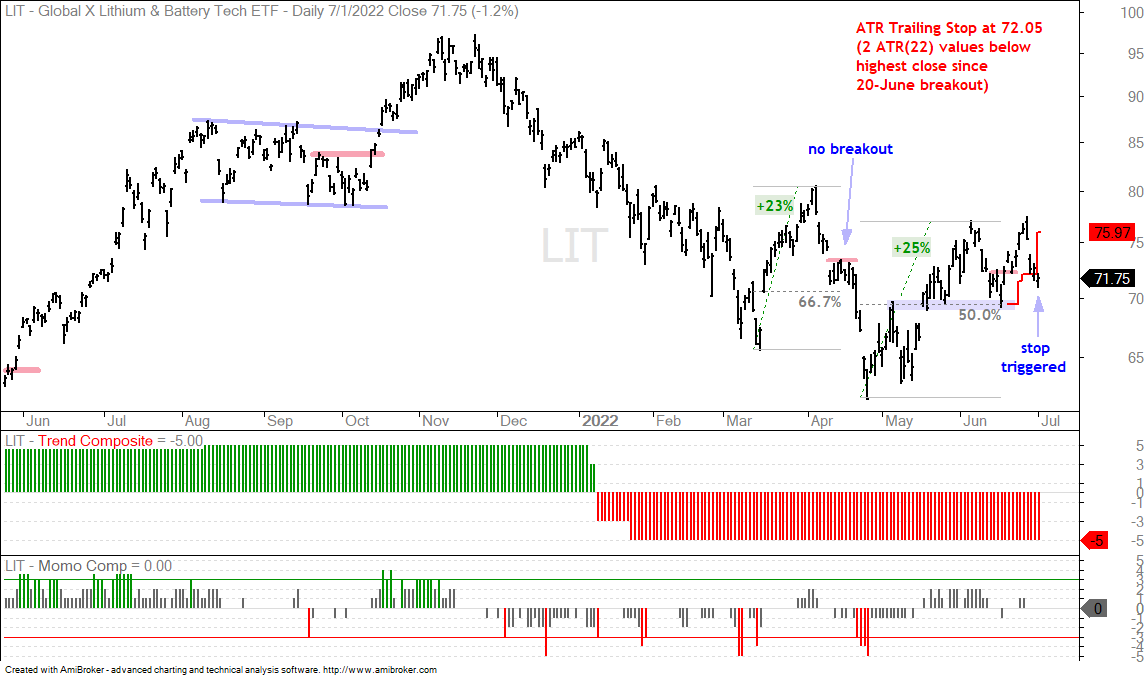
The Lithium Battery Tech ETF (LIT) was not so lucky as it closed below its ATR Trailing Stop on Friday.
")