A Leader in Medical Devices, NVDA Stalls above Breakout, SMH Holds Support, CIBR and 3 Stocks

The next report will be posted on Tuesday morning, December 17th.

Report Headlines

  • Resmed Consolidates after New High
  • Plus the Medical Devices ETF Chart
  • Nvidia Holds above October Breakout Zone
  • Plus the Semiconductor ETF Chart
  • Zscaler Consolidates Near Breakout Zone
  • Plus the Cybersecurity ETF Chart
  • Crowdstrike Holds Tight Rising Channel
  • CyberArk Continues to Lead within the Group

Resmed Consolidates after New High

The first chart shows Resmed (RMD), a company that provides digital and cloud-connected medical devices to monitor health. RMD is in a long-term uptrend as it hit a new high in late October and remains well above the rising 200-day SMA. Overall, the stock consolidated the last three months with a triangle forming since late October. I view this as a consolidation within an uptrend, which makes it a bullish continuation pattern. A breakout at 250 would be bullish. The blue shading marks a support zone in the 230 area. The first indicator window shows the relative performance line in a long-term uptrend. It turned up the last few days and broke the October trendline.

Here is the Medical Devices ETF (IHI) chart for reference.

Nvidia Holds above October Breakout Zone

Nvidia (NVDA) remains in a long-term uptrend and the stock is a long-term leader. Medium-term, the stock is underwhelming because it is still trading near its June-July highs. Nevertheless, I see a triangle breakout in early October and this breakout is holding as the resistance zone turns support in the 130 area. NVDA hit a new high in mid November and then pulled back the last five weeks. The stock is holding just above the breakout zone and I view this as a pullback within a bigger uptrend. A breakout at 146 would be bullish. The first indicator window shows the relative performance line pulling back the last five weeks. A short-term breakout would show a return to relative strength. The bottom window shows %B becoming moderately oversold twice in the last few weeks.

Here is the Semiconductor ETF (SMH) chart for reference.

Zscaler Consolidates Near Breakout Zone

The next chart shows Zscaler (ZS), which is part of the Cybersecurity ETF (CIBR). ZS broke its summer highs with a surge in November and then consolidated near the breakout zone. I view this as a consolidation within an uptrend and a bullish continuation pattern. A breakout at 216 would be bullish and signal a continuation higher. The first indicator window shows the relative performance line rising since October and edging above the 200-day SMA. This means ZS is starting to outperform the S&P 500 EW ETF (RSP). The lower window shows %B dipping into the 0-.25 area to become moderately oversold on Tuesday.

Here is the Cybersecurity ETF (CIBR) chart for reference.

Crowdstrike Holds Tight Rising Channel

The next chart shows Crowdstrike (CRWD), which is also part of the Cybersecurity ETF (CIBR). CRWD plunged in July because a software update caused a massive outage in Windows systems. The stock then bottomed in early August and worked its way higher with a rising channel the last four months. CRWD is almost back to its pre-outage levels. Short-term, a pennant formed as the stock became mildly oversold (%B<.50). This is a short-term bullish setup and a breakout at 370 would target a move to new highs.

CyberArk Continues to Lead within the Group

The Cybersecurity ETF (CIBR) is in a strong uptrend and CyberArk Software (CYBR) is one of the leaders within the group. Like many stocks in the group, CYBR corrected into June, broke out in July and then worked its way higher. Price held above the rising 200-day SMA and there were three pullbacks after the breakout (solid blue lines). Most recently, CYBR surged to a new high in November and then consolidated with a flag into December. This is a short-term bullish continuation pattern and a breakout at 330 would confirm the pattern.

Thanks for tuning in and have a great day!

Video – Breadth, Yield Spreads, SPY, QQQ, IWM, XLV, XLP, CLOU, CIBR, SOXX, SMH, ITB, XHB, LIT, GLD, SLV and Eight Stocks

Today’s video starts with long-term breadth, yield spreads and the major index ETFs to define the broad market environment. We then focus on short-term weakness and the pullbacks in RSP, IWM and MDY. Some tech ETFs are very extended and a key group continues to lag. Housing ETFs are testing support, while gold and silver hold their breakouts. We finish with follow up for eight stocks.

Video – Breadth, Yield Spreads, SPY, QQQ, IWM, XLV, XLP, CLOU, CIBR, SOXX, SMH, ITB, XHB, LIT, GLD, SLV and Eight Stocks Read More »

Breadth and RSP Signal Pullback, Two Housing ETFs Set Up, Extended Tech ETFs, Two Stock Setups

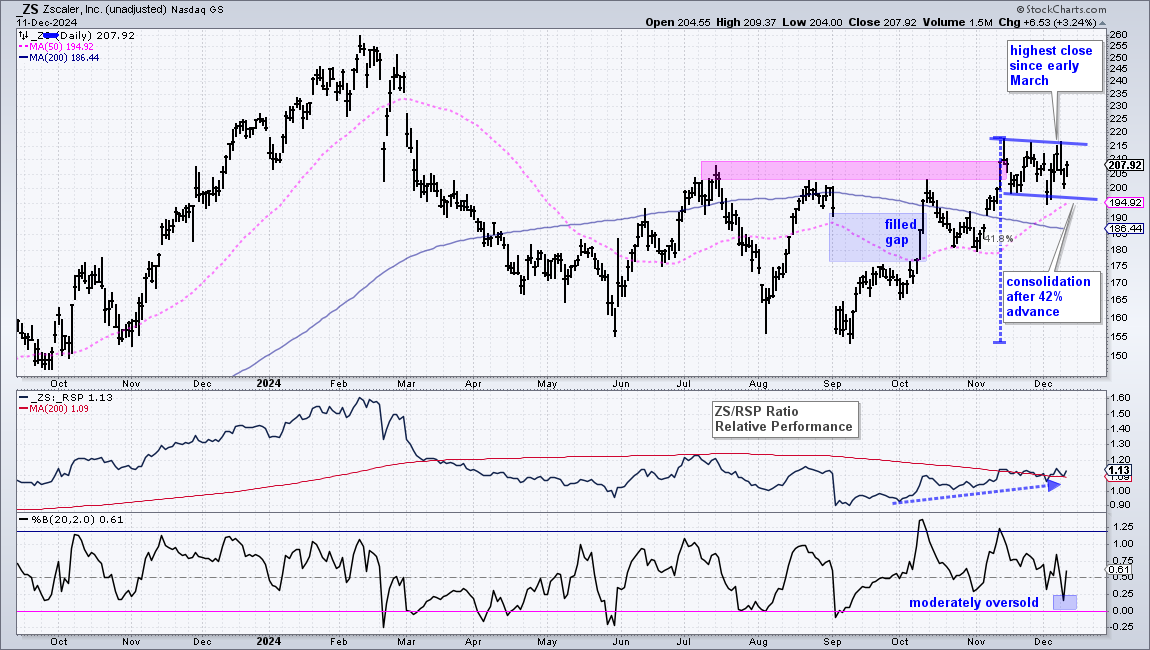
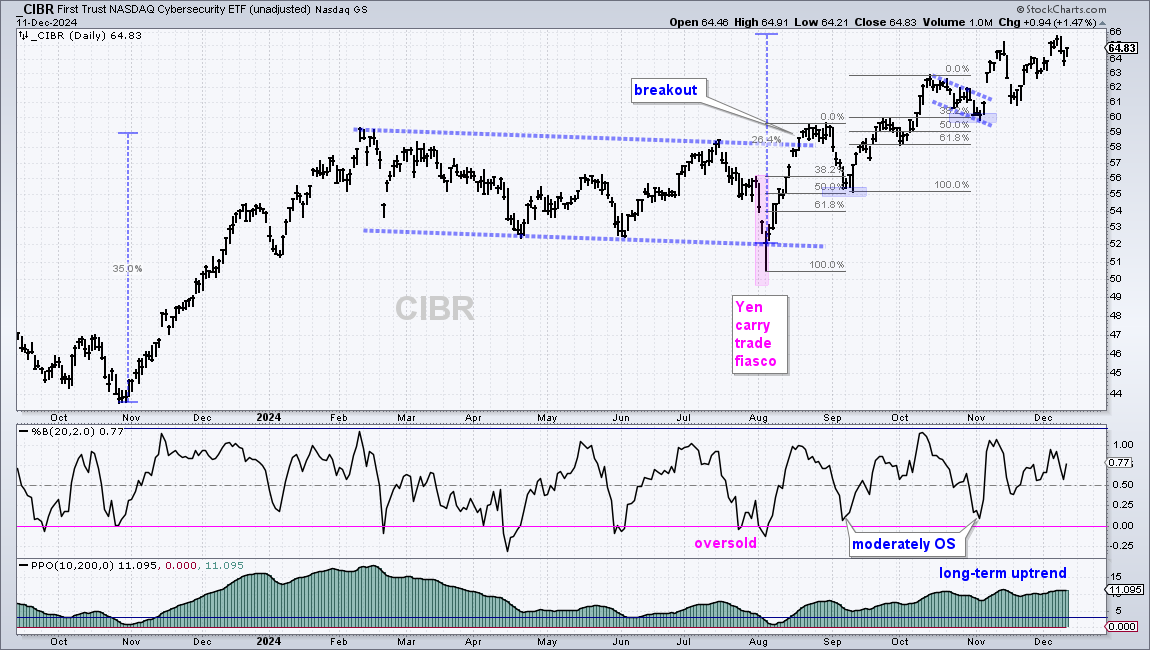
Today’s report starts with the Advance-Decline Percent indicators to measure participation over the last two weeks. We then turn to the S&P 500 EW ETF to define the current pullback, as well as two housing-related ETFs. Some tech stocks are looking extended and we offer detailed analysis of the Cybersecurity ETF (CIBR). We close with bullish setups in an animal healthcare stock and a business software stock.

Breadth and RSP Signal Pullback, Two Housing ETFs Set Up, Extended Tech ETFs, Two Stock Setups Read More »

SPX/NDX Breadth, Yield Spreads, SPY/QQQ Trends, MAG7 Leads and Small-caps Try to Lead

Today’s report will cover the broad market environment. We start with the long-term breadth indicators for the S&P 500 and Nasdaq 100 (%Above 200-day, %Above 150-day, High-Low Percent). Attention then turns to the BBB yield spread and long-term chart analysis for SPY and QQQ. QQQ found its mojo as the MAG7 ETF leads. Mid-caps are lagging, micro-caps are leading the small-caps are mixed.

SPX/NDX Breadth, Yield Spreads, SPY/QQQ Trends, MAG7 Leads and Small-caps Try to Lead Read More »

5 Stocks: Tight Bullish Wedges, A Bullish Setup Zone, A Breakout Leader and One Near a Prior Breakout Level – Plus XLV and XBI (Premium)

Today’s report starts with a defense stock and a fintech stock forming tight wedges. After reviewing the rebounds in the Healthcare and Biotech ETFs, we then focus on two biopharma stocks: one testing a Bullish Setup Zone and the other with a leading breakout. And finally, we feature an under-the-radar tech stock trading near its breakout point from late October.

5 Stocks: Tight Bullish Wedges, A Bullish Setup Zone, A Breakout Leader and One Near a Prior Breakout Level – Plus XLV and XBI (Premium) Read More »

Market/ETF Video – Large-cap Techs Lift S&P 500, Small-caps Weigh on Breadth, Defensive Groups in Downswings (Premium)

The technical picture shows a split market and the fundamental picture is also split. Large-cap techs are leading and the 5-day SMA crossed above the 200-day SMA for the S&P 500. However, small-caps remain weak and the Composite Breadth Model is at -3. The Fed came to

Market/ETF Video – Large-cap Techs Lift S&P 500, Small-caps Weigh on Breadth, Defensive Groups in Downswings (Premium) Read More »

Market/ETF Video – CBM Turns Negative, Yields Spreads Widen, Bonds Rise as Safe Haven Trade, Tech ETFs Show Relative Strength, but… (Premium)

The weight of the evidence is bearish for stocks. The Composite Breadth Model turned negative on Monday, yield spreads widened significantly over the past week and SPY broke wedge support. Risk for stocks and stock-based ETFs is above average right

Market/ETF Video – CBM Turns Negative, Yields Spreads Widen, Bonds Rise as Safe Haven Trade, Tech ETFs Show Relative Strength, but… (Premium) Read More »

Market/ETF Video – SPY Tests Breakout, TLT Firms After Testimony, Tech ETFs in Pullback Mode, Small-caps and Retail Lagging (Premium)

Stocks fell sharply on Tuesday as the market reacted to testimony from Fed Chairman Powell. The Dollar surged and gold fell, but the 20+ Yr Treasury Bond ETF actually advanced on the day. Based on

Market/ETF Video – SPY Tests Breakout, TLT Firms After Testimony, Tech ETFs in Pullback Mode, Small-caps and Retail Lagging (Premium) Read More »

Market/ETF Video – Defining the Uptrend in SPY, TLT Firms as Dollar Gets Extended, Watching February Pullbacks in Several ETFs (Premium)

Stocks corrected throughout February and many ETFs are setting up with pullback patterns taking shape. The S&P 500 SPDR (SPY) is testing its 200-day SMA after a pullback the last four weeks. QQQ broke

Market/ETF Video – Defining the Uptrend in SPY, TLT Firms as Dollar Gets Extended, Watching February Pullbacks in Several ETFs (Premium) Read More »

Market/ETF Video – Evidence is Bullish, but SPY Reverses Upswing within Wedge, Big Sectors and Tech ETFs Follow Suit (Premium)

The weight of the evidence is technically bullish for the stock market, but the bears fired a shot across the bow as SPY and other key ETFs broke short-term support levels. Many ETFs were consolidating with falling flags, falling wedges or

Market/ETF Video – Evidence is Bullish, but SPY Reverses Upswing within Wedge, Big Sectors and Tech ETFs Follow Suit (Premium) Read More »

Market/ETF Video – Big Surge is Bullish, But Many ETFs are Overbought, Defensive ETFs with Bullish Setups, 10-yr Yield Breaks Out (Premium)

The Composite Breadth Model turned positive on January 31st, the percentage of stocks above the 200-day SMA is strong across the board and yields spreads are trending lower (narrowing). This makes the Market Regime bullish for stocks. The only caveat

Market/ETF Video – Big Surge is Bullish, But Many ETFs are Overbought, Defensive ETFs with Bullish Setups, 10-yr Yield Breaks Out (Premium) Read More »

Market/ETF Video – CBM Moves to -1, Big Falling Wedge vs Small Rising Wedge, Defensive ETFs Correct in 2023 (Premium)

The Composite Breadth Model improved, but remains negative and the market is at a critical level. A critical level means we are at a moment of truth or a make or break point. One more push higher would turn the CBM positive and trigger a big wedge

Market/ETF Video – CBM Moves to -1, Big Falling Wedge vs Small Rising Wedge, Defensive ETFs Correct in 2023 (Premium) Read More »

Market/ETF Report – Broad Selling, SPY Reverses Near 200-day, XLK with Outside Day at Key Retracement (Premium)

This is a short update covering the S&P 500 SPDR, a bearish breadth signal and two ETFs. Stocks were hit pretty hard on Wednesday with all sectors moving lower. In an interesting twist, the low volatility sectors, Utilities (XLU) and Consumer Staples

Market/ETF Report – Broad Selling, SPY Reverses Near 200-day, XLK with Outside Day at Key Retracement (Premium) Read More »

Market/ETF Video – 5-day Nears 200-day with Big Falling Wedge, %Above 200-day Indicators Show Strength, Gold Goes Parabolic (Premium)

The Composite Breadth Model remains negative, but the market is quite split overall. The 5-day SMA for the S&P 500 is very close to crossing above the 200-day SMA, the percentage of stocks above the 200-day SMA is strong and yield spreads are narrowing. There was also a move

Market/ETF Video – 5-day Nears 200-day with Big Falling Wedge, %Above 200-day Indicators Show Strength, Gold Goes Parabolic (Premium) Read More »

Market/ETF Video – Bears are Back, Bonds Follow Stocks, Defensive ETFs Get Hit, Gold Battles 200-day (Premium)

The Composite Breadth Model turned negative on Monday and the Market Regime is back to bearish. 2022 was year of the whipsaw for the CBM, but whipsaw periods are normal for trend following models and part of the overall process. AAA spreads

Market/ETF Video – Bears are Back, Bonds Follow Stocks, Defensive ETFs Get Hit, Gold Battles 200-day (Premium) Read More »

Scroll to Top