
")

The technical picture shows a split market and the fundamental picture is also split. Large-cap techs are leading and the 5-day SMA crossed above the 200-day SMA for the S&P 500. However, small-caps remain weak and the Composite Breadth Model is at -3. The Fed came to
The weight of the evidence is bearish for stocks. The Composite Breadth Model turned negative on Monday, yield spreads widened significantly over the past week and SPY broke wedge support. Risk for stocks and stock-based ETFs is above average right
Stocks fell sharply on Tuesday as the market reacted to testimony from Fed Chairman Powell. The Dollar surged and gold fell, but the 20+ Yr Treasury Bond ETF actually advanced on the day. Based on
Stocks corrected throughout February and many ETFs are setting up with pullback patterns taking shape. The S&P 500 SPDR (SPY) is testing its 200-day SMA after a pullback the last four weeks. QQQ broke
The weight of the evidence is technically bullish for the stock market, but the bears fired a shot across the bow as SPY and other key ETFs broke short-term support levels. Many ETFs were consolidating with falling flags, falling wedges or
The weight of the evidence is bullish for stocks. The CBM is positive, SPY broke out of a big falling wedge and QQQ broke double bottom resistance. Short-term, stocks surged in 2023 with the
The Composite Breadth Model turned positive on January 31st, the percentage of stocks above the 200-day SMA is strong across the board and yields spreads are trending lower (narrowing). This makes the Market Regime bullish for stocks. The only caveat
The Composite Breadth Model turned positive and hit its highest level since January 2022. This means the weight of the evidence turned bullish for stocks. Narrowing yield spreads show increasing confidence
The Composite Breadth Model improved, but remains negative and the market is at a critical level. A critical level means we are at a moment of truth or a make or break point. One more push higher would turn the CBM positive and trigger a big wedge
This is a short update covering the S&P 500 SPDR, a bearish breadth signal and two ETFs. Stocks were hit pretty hard on Wednesday with all sectors moving lower. In an interesting twist, the low volatility sectors, Utilities (XLU) and Consumer Staples
The Composite Breadth Model remains negative, but the market is quite split overall. The 5-day SMA for the S&P 500 is very close to crossing above the 200-day SMA, the percentage of stocks above the 200-day SMA is strong and yield spreads are narrowing. There was also a move
The Composite Breadth Model remains negative, but the breadth indicators show a split among stocks with roughly half above their 200-day SMAs and half below. The Fed balance
The Composite Breadth Model turned negative on December 19th and remains negative as we start the new year. There are some pockets of strength within the S&P 500, but these are overshadowed by relative weakness in large-caps.
The Composite Breadth Model turned negative on Monday and the Market Regime is back to bearish. 2022 was year of the whipsaw for the CBM, but whipsaw periods are normal for trend following models and part of the overall process. AAA spreads
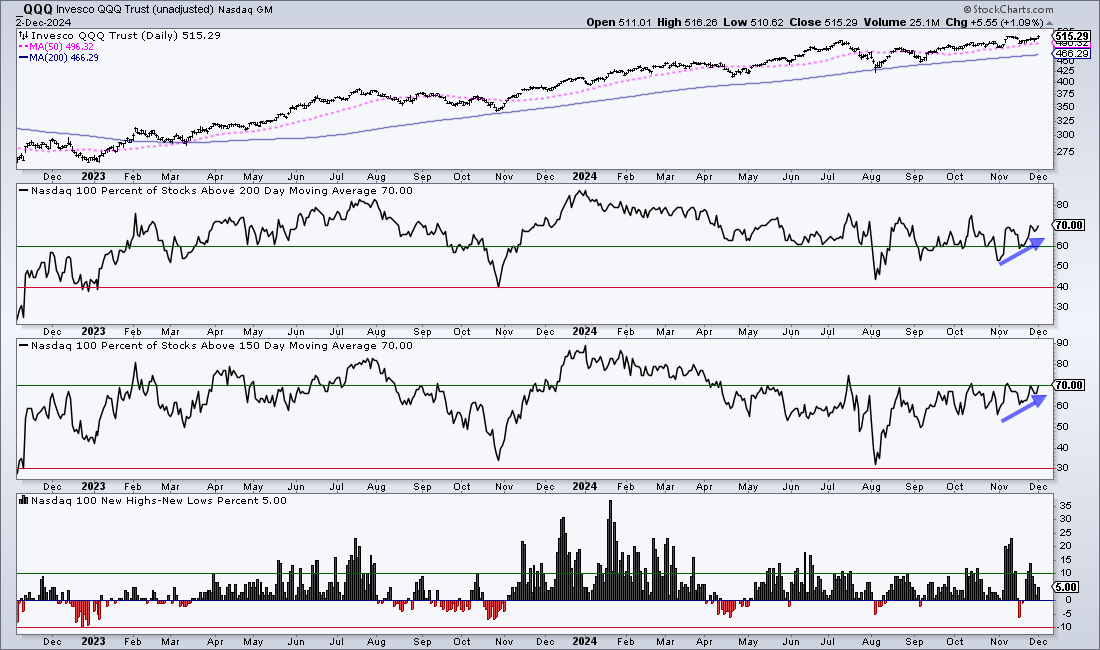
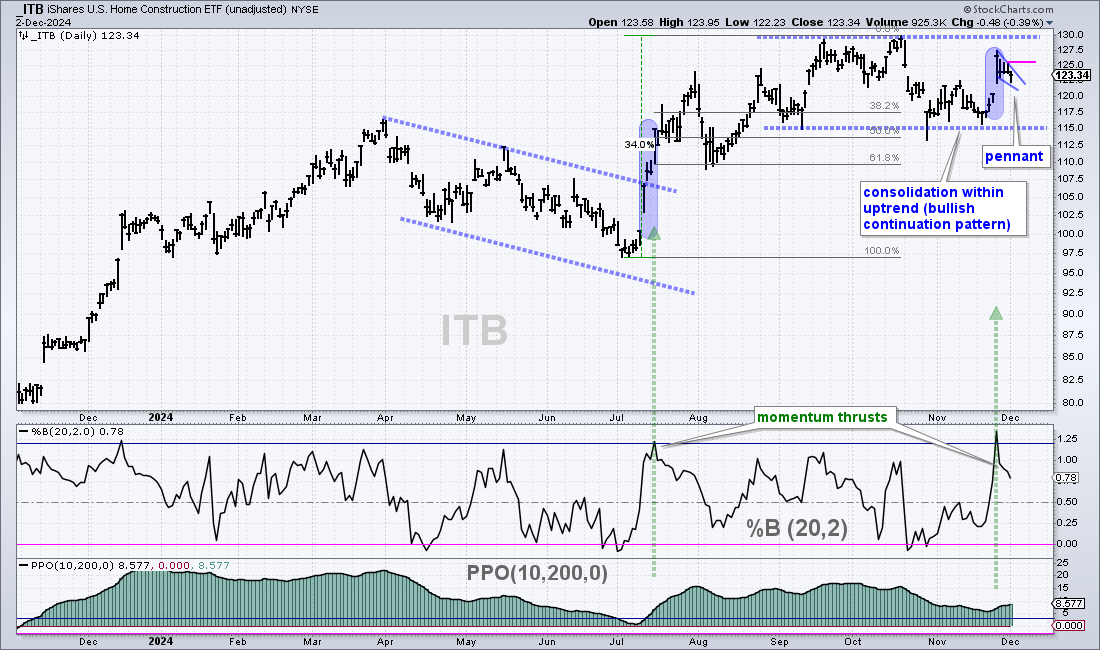
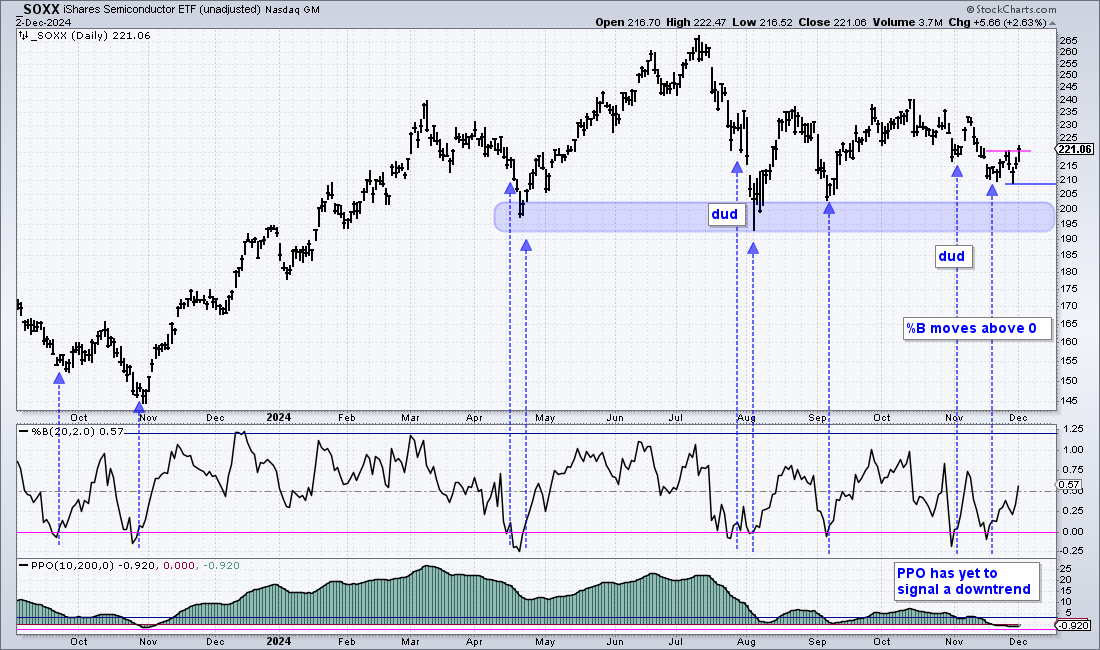
Today’s report will start with a stock market overview with analysis of the big three (SPY, QQQ, IWM) and three key industry group ETFs (SOXX, XRT, ITB). Housing is holding up, but the other five broke down and the weight
Today’s update starts with the big three (SPY, QQQ, IWM) because they broke down over the last few days and their breakdowns signal a continuation of the long-term downtrends. Moreover, the Composite Breadth Model turned
The weight of the evidence favors the bulls because the Composite Breadth Model is positive, but the stock market is as divided as ever. Today’s report will show three different ETF groups: the lead group holding support, the weak group
Despite some volatility around the CPI report, there is no real change in the market situation. The Market Regime for stocks is positive because the Composite Breadth Model is at +1 and yield spreads are narrowing. The intermarket relationships since
The weight of the short-term evidence remains bullish for stocks. Even though SPX %Above 20-day SMA plunged below 60% to trigger bearish, SPY has yet to break support and the key intermarket relationships
The Market Regime for stocks is positive because the Composite Breadth Model is at +1 and yield spreads are narrowing. The short-term uptrend in SPY, key intermarket relationships and some economically important ETFs hold the key going forward