Chart Trader is moving back to publishing on Tuesday and Thursday before the open. The focus will remain on stock and ETF trading setups for both swing and position traders. Instead of one big report and video, the idea is to break up the reports into smaller bite-sized pieces.
I always monitor the long-term trend for the major index ETFs (SPY, QQQ), long-term breadth indicators and yield spreads, but their status does not change very often. For example, we have been in a bull market for at least a year. I will continue to provide updates on these, but not as often.
Market Overview
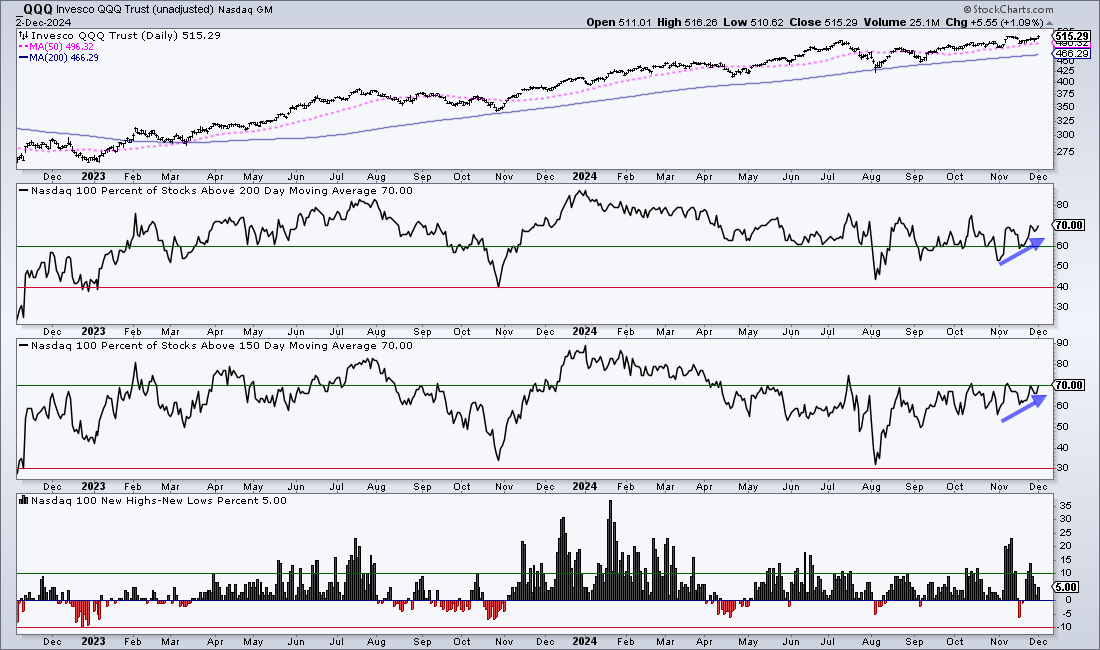
The bull market remains intact. SPY and QQQ hit new highs on Monday. Long-term breadth is bullish with 70% or more of S&P 500 and Nasdaq 100 stocks above their 200 and 150 day SMAs. Also note that Nasdaq 100 breadth improved over the last six weeks. Yield spreads remain at narrow levels and show no stress in the corporate credit markets.
10-yr Treasury Yield Remains with Reversal
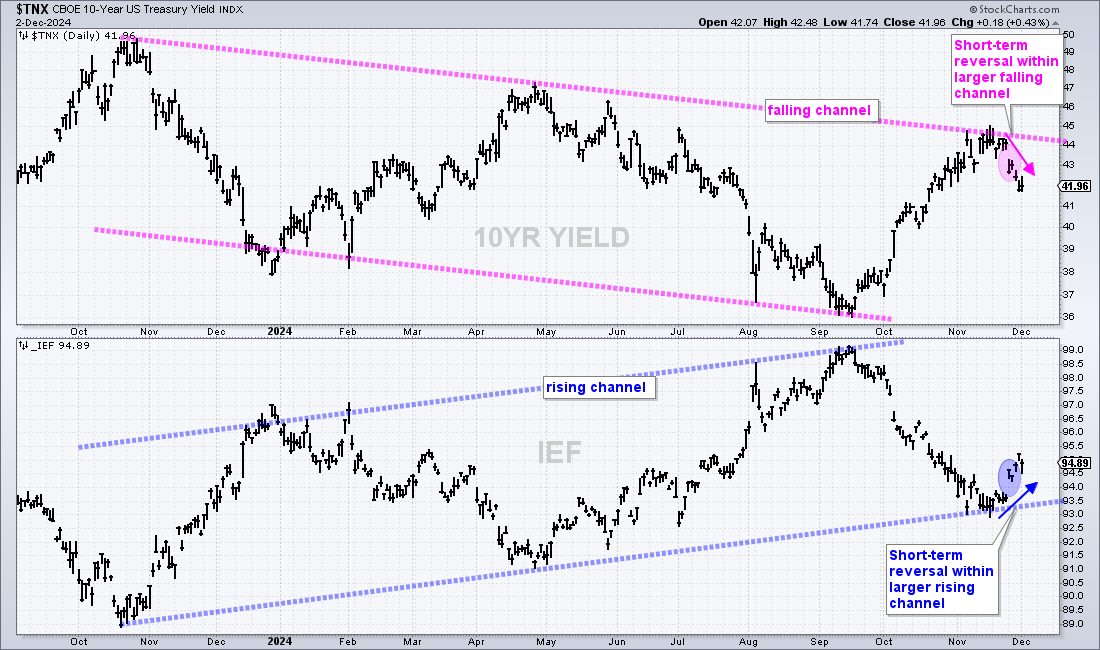
I covered the long-term falling channel and short-term reversal in the 10-yr Treasury Yield last week. This key interest rate benchmark fell sharply on Monday, November 25th (pink oval), and continued lower the last four days. This decline reversed the short-term upswing from mid September to mid November. This current swing (immediate trend) is down and this is within a larger falling channel (downtrend). Based on these trends, the outlook is for lower yields. A surge above 44 (4.4%) would call for a re-evaluation.
The bottom window shows the 7-10 Yr Treasury Bond ETF (IEF) as a mirror image. There is a long-term rising channel (uptrend) and IEF reversed the downswing with a surge on November 25th (blue oval). This argues for higher prices in IEF.
Home Construction ETF Forms Short-term Pennant
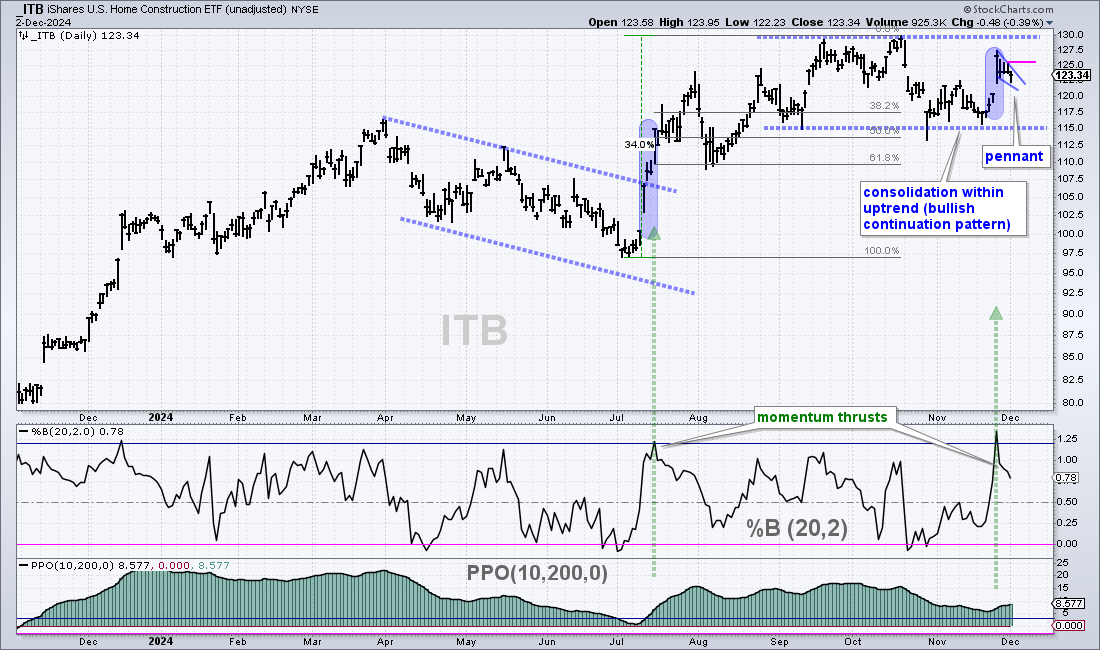
I covered the Home Construction ETF (ITB) and several home builders last Tuesday as they triggered short-term momentum thrusts. ITB became short-term overbought as %B surged above 1.2% (green arrow) and then consolidated the last four days. Overall, I see a 34% advance and a sharp decline in October that retraced 50%. ITB firmed and a consolidation pattern formed over the last three months (blue dashed lines). I view this as a bullish continuation pattern and a breakout at 130 would confirm the pattern. Using the measured move technique, a consolidation breakout would target a move to the 154 area (115 + 34%).
Within this pattern, ITB surged and formed a pennant the last four days. This is a short-term bullish continuation pattern and a breakout at 125.5 (pink line) would signal a continuation of last week’s surge. This would also increase the chances for a bigger breakout at 130. A pennant break out would target a move to the 133 area. Should ITB trigger a pennant breakout, a close below 122 would negate the signal.
Semis Pop Despite Semiconductor Curbs
The Semiconductor ETF (SOXX) surged 2.63%, despite new curbs on US semiconductor exports to China. Note that Reuters reported the following: “US targets China’s chip industry with new restrictions”. Perhaps the restrictions were not as strict as expected or perhaps this news is already priced in. SOXX, SMH and XSD are lagging the broader market overall. QQQ hit a new high this week and the Technology SPDR (XLK) is very close to a new high. SOXX, in contrast, is well below its July and October highs. XLK is up 4.5% since October and SOXX is down 4% since October.
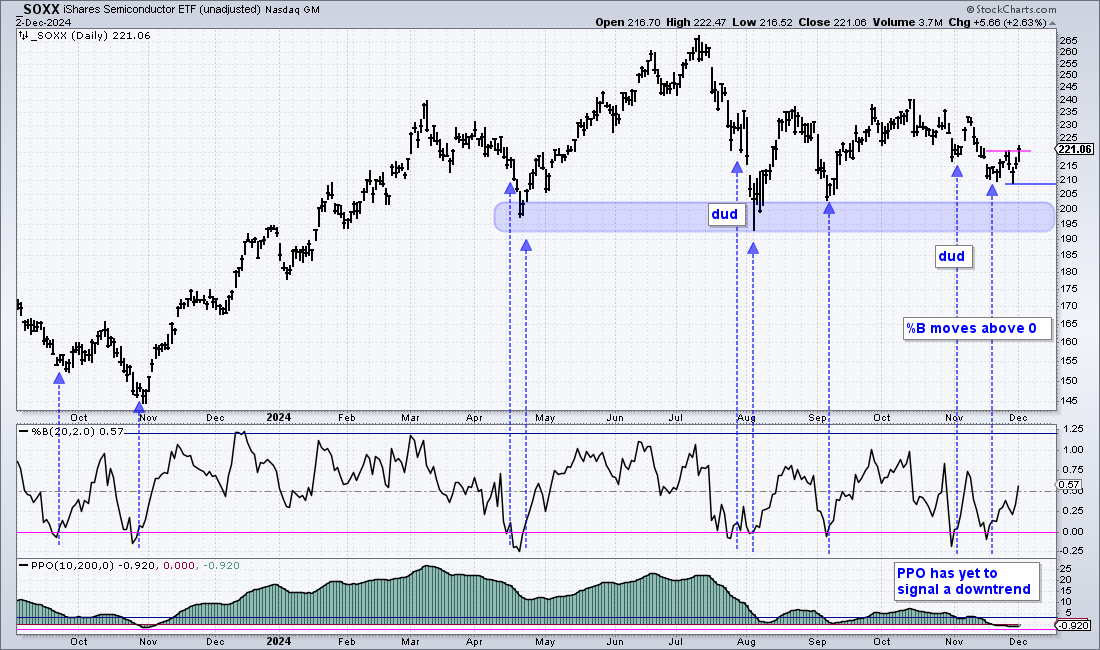
The next chart shows SOXX without pattern annotations. Instead, we have the PPO(10,200,0) in the bottom window and %B in the middle window. The PPO signals an uptrend when it exceeds +3% and a downtrend when it exceeds -3%. For SOXX, the PPO turned bullish with a move above +3% in January 2023. It dipped into negative territory in late October 2023 and late November 2024, but has yet to signal a downtrend.
With an uptrend in force, we next look for oversold conditions within this uptrend. Chartists can also combine these with support levels and patterns. The blue dashed lines show when %B moves above 0, which means it became oversold and then turned up. This simple strategy picked bottoms in late April, early August and early September. The upturns in late July and early November were duds. Most recently, SOXX became oversold and %B crossed above on November 19th. SOXX also broke its late November high with a surge the last two days. This looks like an upturn and I would re-evaluate on a close below 208.
XLK Forms Cup-with-handle
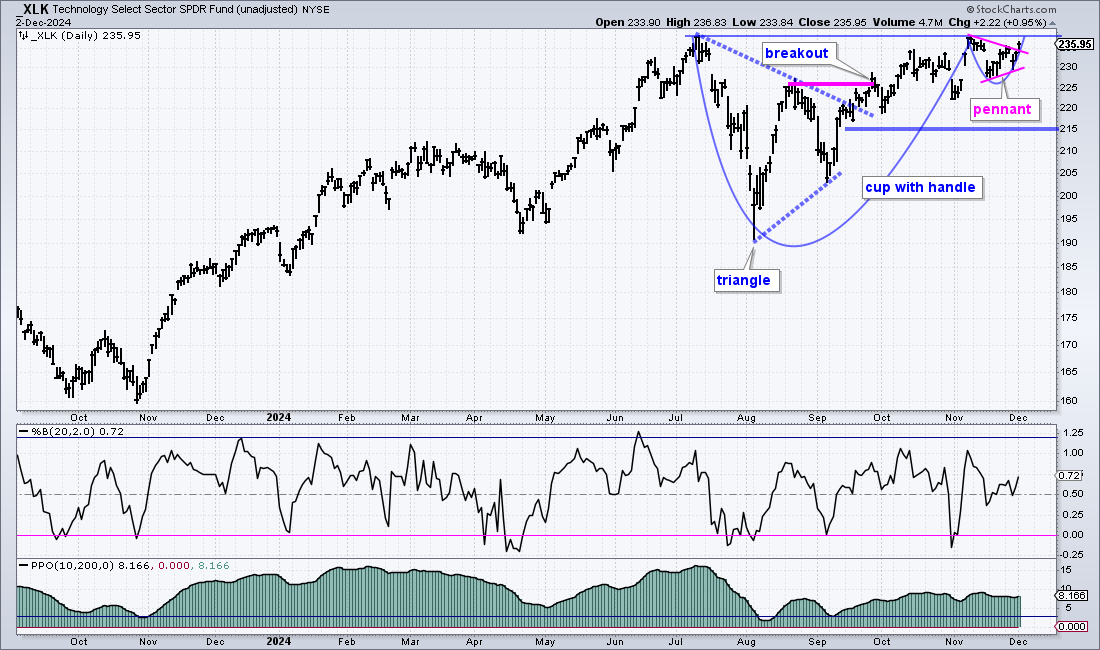
The next chart shows the Technology SPDR (XLK) coming to life with a pennant breakout and a cup-with-handle forming. Note that these patterns follow the triangle breakout in the second half of September. This pattern and breakout were featured in reports at the time (QQQ, XLK, MAGS). The cup-with-handle is a long-term bullish continuation pattern and a breakout above the July-October highs would confirm the pattern. Pennants are short-term continuation patterns and Monday’s breakout signals a continuation higher. Overall, I think the triangle breakout is the most important pattern in play, and it is bullish. Key support is set at 215.
Lithium ETF Continues to Consolidate
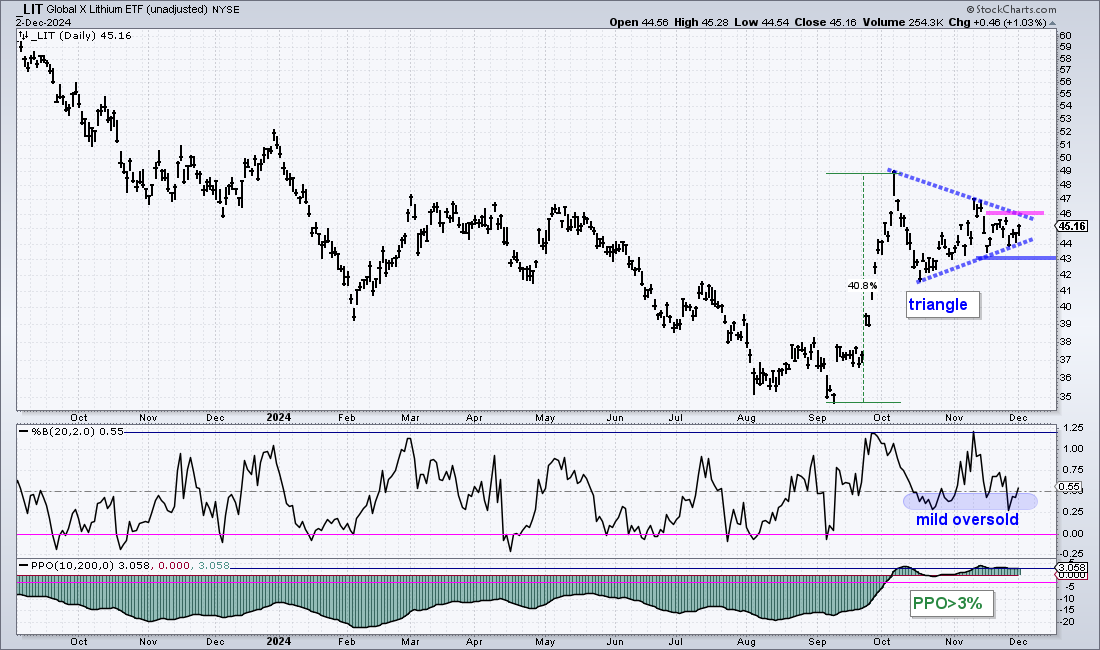
The Lithium Battery Tech ETF (LIT) continues to setup with a bullish triangle taking shape. The long-term trend turned up as the PPO exceeded +3% in early October and the ETF surged some 40%. It then consolidated with a triangle, which is a continuation pattern. LIT was quite overbought and this consolidation worked off these overbought conditions. The range is narrowing and a breakout at 46 would be bullish. I would then target a move to the low 50s and set a re-evaluation level at 43.
The middle window shows %B dipping into the .25-.50 area in late October and late November. This zone represents a mild oversold condition or shallow pullback. For reference, the zone from 0 to .25 represents a moderately oversold condition and values below 0 signal an oversold condition.
Silver Hits Bullish Setup Zone
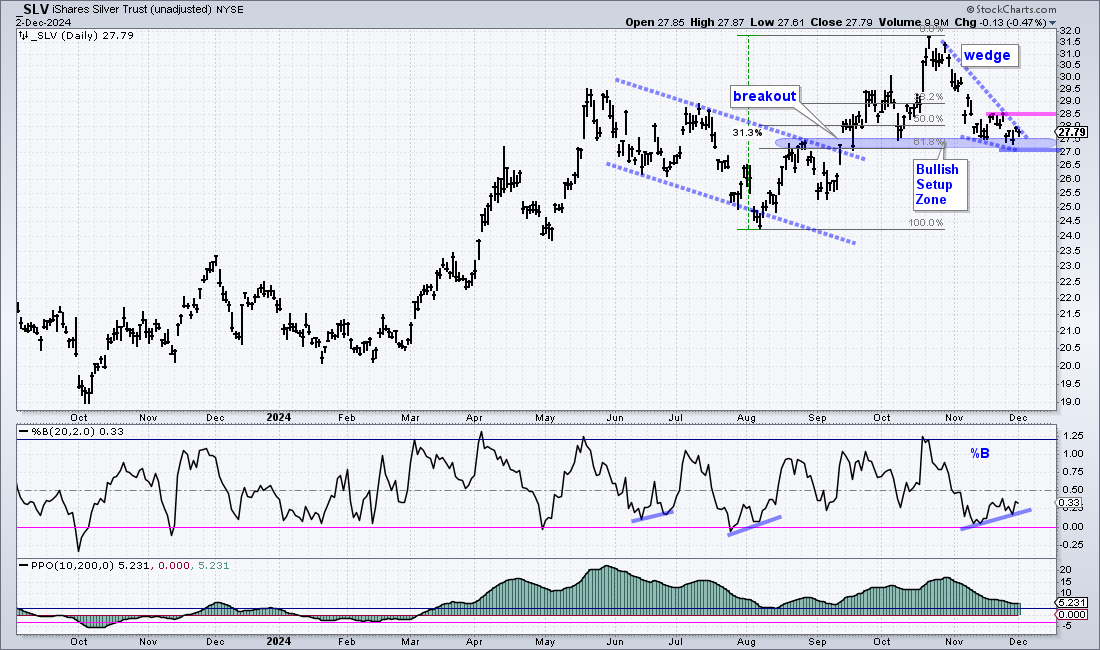
The next chart shows the Silver ETF (SLV) falling back to the prior breakout area and retracing around 61.8% of the prior 31.3% advance. This combination marks a classic bullish setup zone that could give way to a reversal. A falling wedge formed with short-term resistance marked at 28.50. A breakout here would be bullish and reverse the short-term downswing. I would then expect a move to the mid 30s. Should SLV break out, I would mark the initial re-evaluation level at 27.
The middle window shows %B becoming moderately oversold with a dip below .25 in mid November. A small bullish divergence formed the last three weeks as %B formed a higher low and SLV formed a lower low. Downside momentum is waning and a break above .50 would be positive for %B.
China Large-Cap ETF Also Hits Bullish Setup Zone
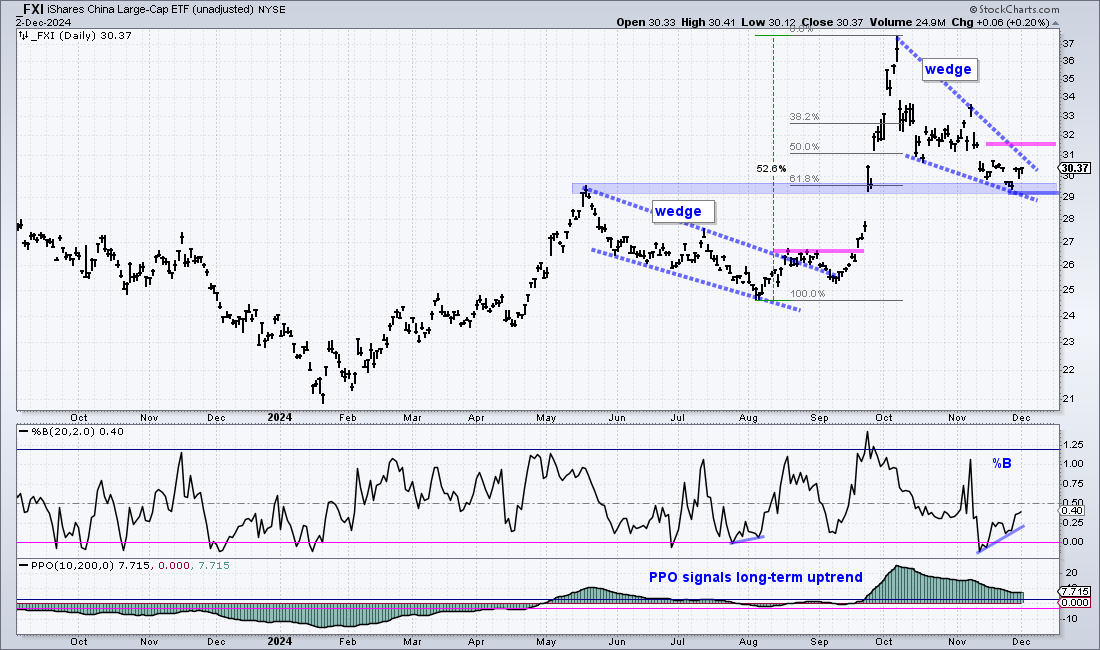
The next chart shows the China Large-Cap ETF (FXI) with similar characteristics. FXI surged 52.6% into early October and then retraced 61.8% with a falling wedge that returned to he May high. The blue shading marks the Bullish Setup Zone around 29. I am marking falling wedge resistance at 31.5 and a breakout here would be bullish. I would then mark re-evaluation support at 29.
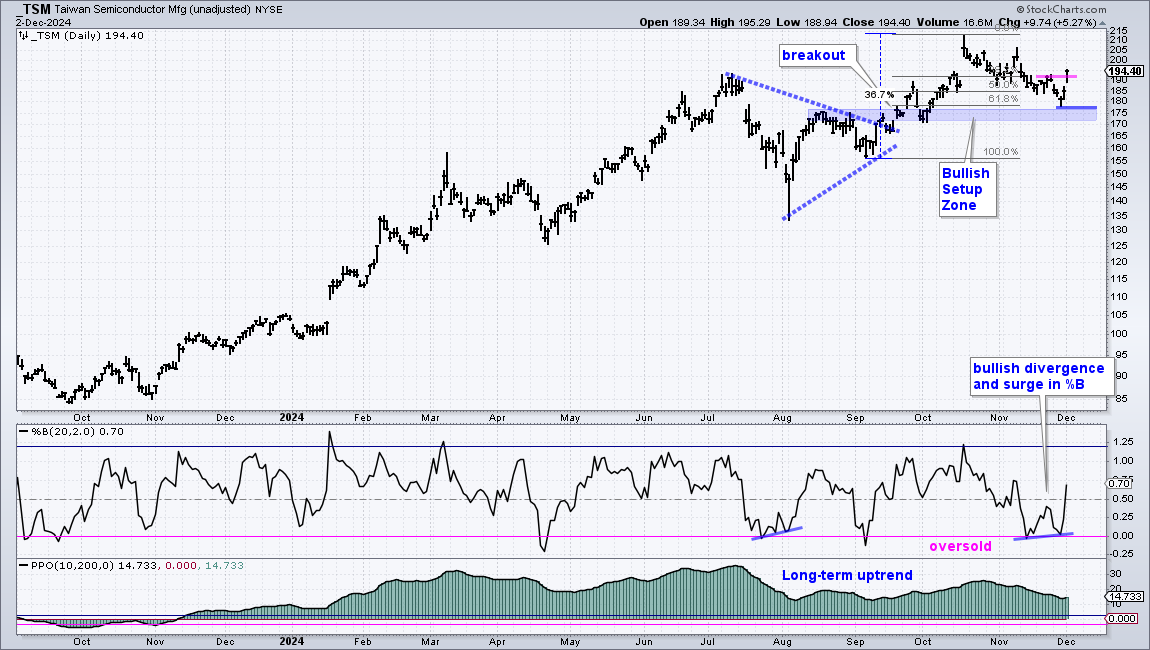
The next chart shows Taiwan Semiconductor (TSM) with a 38.7% advance to new highs in mid October. TSM then retraced 61.8% of this advance with a decline back to the breakout zone. There is a falling channel since October, but I am simply going to mark short-term resistance with the late November high. TSM broke this level with a surge the last two days. This breakout reverses the short-term downswing and signals a continuation of the bigger uptrend. I would mark re-evaluation support at 178.
META Surges within Channel Correction
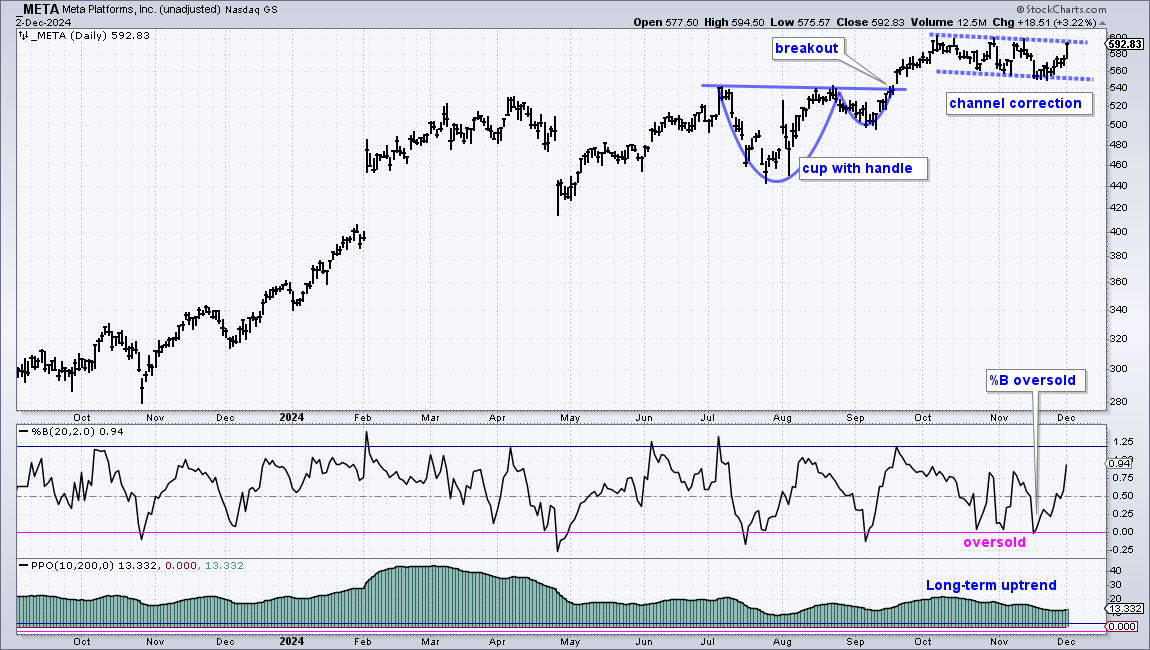
The next chart shows META with a cup-with-handle in the summer and a breakout in mid September. The stock hit new highs into early October and then corrected with a falling channel as Mark Zuckerberg went to Mar-a-Lago. Not sure what became of that meeting, but the stock surged 3.22% on Monday and is on the verge of breaking out. A breakout would signal a continuation higher and target a move the 670 area or even higher. I would mark re-evaluation support at 550.
Microsoft Rebounds after Earnings Gap
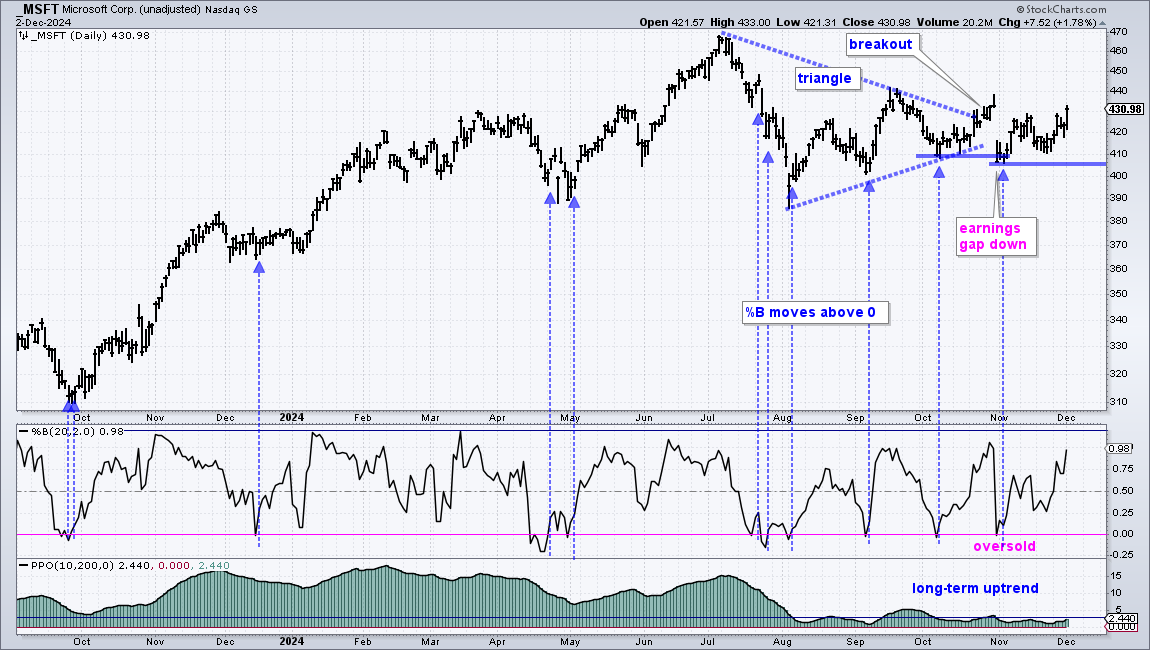
The Microsoft (MSFT) chart looks similar to SOXX. The stock peaked in July and remains well below the July high. It is underperforming the broader market and QQQ, but remains in a long-term uptrend (according to the PPO). Overall, a triangle formed into October and the stock broke out in late October. This breakout did not hold as MSFT gapped down after earnings and broke the October low. I am impressed because the stock quickly rebounded and the bounce again the past week. The gap is filling as buying pressure increases. I think the triangle breakout is back in play with the October-November lows marking support at 405.
The middle window shows %B with the blue dashed lines marking moves above 0. This means %B became oversold and then turned up. These signals called a few good bottoms, but failed during the July decline. Most recently, %B became oversold with the earnings gap and this marked the most recent low. Even though it can be difficult to buy after a gap and support break, short-term ugliness can present traders with an opportunity.
")