The next report will be posted on Tuesday morning, December 10th.
Report Headlines
S&P 500 Breadth Remains Strong
Nasdaq 100 Breadth Improves
SPY Hits Another New High
QQQ Gets its Mojo Back
Yield Spreads Remain Narrow
MAG7 is NOT the Lag7
Small-caps Trying to Lead the Market
Flags and Pennants for MDY, IJR, IWM and IWC
Market Overview
Today’s report sets the stage for the broad market environment. We are in a bull market heading into yearend. S&P 500 breadth is stronger than Nasdaq 100 breadth, but breadth indicators for both support a bull market. SPY and QQQ are leading the market with new highs least week. I do not see any setups right now. They are simply in ongoing uptrends. Elsewhere, the MAG7 ETF is leading and small-cap performance is mixed.
S&P 500 Breadth Remains Strong
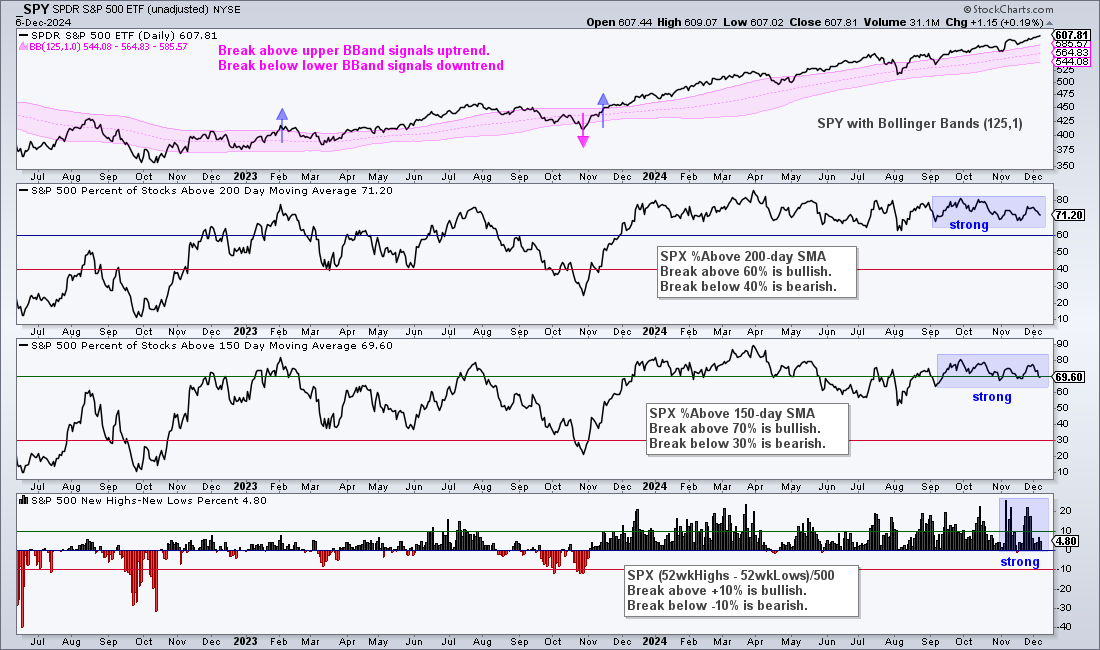
There is no change in the S&P 500 breadth picture. The top window shows SPY in an uptrend since breaking the upper Bollinger Band in mid November 2023. 71.2% of S&P 500 stocks are above their 200-day SMAs and 69.2% are above their 150-day SMAs. These strong numbers indicate that the vast majority of S&P 500 stocks are in uptrends.
The bottom window shows High-Low Percent exceeding 20% a few times in November. This means over 20% of S&P 500 stocks hit new highs at some point last month. Overall, these numbers support a bull market.
Nasdaq 100 Breadth Improves
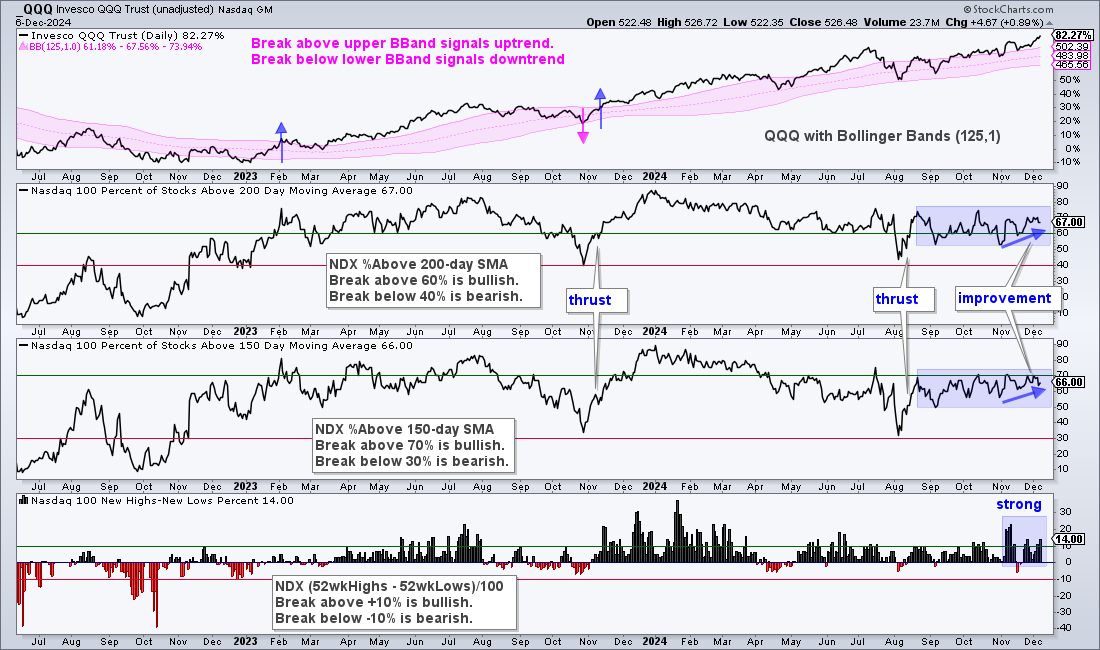
Nasdaq 100 breadth is not as strong as S&P 500 breadth, but the numbers have been improving since early November. The percentage of stocks above their 200-day SMAs increased from 53% to 67%. Overall, the percentage stocks above their 200 and 150 day SMAs has held above 50% since the mid August thrust. This means the cup is clearly half full (bullish) for the Nasdaq 100.
The bottom window shows High-Low Percent surging above +20% in early November and hitting 14% on Friday. There were no new lows on Friday so this means 14 of the 100 components hit new highs. Again, the overall numbers support a bull market for the Nasdaq 100.
SPY Hits Another New High
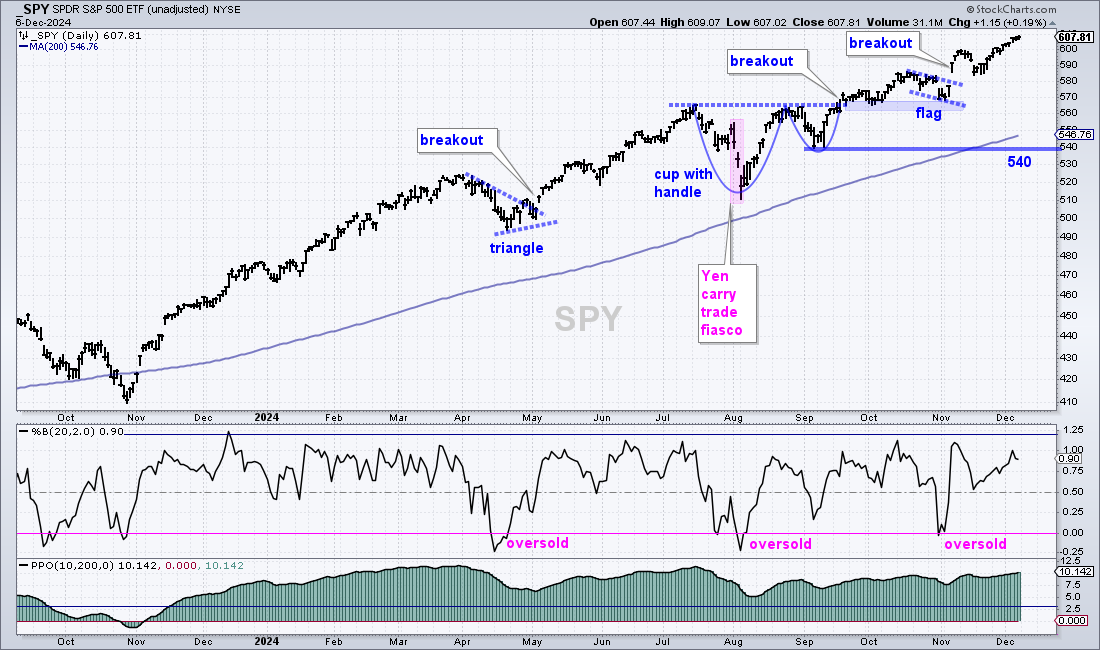
SPY is in a ongoing uptrend with another new high this week. An “ongoing” uptrend means there is no setup, such as a tradable pattern or oversold condition. SPY is simply in an uptrend. I am going to mark long-term support at 540. Note that my bull/bear stance depends on three things: the SPY price chart, S&P 500 breadth and yield spreads. All three are in bull mode right now. As long as SPY remains bullish, there is no sense looking for tops or bearish patterns. Instead, use bullish patterns and oversold conditions for opportunities to partake in the bull market.
The cup-with-handle is the most recent big pattern and SPY broke out on September 19th. Short-term, a flag formed into the election and SPY broke out the day after the election. After a short pullback the week after, SPY resumed its advance the last three weeks and hit new highs. %B was oversold (<0) in late October and is nowhere near an oversold setup right now.
QQQ Gets its Mojo Back
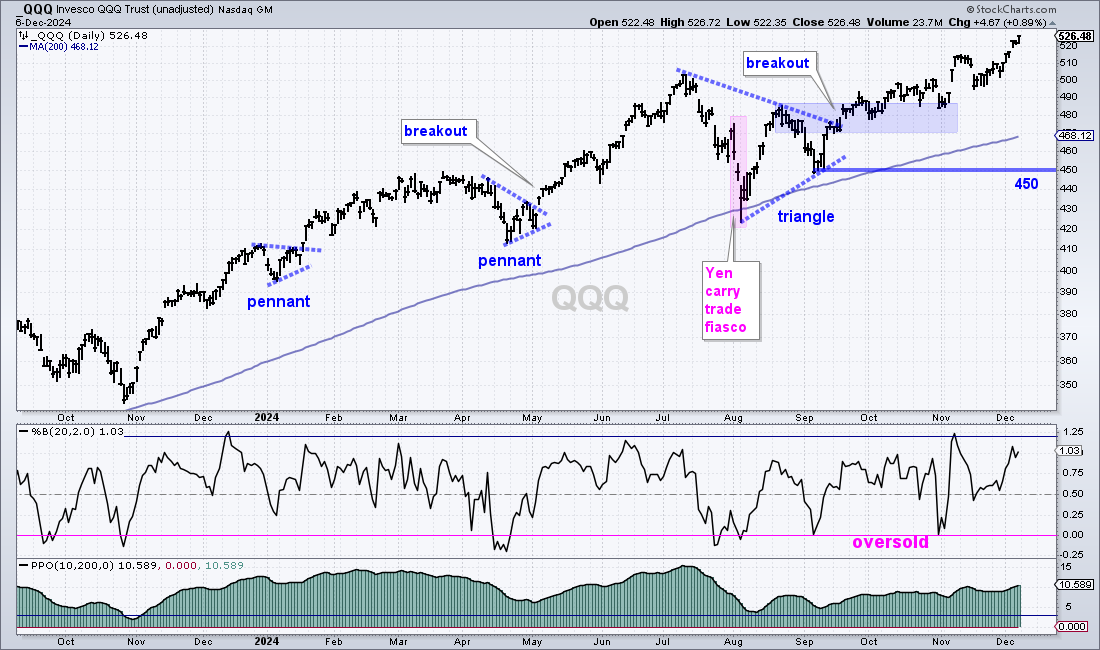
The next chart shows QQQ in an ongoing uptrend. The last big pattern was the triangle consolidation and breakout in late September. QQQ stuttered a bit after this breakout, but managed to work its way higher into October. The advance accelerated after the election as QQQ hit new highs in early November and early December.
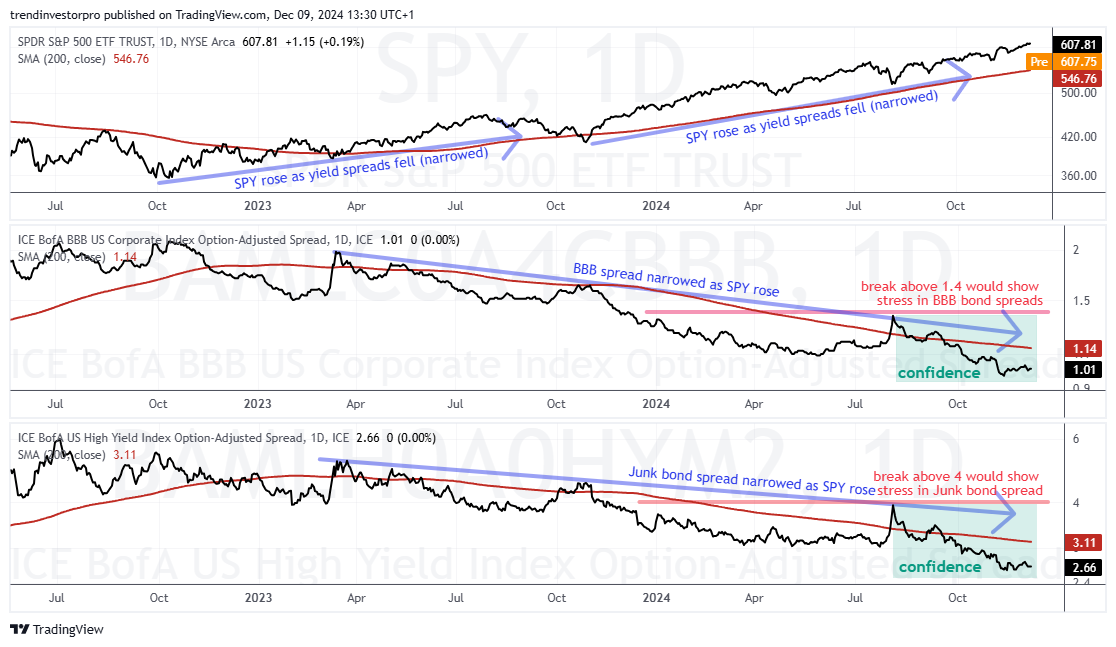
Yield Spreads Remain Narrow
The next chart shows the BBB and Junk bond yield spreads narrowing for well over a year (blue arrow lines). There was a surge (widening) in early August 2024 as the Yen carry trade fiasco briefly spooked the market. This did not last long as the spreads resumed their narrowing trend (downtrend) and moved to new lows. Narrow spreads reflect confidence in the credit markets and this is positive for stocks.
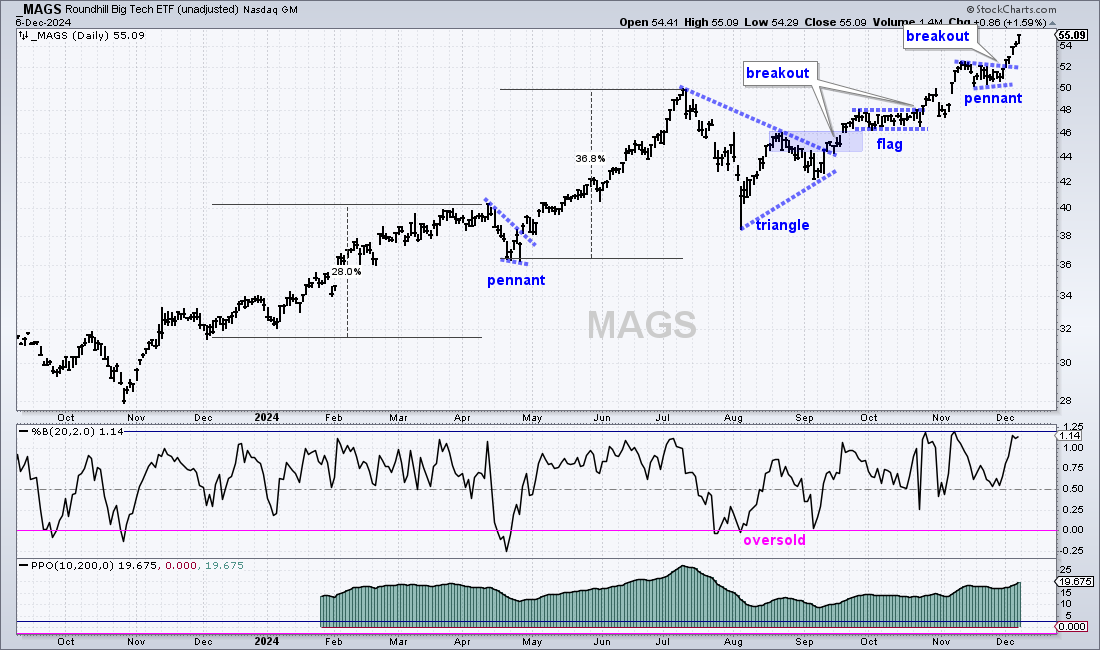
MAG7 is NOT the Lag7
Reports of underperformance in the Mag7 ETF (MAGS) have been greatly exaggerated. Sure, MAGS underperformed in July and August, but this “underperformance” occurred after two big advances since December 2023 (+28% and +37%). The triangle was viewed as a consolidation within a bigger uptrend and the mid September breakout signaled a continuation higher.
Note that MAGS is up over 20% since September and one of the top performing stock ETFs over the last three months. Since this triangle breakout, the ETF formed a flag in October and a pennant into early December. There was only one moderately oversold condition in late October. With last weeks breakout and surge, I do not see a tradable pattern or oversold setup. MAGS is simply in an ongoing, and leading, uptrend.
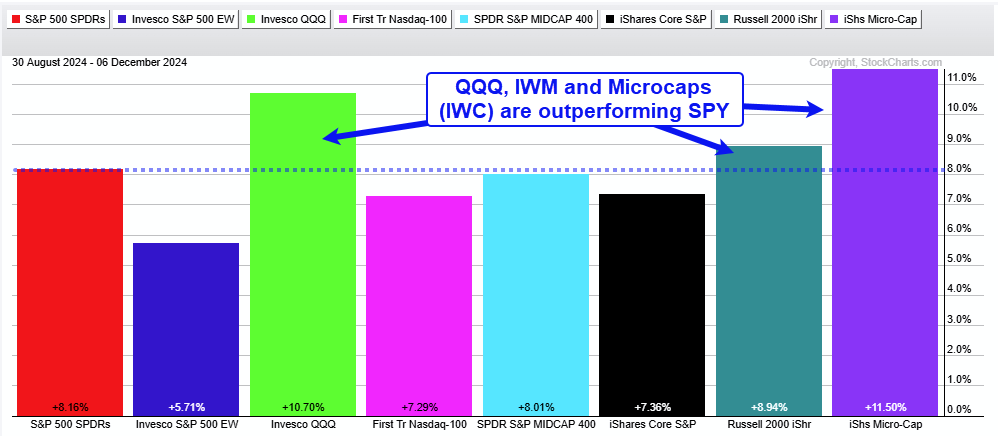
Small-caps Trying to Lead the Market
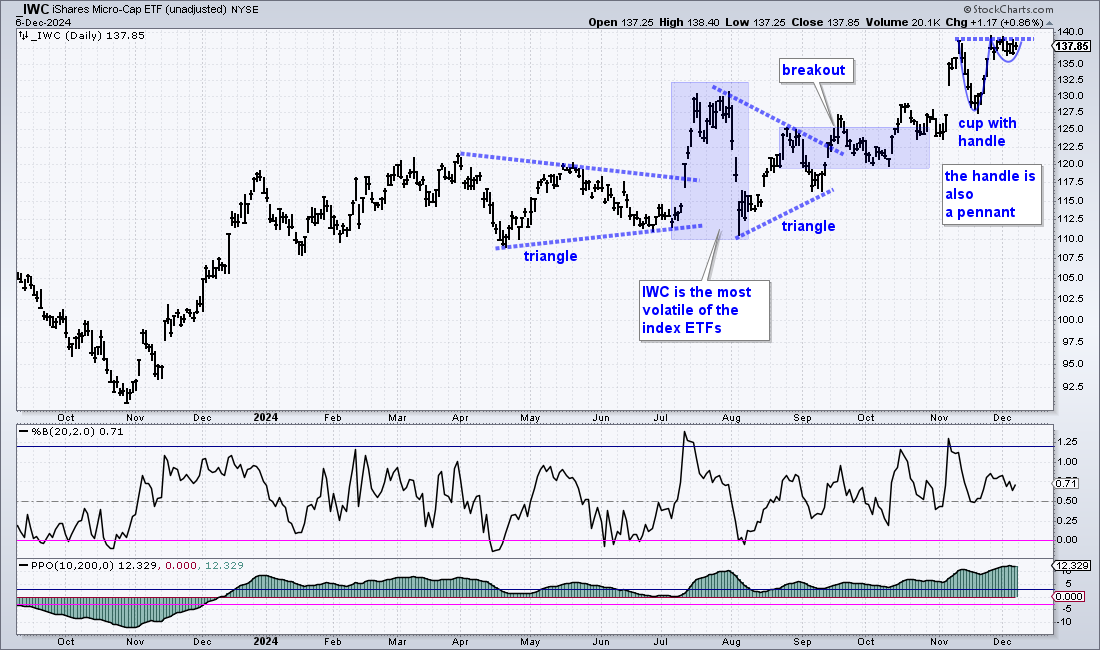
Here are the percentage changes over the last 68 trading days (since September): SPY +8.16%, QQQ +10.70%, MDY +8.01%, IJR +7.36% and IWM +8.94%. Thus, the S&P SmallCap 600 SPDR (IJR) is up a little less than SPY and the Russell 2000 ETF (IWM) is up a little more than SPY. In a bit of a surprise, the Russell Microcap ETF (IWC) is the biggest gainer (+11.50%). Micro-caps are the most speculative stocks and outperformance shows a strong appetite for risk (animal spirits).
In general, I prefer IJR over IWM because the S&P SmallCap 600 SPDR has stricter requirements for inclusion and requires at least four consecutive quarters of profitability. The Russell 2000 ETF, in contrast, is simply the 2000 smallest stocks, regardless of profitability. This makes it more speculative.
In general, volatility and Beta increase as market cap decreases. The S&P 500 sets the benchmark for volatility and Beta. Beta quantifies risk relative to the S&P 500. If the S&P 500 rises/falls 1%, a stock with a Beta of 1.5 will rise/fall 1.5%. Mid-caps have higher Betas than large-caps, small-caps have higher Betas than mid-caps and micro-caps have higher Betas than small-caps.
Mid-caps, small-caps and micro-caps are simply more erratic and less trendy than large-caps. Perhaps this will change one day, but right now these three groups are simply riskier than large-caps. Large-caps generate better returns with lower volatility.
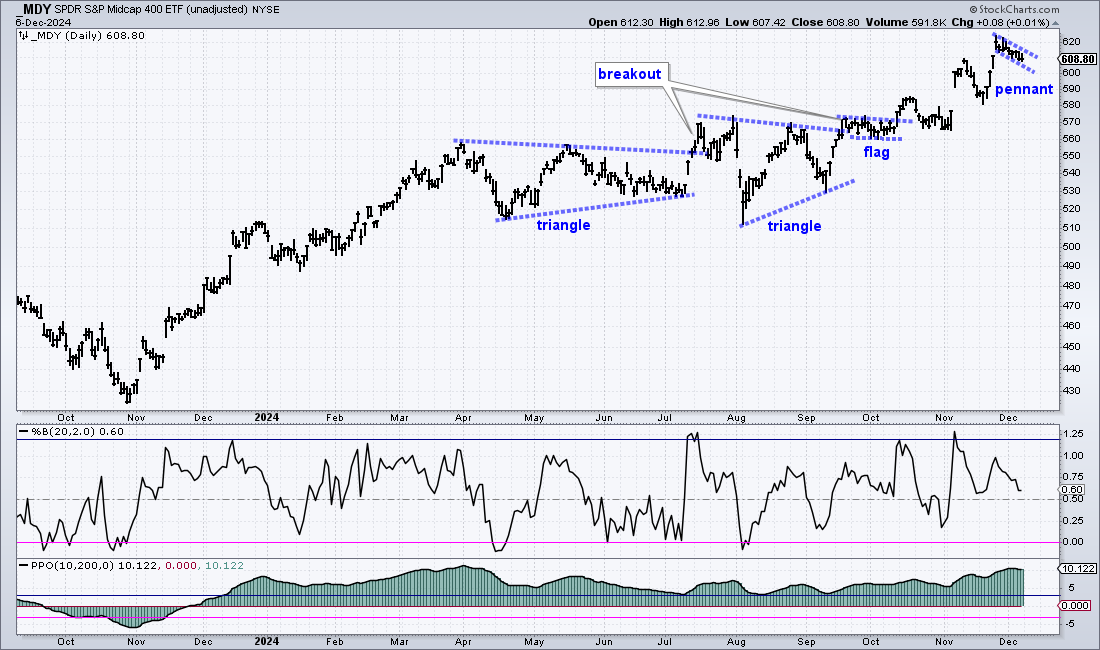
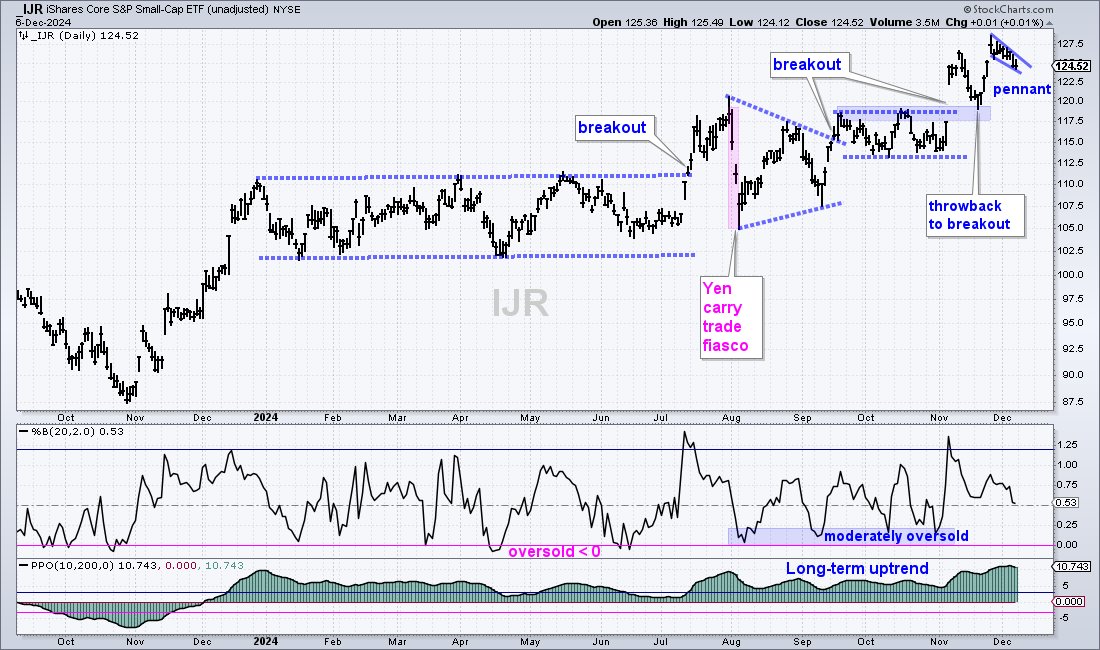
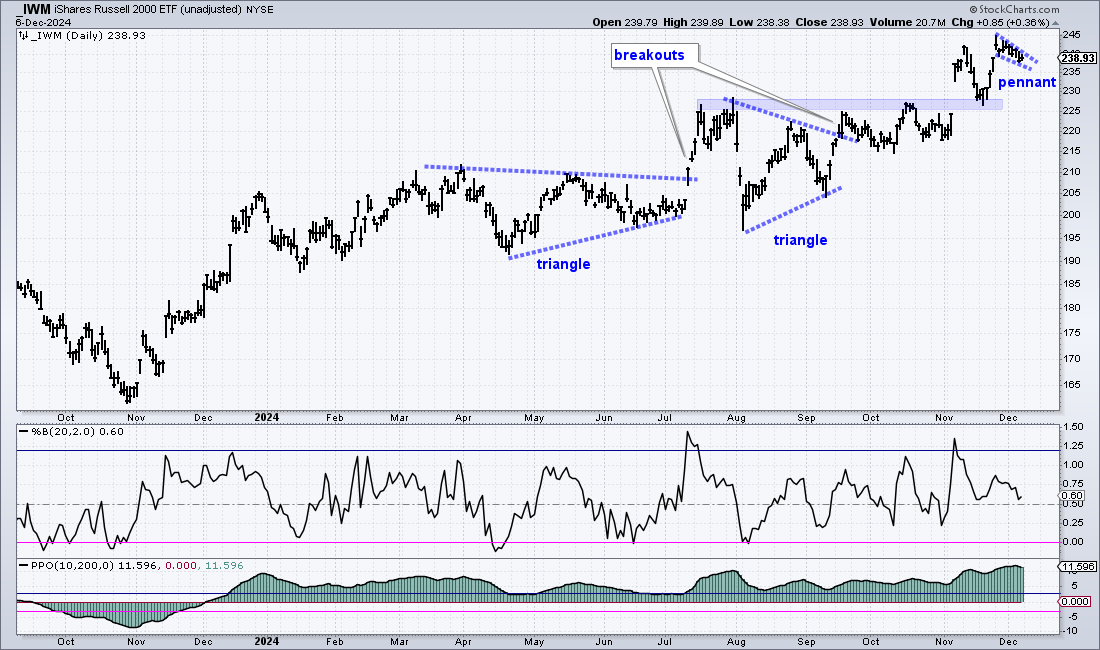
Flags and Pennants for MDY, IJR, IWM and IWC
The next four charts shows MDY, IJR, IWM and IWC with triangle breakout in September, new highs in November-December and pennants forming as they pullback since late November. After a sharp advance, a pennant is typically a bullish continuation pattern and a breakout would be bullish. Note that small-caps are sensitive to interest rate expectations and the there are two inflation-related reports this week. CPI is on Wednesday and PPI is on Thursday.
")