The next report will be posted on Tuesday morning, December 17th.
Report Headlines
Resmed Consolidates after New High
Plus the Medical Devices ETF Chart
Nvidia Holds above October Breakout Zone
Plus the Semiconductor ETF Chart
Zscaler Consolidates Near Breakout Zone
Plus the Cybersecurity ETF Chart
Crowdstrike Holds Tight Rising Channel
CyberArk Continues to Lead within the Group
Resmed Consolidates after New High
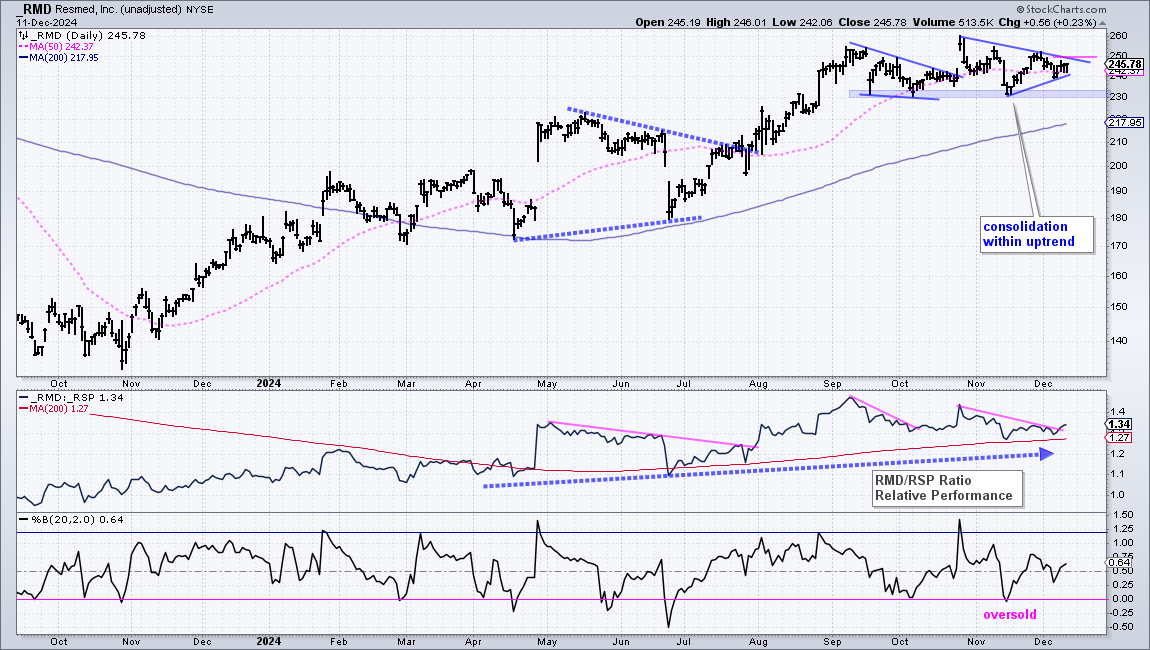
The first chart shows Resmed (RMD), a company that provides digital and cloud-connected medical devices to monitor health. RMD is in a long-term uptrend as it hit a new high in late October and remains well above the rising 200-day SMA. Overall, the stock consolidated the last three months with a triangle forming since late October. I view this as a consolidation within an uptrend, which makes it a bullish continuation pattern. A breakout at 250 would be bullish. The blue shading marks a support zone in the 230 area. The first indicator window shows the relative performance line in a long-term uptrend. It turned up the last few days and broke the October trendline.
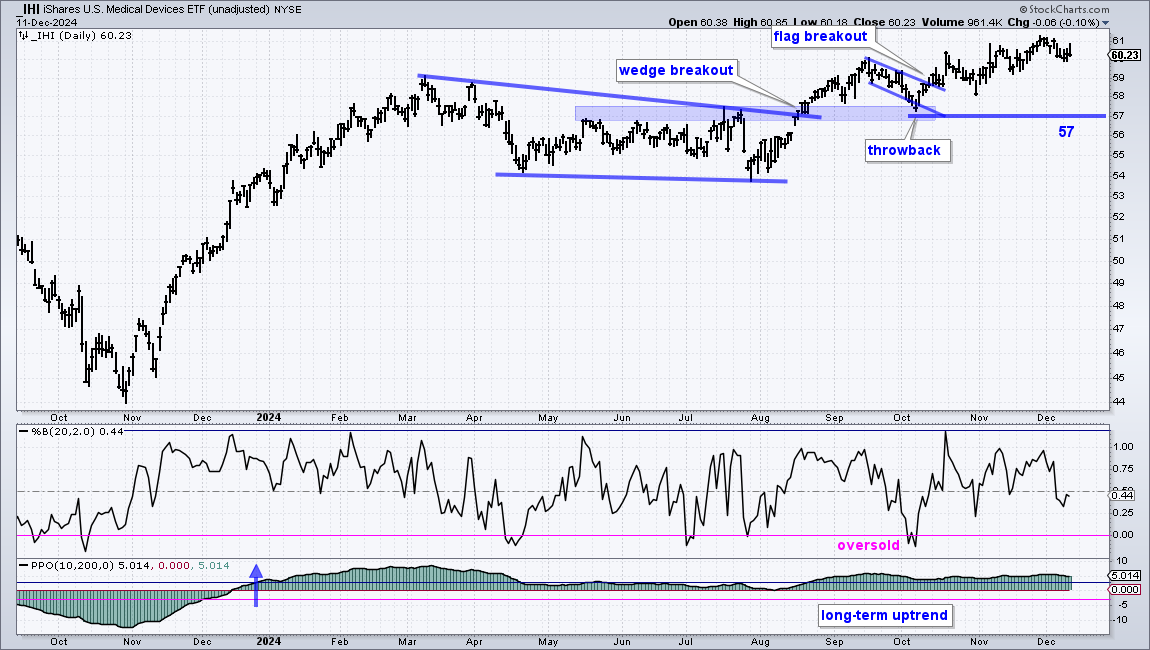
Here is the Medical Devices ETF (IHI) chart for reference.
Nvidia Holds above October Breakout Zone
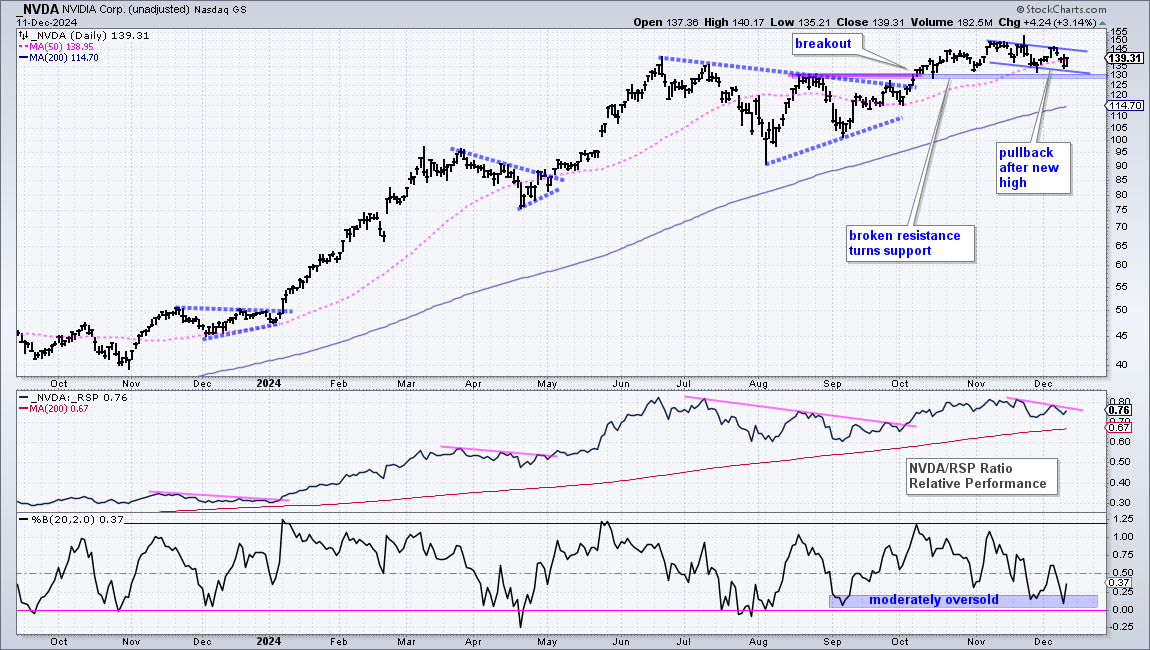
Nvidia (NVDA) remains in a long-term uptrend and the stock is a long-term leader. Medium-term, the stock is underwhelming because it is still trading near its June-July highs. Nevertheless, I see a triangle breakout in early October and this breakout is holding as the resistance zone turns support in the 130 area. NVDA hit a new high in mid November and then pulled back the last five weeks. The stock is holding just above the breakout zone and I view this as a pullback within a bigger uptrend. A breakout at 146 would be bullish. The first indicator window shows the relative performance line pulling back the last five weeks. A short-term breakout would show a return to relative strength. The bottom window shows %B becoming moderately oversold twice in the last few weeks.
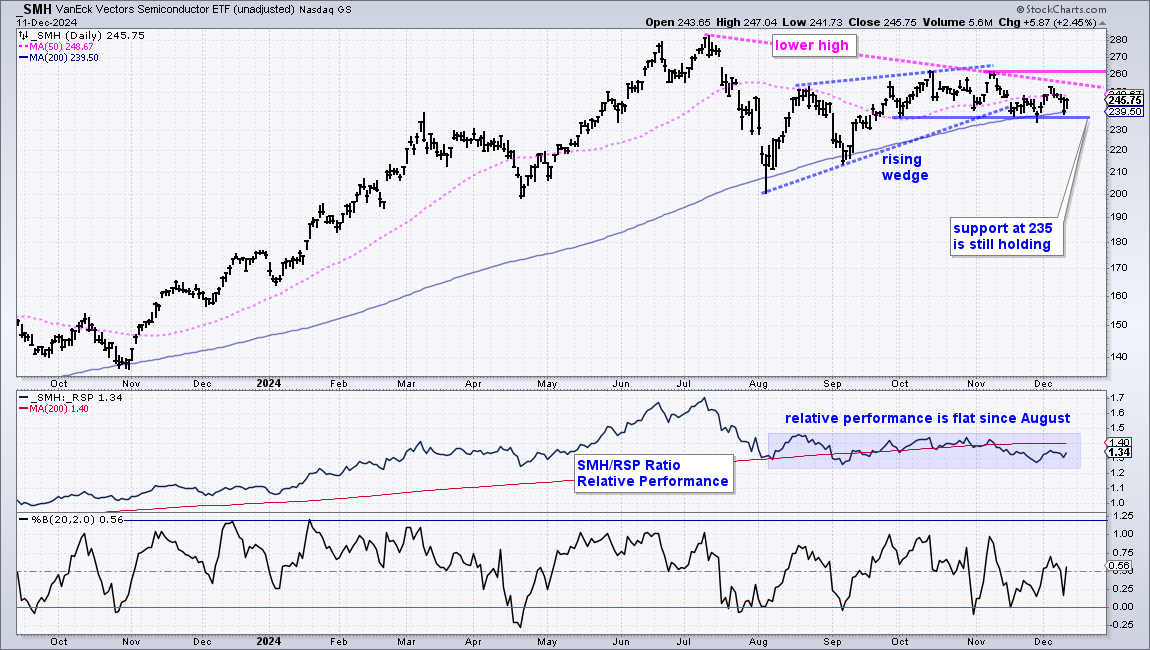
Here is the Semiconductor ETF (SMH) chart for reference.
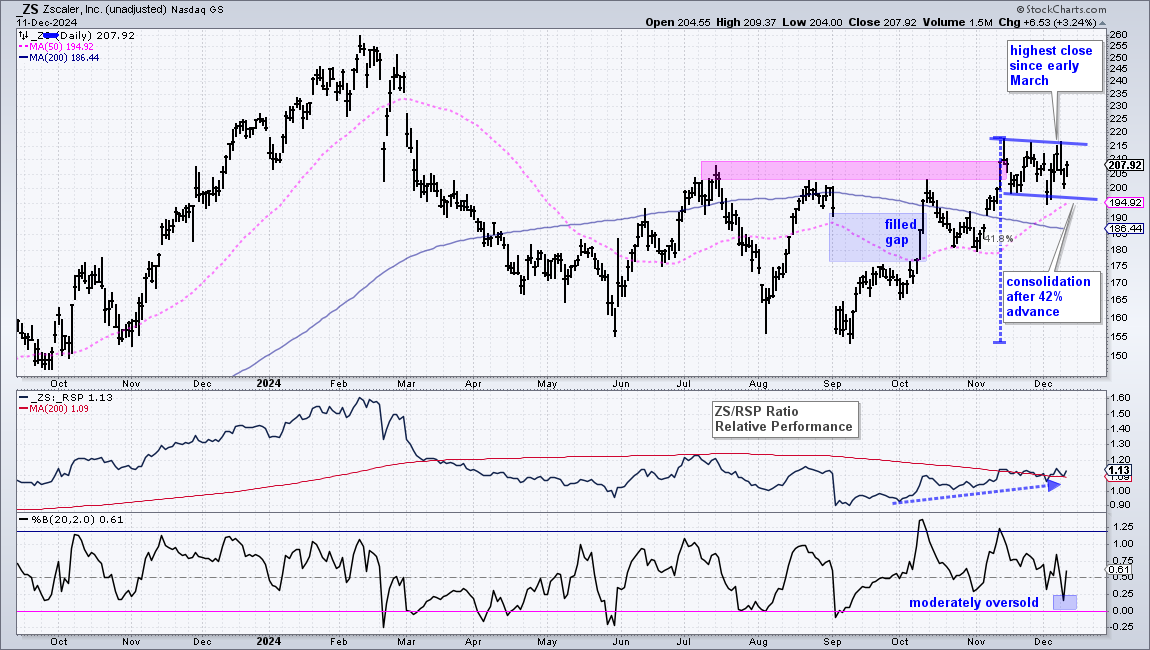
Zscaler Consolidates Near Breakout Zone
The next chart shows Zscaler (ZS), which is part of the Cybersecurity ETF (CIBR). ZS broke its summer highs with a surge in November and then consolidated near the breakout zone. I view this as a consolidation within an uptrend and a bullish continuation pattern. A breakout at 216 would be bullish and signal a continuation higher. The first indicator window shows the relative performance line rising since October and edging above the 200-day SMA. This means ZS is starting to outperform the S&P 500 EW ETF (RSP). The lower window shows %B dipping into the 0-.25 area to become moderately oversold on Tuesday.
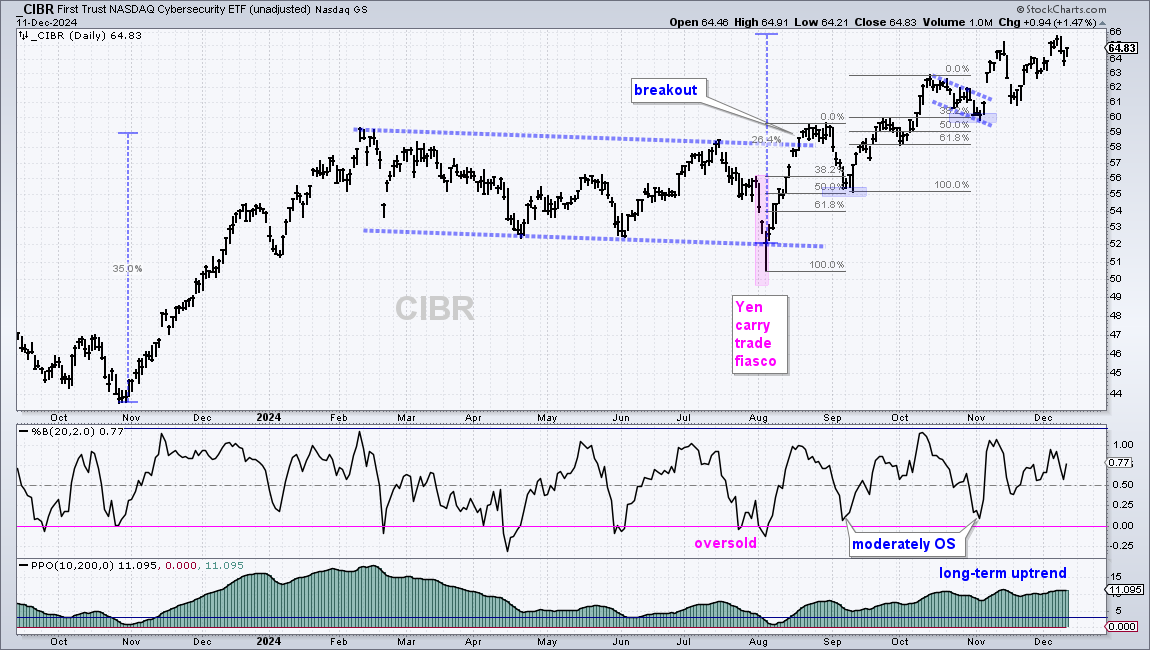
Here is the Cybersecurity ETF (CIBR) chart for reference.
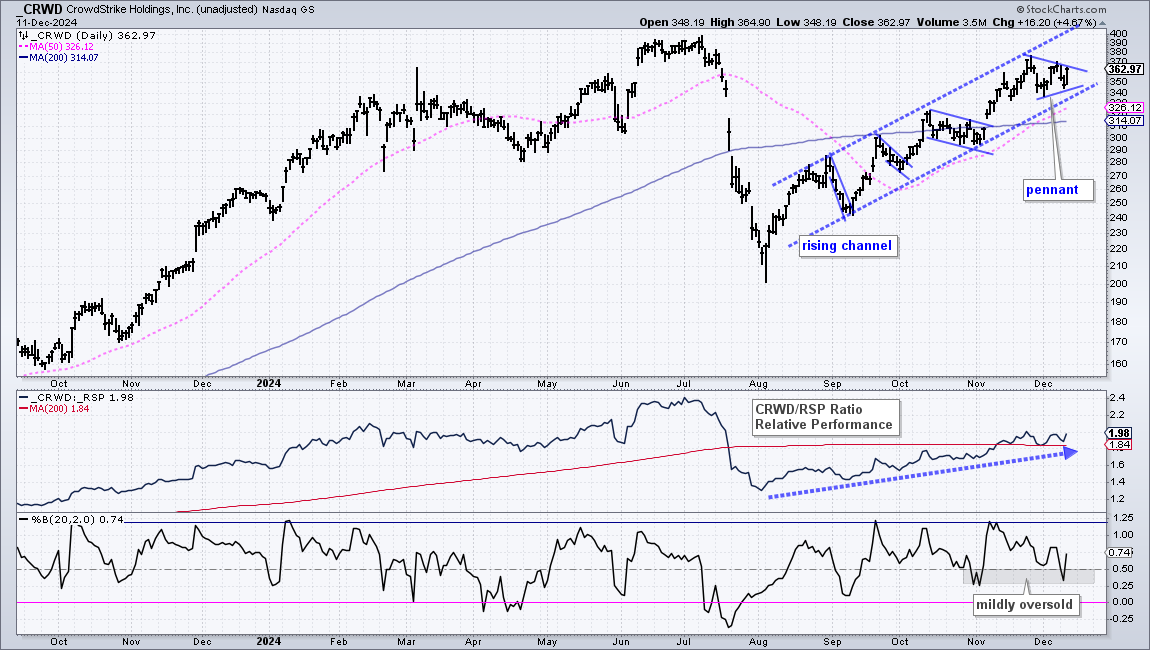
Crowdstrike Holds Tight Rising Channel
The next chart shows Crowdstrike (CRWD), which is also part of the Cybersecurity ETF (CIBR). CRWD plunged in July because a software update caused a massive outage in Windows systems. The stock then bottomed in early August and worked its way higher with a rising channel the last four months. CRWD is almost back to its pre-outage levels. Short-term, a pennant formed as the stock became mildly oversold (%B<.50). This is a short-term bullish setup and a breakout at 370 would target a move to new highs.
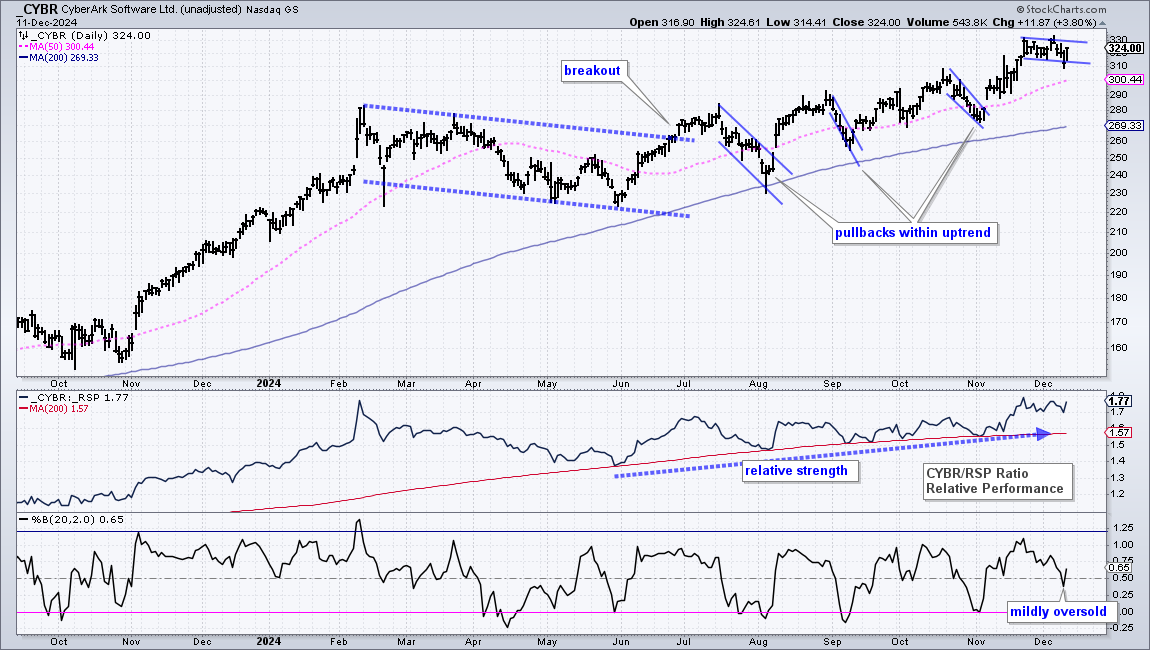
CyberArk Continues to Lead within the Group
The Cybersecurity ETF (CIBR) is in a strong uptrend and CyberArk Software (CYBR) is one of the leaders within the group. Like many stocks in the group, CYBR corrected into June, broke out in July and then worked its way higher. Price held above the rising 200-day SMA and there were three pullbacks after the breakout (solid blue lines). Most recently, CYBR surged to a new high in November and then consolidated with a flag into December. This is a short-term bullish continuation pattern and a breakout at 330 would confirm the pattern.

")