Breadth is Just Bullish Enough, TLT Flags, Oil Bounces within Correction, Dollar Hits Resistance (Premium)

The Composite Breadth Model remains bullish, which means the market regime is bullish. Breadth is not as strong as it was in April, but this has yet to affect the S&P 500. Over 90% of S&P 500 stocks were above their 100-day SMAs in April and now 61% are above their 100-day SMAs. This number is still well above 50% and supportive of an uptrend in the S&P 500. After all, you can have an uptrend as long as more than 50% of stocks are above the SMA, especially if the right stocks are above (MSFT, AAPL, GOOGL, FB…). Nevertheless, waning participation means the trading/investing environment is tougher because fewer stocks are keeping pace with the S&P 500.

  • Large-caps are strong with SPY, QQQ and the S&P 500 EW ETF (RSP) hitting new highs again this week.
  • Small-caps (IWM) and micro-caps (IWC) bounced, but remain stuck in trading ranges that extend back to March. StochClose triggered bearish on July 19th and 20th, respectively.
  • Of the 112 stock-related ETFs on the core chartlist, 65 (58%) are in uptrends and 47 (42%) are in downtrends (based on StochClose signals). This uptrend percent almost matches the percentage of S&P 500 stocks above the 100-day SMA (61%). Ten of the eleven sector SPDRs are in uptrends with XLE being the only downtrend. 
  • The Composite Breadth Model (CBM) remains bullish and has been bullish since May 2020 (see Market Regime page for charts covering the CBM, yield spreads and Fed balance sheet).
  • AAA and BBB yield spreads narrowed this week. They remain narrow overall and there are no signs of serious stress at the investment grade end of the bond market.
  • Junk bond and CCC spreads narrowed this week as oil bounced. Overall, spreads remain narrow and there are no signs of serious stress at the riskiest end of the bond market.
  • StochClose turned bullish for TLT on July 8th and the ETF formed a bull flag the last six weeks.
  • The Dollar broke out of a 4-5 week consolidation and is challenging its March high as a big double bottom takes shape.  
  • Gold remains in a long-term and medium-term downtrend (falling wedge), but broke out of a small flag, and I do mean small.
  • Oil fell with a falling channel the last two months, but became oversold last week and got a strong oversold bounce this week.  
  • Seasonally, September is the weakest month of the year for the S&P 500, but price action remains strong for large-caps (click here for full report on seasonal patterns).

TLT Forms Bull Flag above 200-day

Jackson Hole is the talk of the town for the bond markets and the Dollar, which in turn affects gold, and perhaps oil. I do not have a read on the Fed and prefer to simply analyze the bond ETFs and Treasury yields. Moreover, the bond market tends to lead the Fed, not the other way around.

The 20+ Yr Treasury Bond ETF (TLT) is in a long-term uptrend as StochClose triggered bullish in early July and price moved above the 200-day SMA in mid July. After a strong advance from mid May to mid July, TLT corrected a little with a falling flag, which is typically a bullish continuation pattern. The ETF fell back this week as stocks surged, but the flag remains and I still consider it a bullish continuation pattern. Technically, the falling flag means the short-term trend is down until a breakout. RSI dipped into oversold territory in mid August and there was a StochRSI pop on August 18th. As such, expectations are for a flag breakout and continuation higher. A break below 145 would call for a re-evaluation.

The 10-year Yield is pretty much a mirror image of the 20+ Yr Treasury Bond ETF (TLT) and 7-10 Yr Treasury Bond ETF (IEF). Bonds rise when yields fall and bonds fall when yields rise. Admittedly, the chart for the 10-yr Yield could certainly be viewed either way. Note that my bias flipped from bullish to bearish to bullish over the last three weeks as the yield gyrates around the 200-day SMA. Most by Jackson Hole related noise. This is a moment of truth that is lasting a month and we have the employment report next Friday. Ugh. With a surge back above the 200-day SMA this week, the 10-yr Yield is making an attempt to reverse near the 50% retracement line. The bounce over the last few weeks could be a bear flag and a break below 1.24 would argue for a move lower. The short-term bias is up as long as the flag rises.

Gold Remains in Long and Medium Term Downtrends

The long-term trend for the Gold SPDR (GLD) is down because StochClose turned bearish on June 22nd and price is below the falling 200-day. The medium-term trend is down with the falling wedge since mid June (bar chart). A move above 172 is needed to reverse the falling wedge and get back above the 200-day. On the candlestick chart, GLD broke out of a mini flag and then fell back to the breakout zone. This is a very short-term pattern. Chartists should also consider TLT and the Dollar. TLT is positively correlated with GLD, which means a flag breakout in TLT would be bullish for GLD. UUP is negatively correlated with GLD, which means a fall in the Dollar would be bullish for gold.  

Dollar Challenges March High

The Dollar Bullish ETF (UUP) made a big move here in August with a flag breakout and a challenge to the March high. Short-term, the flag breakout is bullish. Long-term, a big double bottom formed in 2021 and the break above the March high would confirm the pattern. Note that StochClose turned bullish on June 23rd.

Oil Bounces within Correction

Oil hit a new high in early July and then fell back towards the rising 200-day the last seven weeks. Oil hit a support zone marked by the prior triangle consolidation and the Momentum Composite became oversold last Thursday-Friday by hitting -3. The combination of support and oversold conditions gave way to an 8.18% bounce this week as oil moved back above 67. The trend since July is down, but the falling channel looks like a correction within a bigger uptrend. A breakout at 71 would reverse this fall and signal a continuation higher.

Thanks for tuning in and have a great weekend!

ETF Trends, Patterns and Setups – A Choppy Affair, More Uptrends than Downtrends, Breakouts Holding and Failing (Premium)

Chop is the name of the game for a large part of the market. Some ETFs are grinding higher with tight and steady uptrends (SPY, XLC) and some are in more volatile uptrends (QQQ, IHI). Several of these are quite extended too. We saw a number of

ETF Trends, Patterns and Setups – A Choppy Affair, More Uptrends than Downtrends, Breakouts Holding and Failing (Premium) Read More »

Weekend Video – Large-caps Continue to Lead, TLT Perks Up, Some Breakouts Holding and Some are Failing (Premium)

Large-caps remain in bull mode with SPY, QQQ and the S&P 500 EW ETF leading. Small-caps and micro-caps tell another story with downtrend signals based on StochClose. We have yet to see a flight to safety that could trigger a correction in SPY, but I am watching TLT as it forms a bull

Weekend Video – Large-caps Continue to Lead, TLT Perks Up, Some Breakouts Holding and Some are Failing (Premium) Read More »

Junk Bond Spreads Widen, Small and Micro Caps Underperform, Energy Related ETFs Fail to Bounce (Premium)

Today’s commentary will look at the recent widening in Junk bond spreads because this widening shows less confidence in corporate bonds with the highest risk. We are also seeing some risk aversion in the stock market because small-caps are lagging large-caps. Small-caps represent higher

Junk Bond Spreads Widen, Small and Micro Caps Underperform, Energy Related ETFs Fail to Bounce (Premium) Read More »

Stock/Bond Ratio Turns, Gold Follows TLT Lower, Oil Hits Support with a Bang and the Dollar Remains Rangebound (Premium)

The stock market environment is bullish and we are seeing a rotation within the stock market. Yield spreads are edging up, but so is the Fed balance sheet. Elsewhere, we are seeing more risk appetite when looking at the stock/bond ratio. The recent breakdown in bonds appears

Stock/Bond Ratio Turns, Gold Follows TLT Lower, Oil Hits Support with a Bang and the Dollar Remains Rangebound (Premium) Read More »

ETF Trends, Patterns and Setups – Signs of Rotation, Old Economy ETFs Start to Lead, Prior Leaders Start to Lag, SPY Doesn’t Care (Premium)

Signs of rotation kicked in with a big surge in the 10-yr yield and the rotations continued over the past week. We are seeing leadership from the groups that lagged from May to July. These are ETFs related to finance, industrials, materials and housing. ETFs related to tech and healthcare led the market from May to July and these groups could be poised

ETF Trends, Patterns and Setups – Signs of Rotation, Old Economy ETFs Start to Lead, Prior Leaders Start to Lag, SPY Doesn’t Care (Premium) Read More »

Weekend Video – Big Moves in Bonds, Gold and the Dollar trigger Signs of Rotation within Stock Market (Premium)

Signs of rotation suddenly appeared in the markets with the Treasury bond ETFs falling sharply and the 10-yr yield surging. The Dollar followed yields higher, while the Gold SPDR followed bonds lower. Within the stock market, we saw strength in banks lift small-caps and weakness in XLY and XLK weigh on the S&P 500 SPDR. Elsewhere, the S&P 500 EW

Weekend Video – Big Moves in Bonds, Gold and the Dollar trigger Signs of Rotation within Stock Market (Premium) Read More »

Treasury bond ETFs, Gold and Dollar Battle 200-day SMAs – Oil and SPY Remain Firmly Above Rising 200-day SMAs (Premium)

This report covers the intermarket arena: oil, bonds, gold and the Dollar. In particular, the 200-day SMAs are in play for the Treasury Bond ETFs, the 10-yr Treasury Yield, the Gold SPDR and the Dollar Bullish ETF. The Treasury bond ETFs and Dollar are just above their FALLING 200-day SMAs, and the Gold

Treasury bond ETFs, Gold and Dollar Battle 200-day SMAs – Oil and SPY Remain Firmly Above Rising 200-day SMAs (Premium) Read More »

ETF Trends, Patterns and Setups – S&P 500 Continue to Lead, Finance and Industrial SPDRs Battle for Breakouts, EV ETFs Take the Lead Again (Premium)

Tech, Healthcare, Communication Services, REITs and Water are leading the market since mid May. ETFs related to Finance, Industrials, Materials and Energy corrected in June and July. Some made bids to end these corrections (Housing, Copper, Steel) and some are struggling to get above resistance (XLI, XLF). Downtrends in the Regional Bank ETF

ETF Trends, Patterns and Setups – S&P 500 Continue to Lead, Finance and Industrial SPDRs Battle for Breakouts, EV ETFs Take the Lead Again (Premium) Read More »

Identifying and Trading the Falling Wedge (Video) – Successes, Failures and Two Current Setups

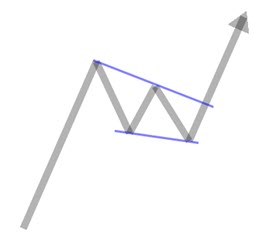
The falling wedge is a bullish continuation pattern that chartists can use to trade or invest in the direction of the underlying trend. I realized that some books show falling wedges as bullish reversal patterns, but I am only interested in bullish continuation patterns and I choose to ignore names that are hitting new lows. This video will show

Identifying and Trading the Falling Wedge (Video) – Successes, Failures and Two Current Setups Read More »

Weekend Video and Chartbook – QQQ Leads Lower, SPY and Oversold Conditions, Turn of the Month, Selling Climax in TLT (Premium)

Stocks corrected over the last two weeks with QQQ leading the way. IWM held up the best and RSI moved into the oversold zone for SPY. Today we will look at previous instances when RSI became oversold for SPY. Some indicators are pointing to a multi-week correction (NDX %Above 50-day), but we also have the turn of the month upon

Weekend Video and Chartbook – QQQ Leads Lower, SPY and Oversold Conditions, Turn of the Month, Selling Climax in TLT (Premium) Read More »

Timing Models – QQQ Reverses Short-term Uptrend, 3 Big Sectors Weigh, Medium-term Participation Wanes within SPX (Premium)

The long-term evidence (primary trend) is bullish, but we are seeing some short-term weakness (secondary trend). This is especially true in the Nasdaq 100 and Technology sector. SPY is holding up better because the Finance, Industrials and Communication Services are picking up the slack. The table below summarizes the broad market environment using the

Timing Models – QQQ Reverses Short-term Uptrend, 3 Big Sectors Weigh, Medium-term Participation Wanes within SPX (Premium) Read More »

ETF Trends, Patterns and Setups – Cyclical ETFs Lead, Tech ETFs Pullback, High-Flyers Correct Hard (Premium)

February is turning into a big month for cyclically oriented ETFs. These include: Copper Miners ETF, Metals & Mining SPDR, DB Base Metals ETF, Oil & Gas Equipment & Services ETF, Oil & Gas Exploration & Production ETF, Airline ETF, Transports ETF, Industrials SPDR, Regional Bank ETF, S&P SmallCap 600 SPDR, S&P MidCap 400 SPDR and Semiconductor ETF. The lists below shows ETFs with big gains over the last 17 trading days (February).

ETF Trends, Patterns and Setups – Cyclical ETFs Lead, Tech ETFs Pullback, High-Flyers Correct Hard (Premium) Read More »

Sector Breadth Models versus a Simple Trend Following Technique

Sometimes what seems logical and helpful, is not and needs to be reconsidered. This is my conclusion with the sector breadth models. They are logical, and perhaps helpful at times, but they do not add value when it comes to timing trends in the sector SPDRs. A simple StochClose strategy performed better overall. This article will quantify signals for three breadth models using the sector SPDRs.

Sector Breadth Models versus a Simple Trend Following Technique Read More »

Weekend Video and Chartbook – Oil and Base Metals lead, XLI and XLF Hit New Highs, TLT Plunges with Outsized Decline (Premium)

Today’s video starts with a performance overview for 14 asset class ETFs, sectors and top S&P 500 stocks. Small-caps, oil and commodity-related ETFs are leading the charge here in 2021. Financials are leading as XLF hit a new high and industrials came to life with XLI hitting a new high on Friday. Even though the long-term trends are up and the market is bullish overall, participation is narrowing within

Weekend Video and Chartbook – Oil and Base Metals lead, XLI and XLF Hit New Highs, TLT Plunges with Outsized Decline (Premium) Read More »

Scroll to Top