")
The Composite Breadth Model remains bullish, which means the market regime is bullish. However, we are seeing more deterioration under the surface and also some strength in Treasuries, which are risk off assets. We were seeing a rotation into ETFs relate to finance, industrials, and materials as the 10-yr yield surged above its 200-day SMA last week. This surge/breakout failed and this failure is threatening to derail the rotation seen in early August. Large-caps are still holding up fine (SPY, QQQ), but stocks outside of the S&P 500 are struggling. Risk is increasing for a correction with August and September being the weakest months of the year from a seasonal perspective.
- Large-caps are performing fine with SPY, QQQ and RSP hitting new highs in August and remaining above their 50-day SMAs.
- Mid-caps, small-caps and micro-caps are not performing well. MDY peaked on April 29th, but remains with a StochClose bullish signal. IWM and IWC peaked on March 15th and StochClose triggered bearish on July 19th and 20th, respectively.
- 41% of stock-related ETFs are in downtrends. Of the 114 stock-related ETFs on the core chartlist, 47 (41%) are in downtrends and 67 (59%) are in uptrends (based on StochClose signals). Ten of the eleven sector SPDRs are in uptrends with XLE being the only downtrend.
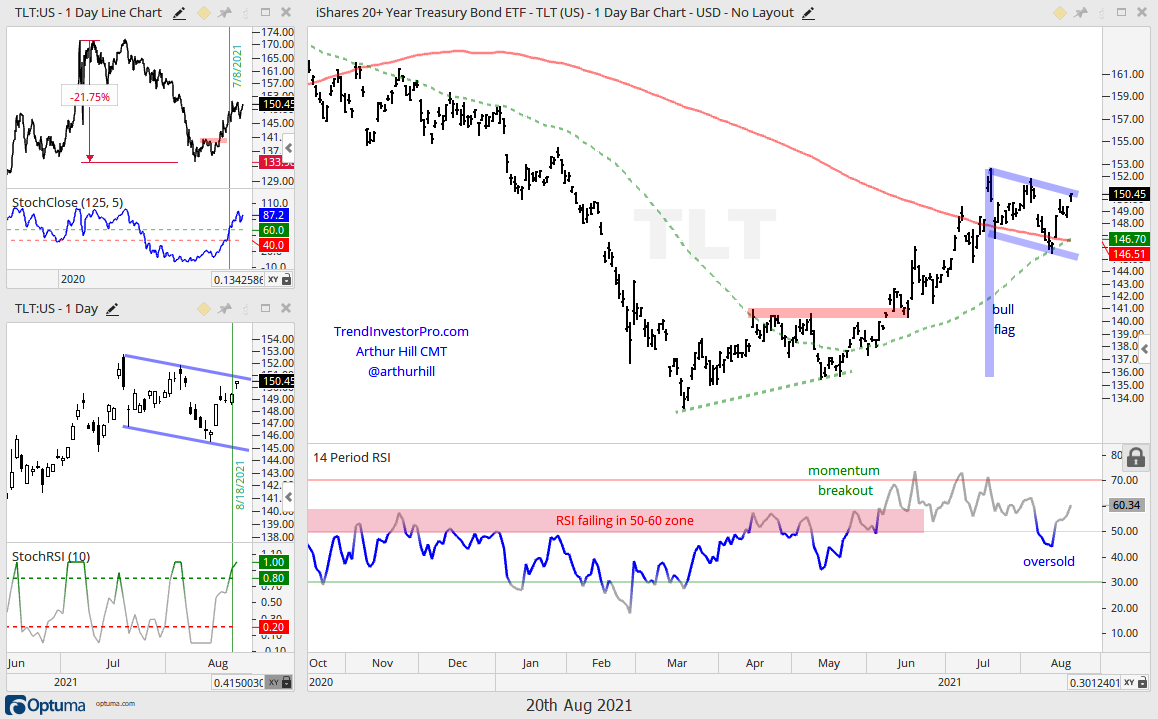
- With a big move the last five days, Treasuries are outperforming stocks and junk bonds again. The 20+ Yr Treasury Bond ETF (TLT) is up over 10% the last 65 days (three months), which is more than SPY (+6.78%) and the Junk Bond ETF (+.29%).
- StochClose turned bullish for TLT on July 8th and the ETF formed a bull flag the last four to five weeks.
- The Composite Breadth Model (CBM) remains bullish and has been bullish since May 2020 (see Market Regime page for charts covering the CBM, yield spread and Fed balance sheet.
- AAA and BBB yield spreads edged higher since late June, but remain at low levels overall.
- Junk bond and CCC spreads edged higher since early July, but remain at low levels overall.
- The Dollar broke out of a 4-5 week consolidation an exceeded its mid March high.
- Gold is anyone’s guess.
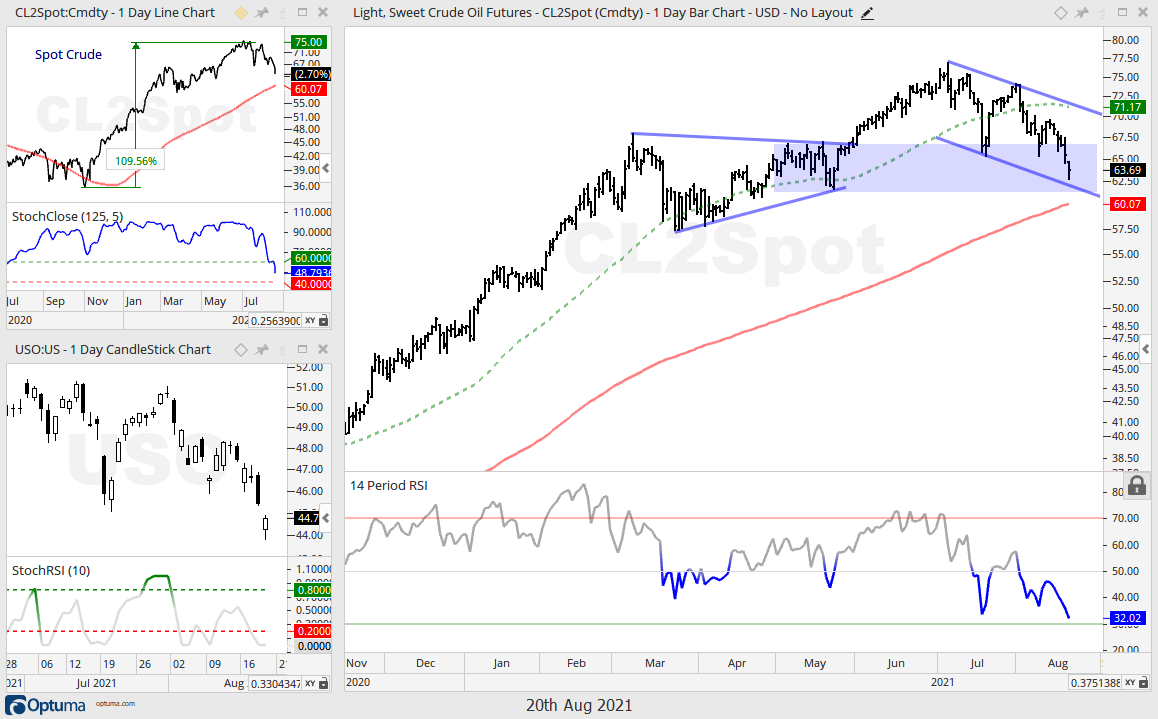
- Oil is in a long-term uptrend, entering a support zone and oversold.
- Seasonally, August and September are the weakest months of the year for the S&P 500, but price action remains strong for the index (click here for full report on seasonal patterns).
TLT Forms Bull Flag
I had a bearish bias on the 20+ Yr Treasury Bond ETF (TLT), but am changing to a bullish bias. The pure discretionary side of me “thinks” the advance from March to July is a bear market rally. However, the systematic side indicates that the long-term evidence is bullish and this favors bullish patterns and setups. Systematically, StochClose turned bullish on July 8th and is currently at 87, which puts TLT in the top 30 on the ranking table. This alone is enough reason to favor bullish setups over bearish setups. As such, TLT formed a bull flag after the March-July surge and is poised to break out. The candlestick chart shows a StochRSI pop on Wednesday. A flag breakout would argue for further strength towards the 160 area and also for further downside in the 10-yr Treasury yield. A decline in the 10-yr Treasury yield could weigh on banks because they have been positively correlated to movements in the 10-yr yield.
Before looking at the seasonality chart for $TNX, note that yields decline when Treasury bonds advance and yields rise when Treasury bonds decline. The next chart shows that August is the weakest month for the 10-yr Yield ($TNX), which means it is the strongest month for Treasury bonds. The 10-yr yield rose just 25% of the time in August over the last 25 years. This implies that Treasury bonds advanced 75% of the time in August.
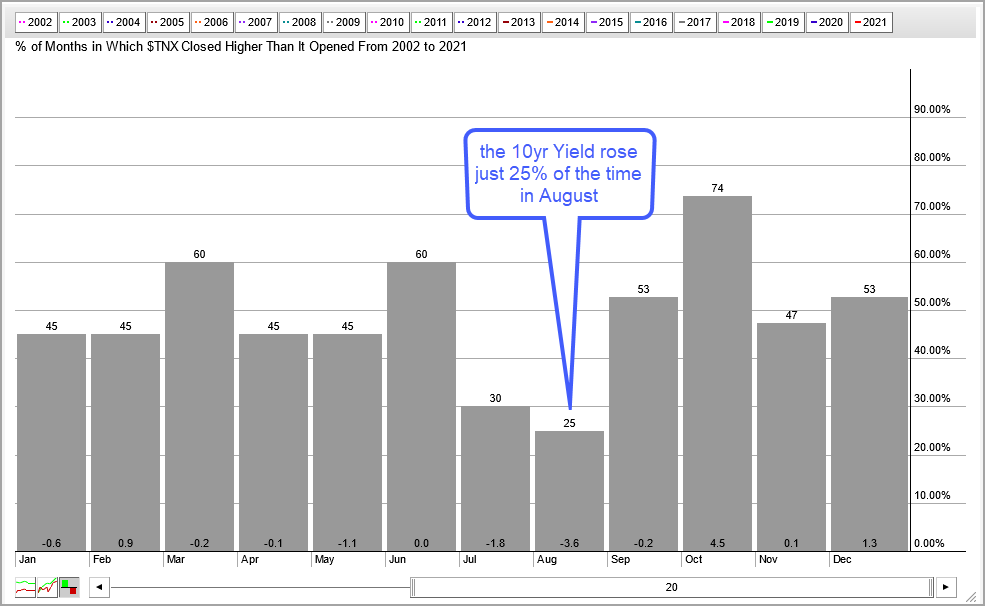
I am using $TNX for this seasonality chart because the TLT data at StockCharts includes the monthly dividends (payouts). I tried to precede the symbol with an underscore (_TLT), but this did not work. My data preference is NOT to adjust for ordinary dividends. Want to see the difference dividends make? Compare seasonality charts for $SPX (no dividends) and SPY (dividends). Dividend adjustments add an upward bias to a price series over time. See this article for details.
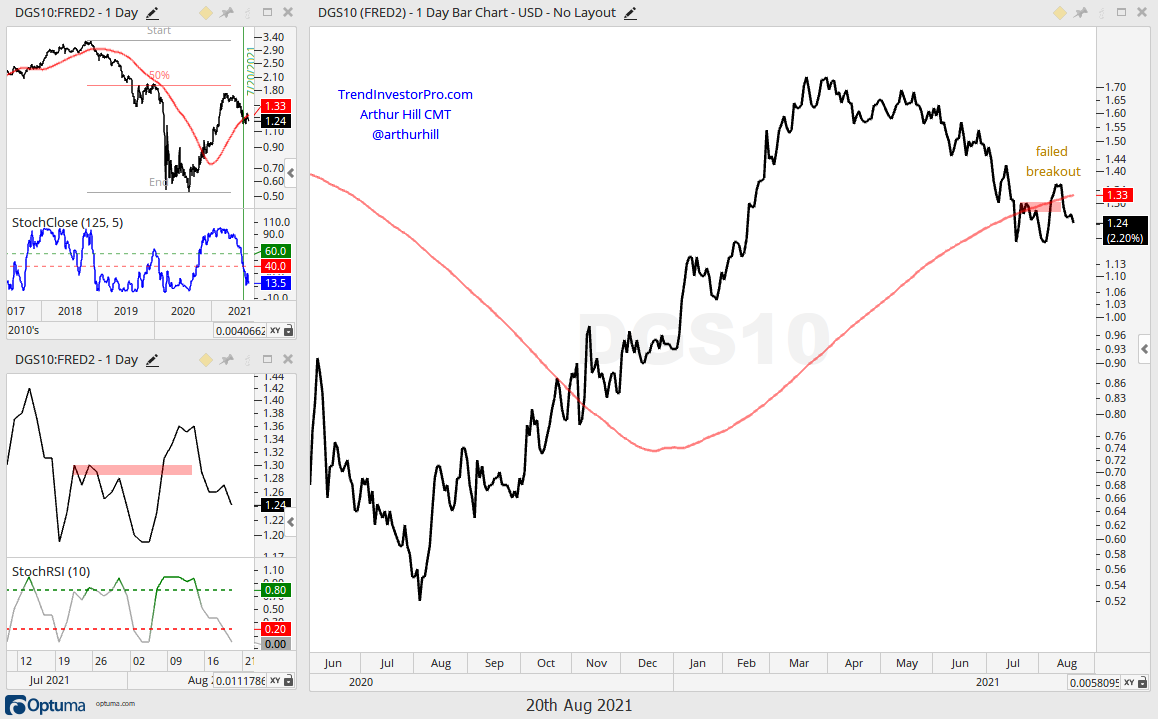
The next chart shows the 10yr Yield breaking out in early August and then falling back below the 200-day SMA this week. This is a failed breakout. The line chart (upper left) shows the 10-yr Yield reversing near the 50% retracement line and just below the highs from late 2019. StochClose also turned bearish on July 20th.
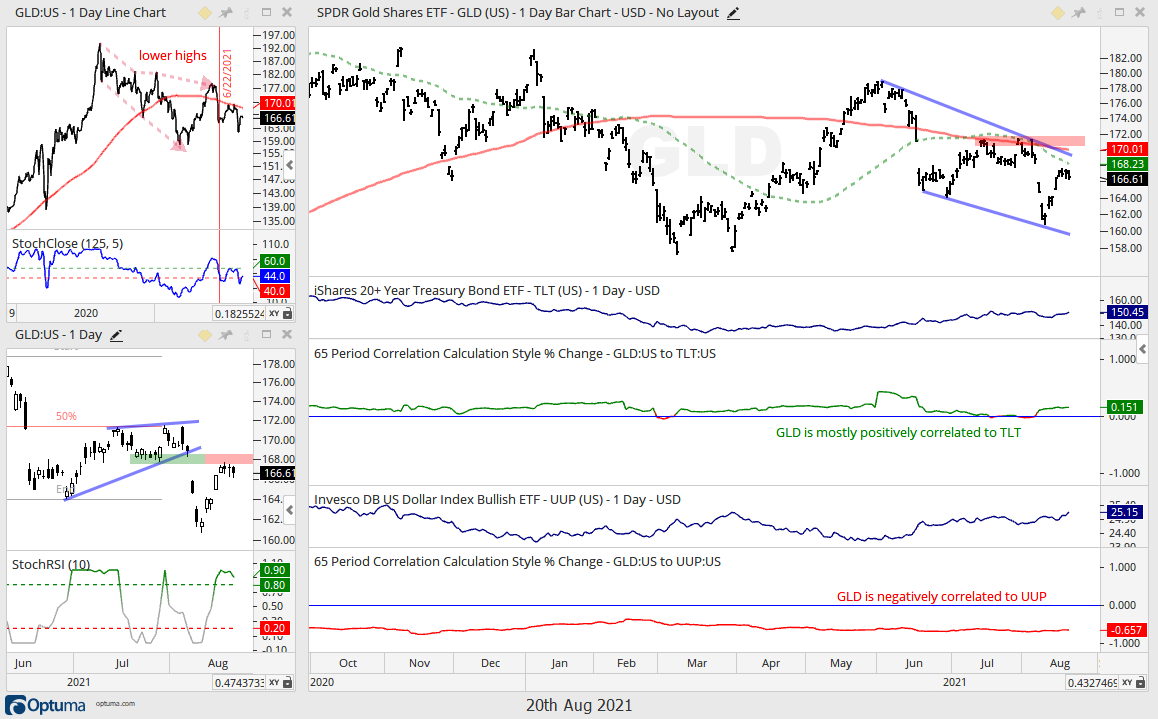
Gold Remains in Long and Medium Term Downtrends
The long-term trend for the Gold SPDR (GLD) is down because StochClose turned bearish on June 22nd and price is below the falling 200-day. The medium-term trend is down with the falling wedge since mid June (bar chart). A move above 172 is needed to reverse the falling wedge and get back above the 200-day. On the candlestick chart, GLD is running into potential short-term resistance from the wedge break (broken support turns resistance). Note that GLD is positively correlated to TLT and negatively correlated to UUP. Strength in TLT would be positive for GLD, but strength in UUP would be negative. No wonder gold is such a mess.
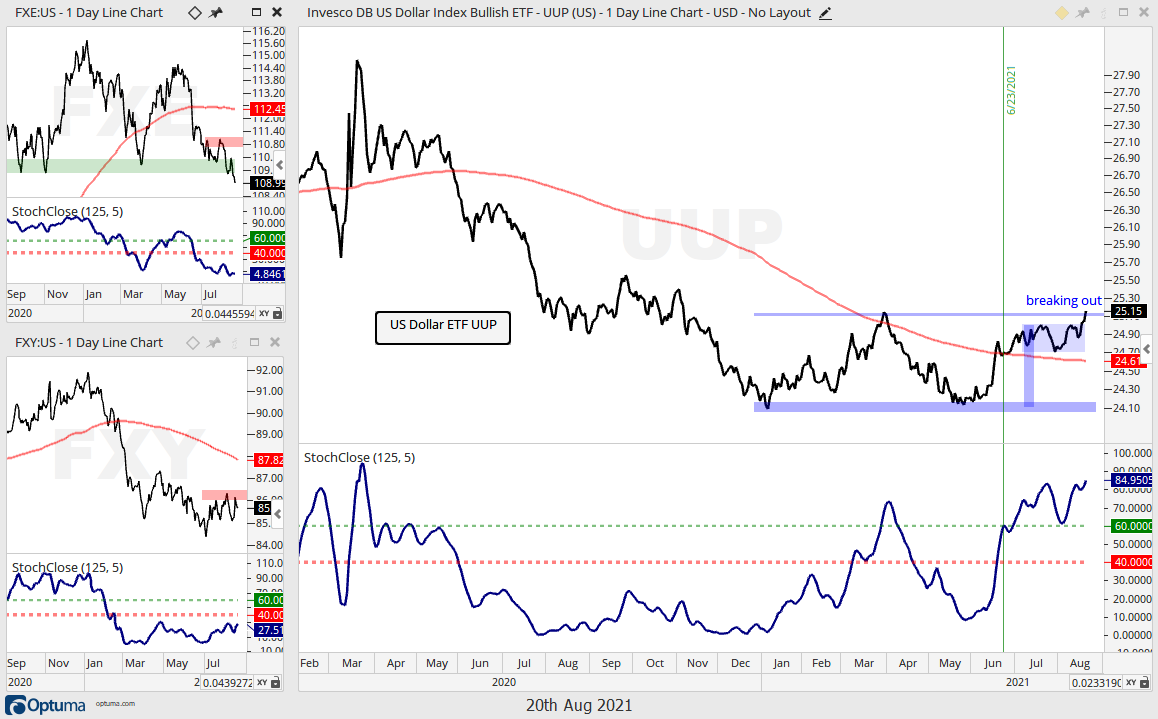
Dollar Breaks Flag and March High
The Dollar Bullish ETF (UUP) made a big move here in August with a flag breakout and a break above the March high. Short-term, the flag breakout is bullish. Long-term, a big double bottom formed in 2021 and the break above the March high confirms the pattern. Note that StochClose turned bullish on June 23rd.
Oil Hits Support Zone
Oil is still in a long-term uptrend, even though the oil related ETFs broke down over the last few weeks and are in long-term downtrends (XLE, XES, XOP). The breakdown in these ETFs is perhaps an omen for oil. On the line chart (upper left), StochClose for spot crude fell sharply and is below 50. Further weakness below 40 would trigger a downtrend signal. On the bar chart, spot crude fell to a big support zone marked by the apex of the prior triangle. A falling channel of sorts is taking shape and RSI is quite oversold (32). Chartists interested in oil should watch StochClose (lower left) for a pop above .80 for an early bullish signal.