")
The Composite Breadth Model remains bullish, which means the market regime is bullish. Breadth is not as strong as it was in April, but this has yet to affect the S&P 500. Over 90% of S&P 500 stocks were above their 100-day SMAs in April and now 61% are above their 100-day SMAs. This number is still well above 50% and supportive of an uptrend in the S&P 500. After all, you can have an uptrend as long as more than 50% of stocks are above the SMA, especially if the right stocks are above (MSFT, AAPL, GOOGL, FB…). Nevertheless, waning participation means the trading/investing environment is tougher because fewer stocks are keeping pace with the S&P 500.
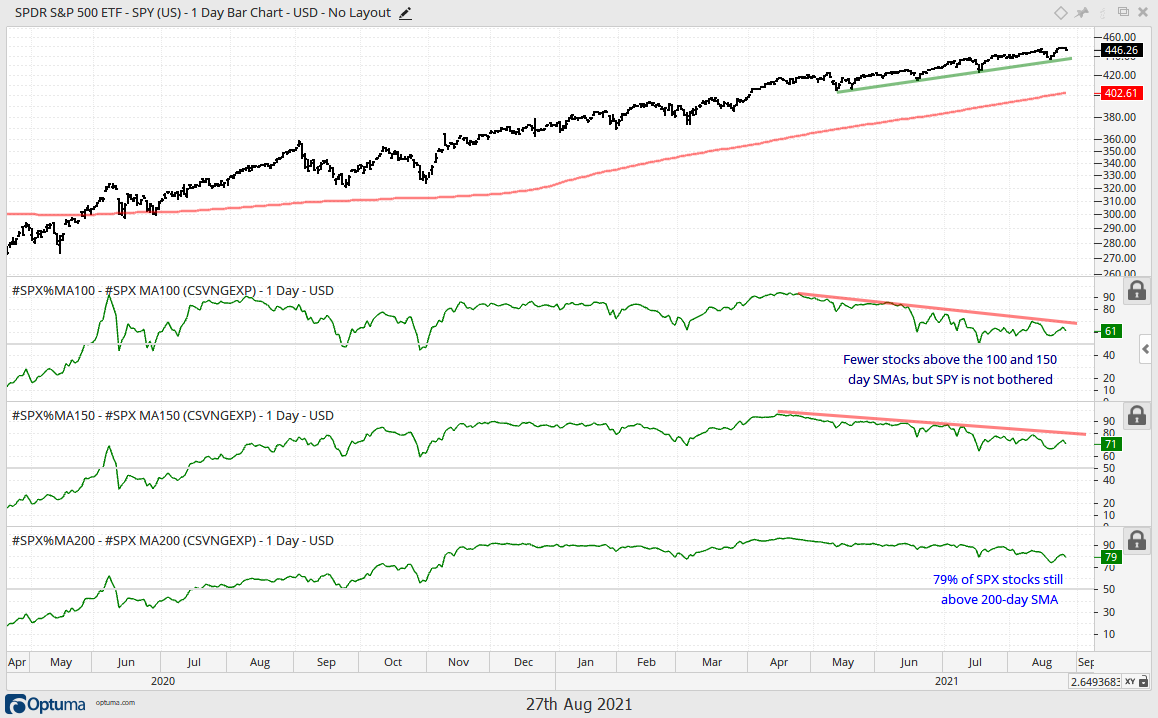
- Large-caps are strong with SPY, QQQ and the S&P 500 EW ETF (RSP) hitting new highs again this week.
- Small-caps (IWM) and micro-caps (IWC) bounced, but remain stuck in trading ranges that extend back to March. StochClose triggered bearish on July 19th and 20th, respectively.
- Of the 112 stock-related ETFs on the core chartlist, 65 (58%) are in uptrends and 47 (42%) are in downtrends (based on StochClose signals). This uptrend percent almost matches the percentage of S&P 500 stocks above the 100-day SMA (61%). Ten of the eleven sector SPDRs are in uptrends with XLE being the only downtrend.
- The Composite Breadth Model (CBM) remains bullish and has been bullish since May 2020 (see Market Regime page for charts covering the CBM, yield spreads and Fed balance sheet).
- AAA and BBB yield spreads narrowed this week. They remain narrow overall and there are no signs of serious stress at the investment grade end of the bond market.
- Junk bond and CCC spreads narrowed this week as oil bounced. Overall, spreads remain narrow and there are no signs of serious stress at the riskiest end of the bond market.
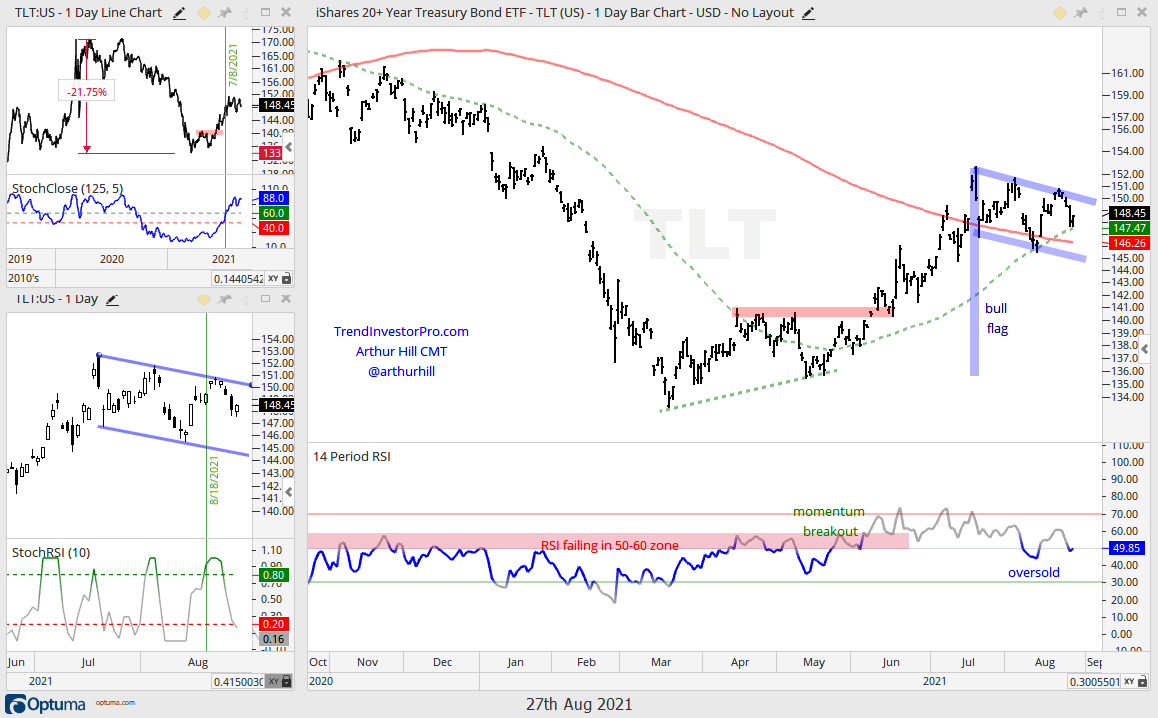
- StochClose turned bullish for TLT on July 8th and the ETF formed a bull flag the last six weeks.
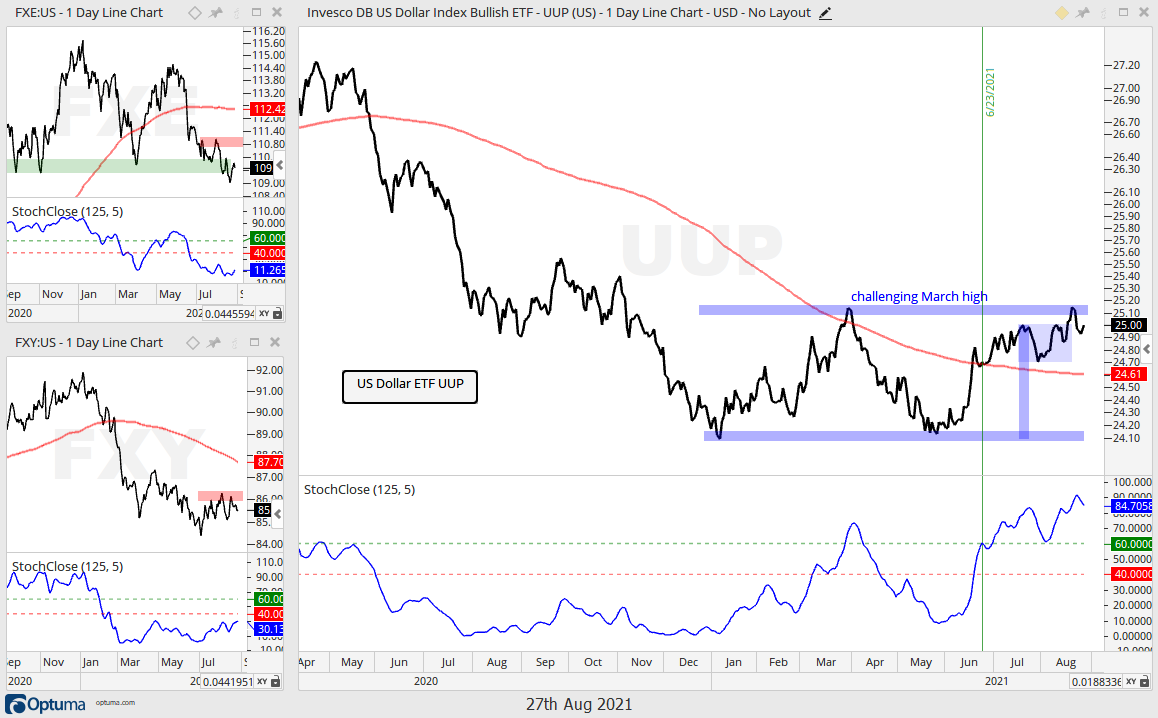
- The Dollar broke out of a 4-5 week consolidation and is challenging its March high as a big double bottom takes shape.
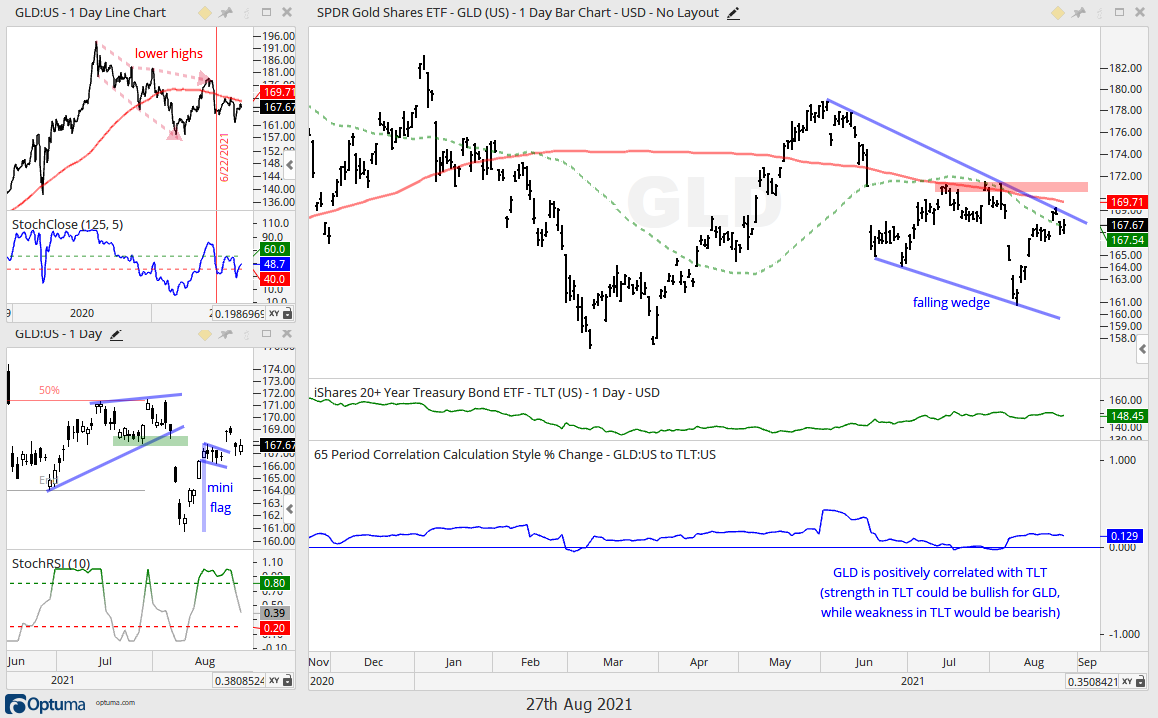
- Gold remains in a long-term and medium-term downtrend (falling wedge), but broke out of a small flag, and I do mean small.
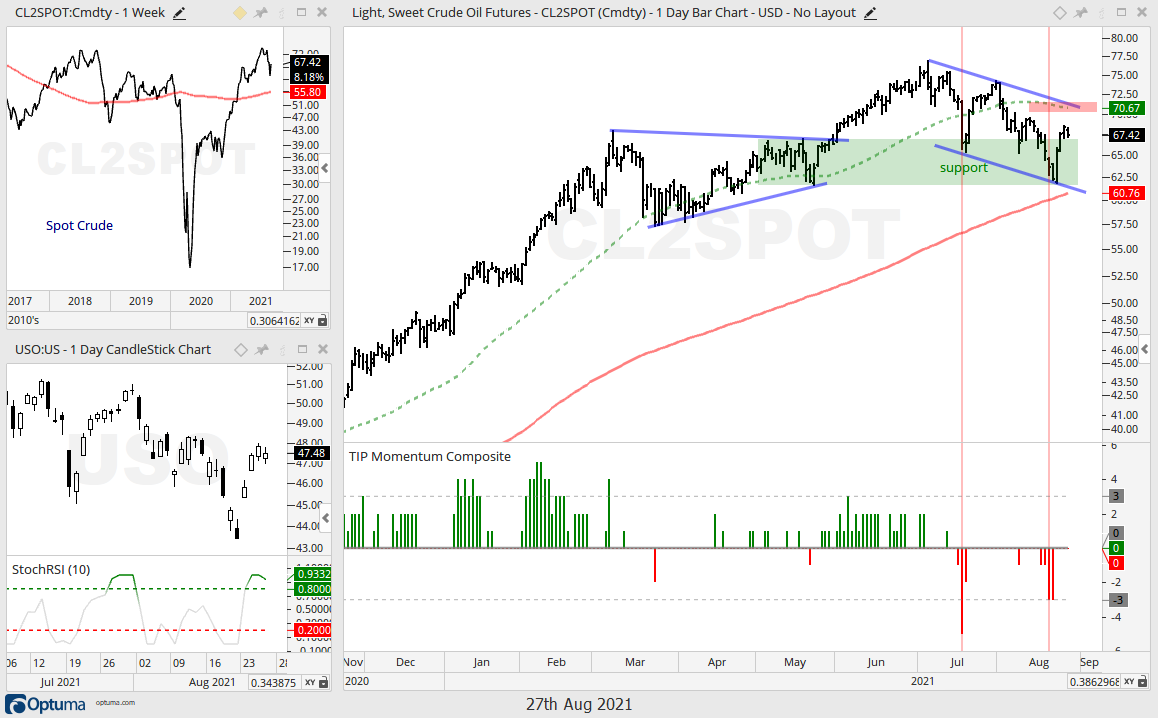
- Oil fell with a falling channel the last two months, but became oversold last week and got a strong oversold bounce this week.
- Seasonally, September is the weakest month of the year for the S&P 500, but price action remains strong for large-caps (click here for full report on seasonal patterns).
TLT Forms Bull Flag above 200-day
Jackson Hole is the talk of the town for the bond markets and the Dollar, which in turn affects gold, and perhaps oil. I do not have a read on the Fed and prefer to simply analyze the bond ETFs and Treasury yields. Moreover, the bond market tends to lead the Fed, not the other way around.
The 20+ Yr Treasury Bond ETF (TLT) is in a long-term uptrend as StochClose triggered bullish in early July and price moved above the 200-day SMA in mid July. After a strong advance from mid May to mid July, TLT corrected a little with a falling flag, which is typically a bullish continuation pattern. The ETF fell back this week as stocks surged, but the flag remains and I still consider it a bullish continuation pattern. Technically, the falling flag means the short-term trend is down until a breakout. RSI dipped into oversold territory in mid August and there was a StochRSI pop on August 18th. As such, expectations are for a flag breakout and continuation higher. A break below 145 would call for a re-evaluation.
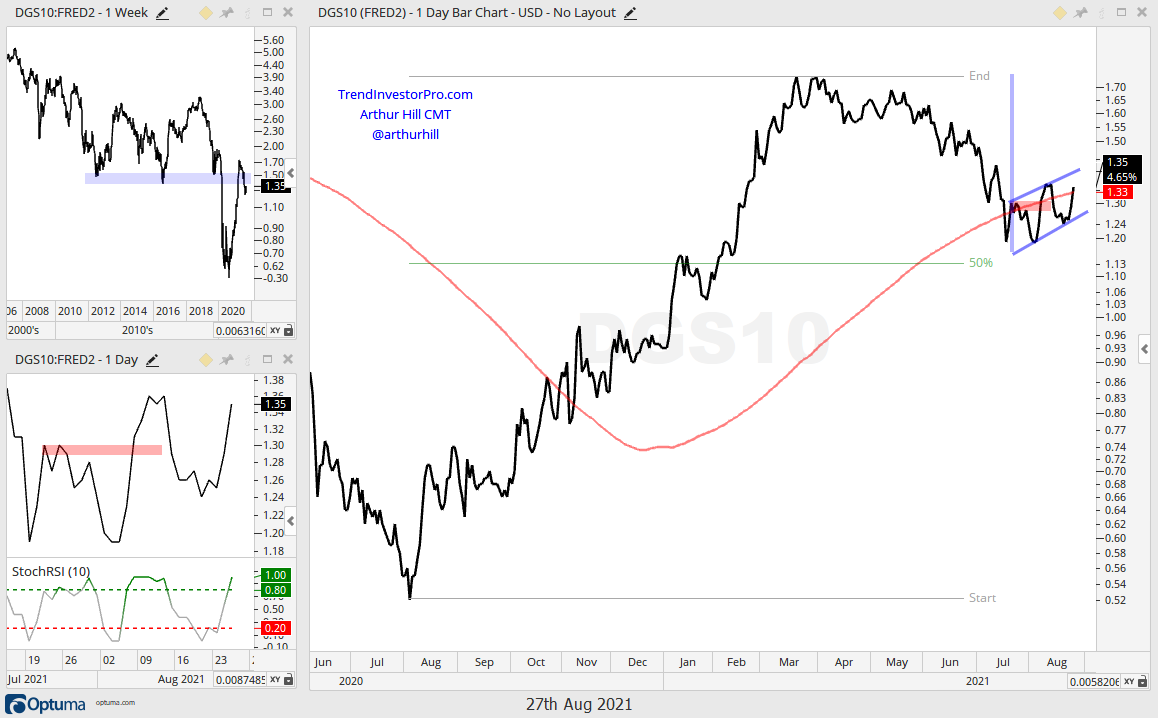
The 10-year Yield is pretty much a mirror image of the 20+ Yr Treasury Bond ETF (TLT) and 7-10 Yr Treasury Bond ETF (IEF). Bonds rise when yields fall and bonds fall when yields rise. Admittedly, the chart for the 10-yr Yield could certainly be viewed either way. Note that my bias flipped from bullish to bearish to bullish over the last three weeks as the yield gyrates around the 200-day SMA. Most by Jackson Hole related noise. This is a moment of truth that is lasting a month and we have the employment report next Friday. Ugh. With a surge back above the 200-day SMA this week, the 10-yr Yield is making an attempt to reverse near the 50% retracement line. The bounce over the last few weeks could be a bear flag and a break below 1.24 would argue for a move lower. The short-term bias is up as long as the flag rises.
Gold Remains in Long and Medium Term Downtrends
The long-term trend for the Gold SPDR (GLD) is down because StochClose turned bearish on June 22nd and price is below the falling 200-day. The medium-term trend is down with the falling wedge since mid June (bar chart). A move above 172 is needed to reverse the falling wedge and get back above the 200-day. On the candlestick chart, GLD broke out of a mini flag and then fell back to the breakout zone. This is a very short-term pattern. Chartists should also consider TLT and the Dollar. TLT is positively correlated with GLD, which means a flag breakout in TLT would be bullish for GLD. UUP is negatively correlated with GLD, which means a fall in the Dollar would be bullish for gold.
Dollar Challenges March High
The Dollar Bullish ETF (UUP) made a big move here in August with a flag breakout and a challenge to the March high. Short-term, the flag breakout is bullish. Long-term, a big double bottom formed in 2021 and the break above the March high would confirm the pattern. Note that StochClose turned bullish on June 23rd.
Oil Bounces within Correction
Oil hit a new high in early July and then fell back towards the rising 200-day the last seven weeks. Oil hit a support zone marked by the prior triangle consolidation and the Momentum Composite became oversold last Thursday-Friday by hitting -3. The combination of support and oversold conditions gave way to an 8.18% bounce this week as oil moved back above 67. The trend since July is down, but the falling channel looks like a correction within a bigger uptrend. A breakout at 71 would reverse this fall and signal a continuation higher.