")
Rotation Investor ETF – Strategy Details, Indicators, Universe, Signals, Tables
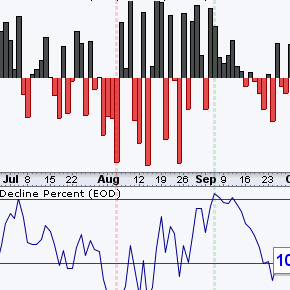
RO-Investor-ETF is momentum rotation strategy that trades an all-weather ETF universe in bull markets and bear markets. This strategy starts with a breadth model for stock market timing. The strategy favors equity ETFs in bull markets, and bond ETFs in bear markets. With commodity and crypto ETFs in the universe, there is almost always a bull market somewhere. This report covers the trend indicator, the volatility condition, the ETF universe, the ranking indicator and the rotation rules. We also explain the signal/portfolio page and the ranking table.
Rotation Investor ETF – Strategy Details, Indicators, Universe, Signals, Tables Read More »