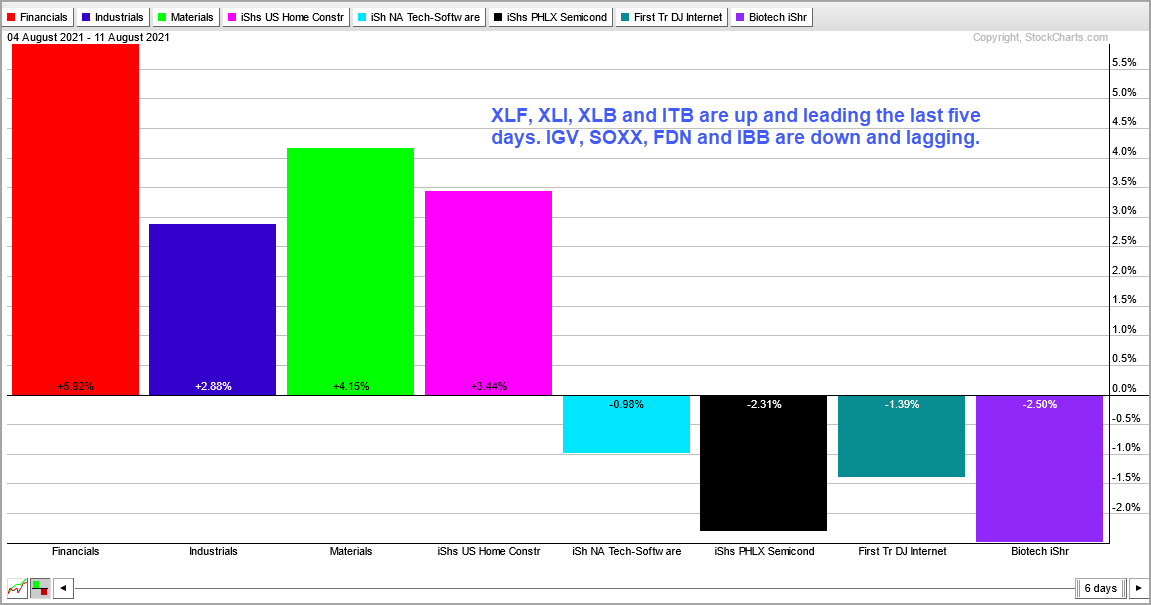
Signs of rotation kicked in with a big surge in the 10-yr yield and the rotations continued over the past week. We are seeing leadership from the groups that lagged from May to July. These are ETFs related to finance, industrials, materials and housing. ETFs related to tech and healthcare led the market from May to July and these groups could be poised for a rest. A rest or correction in the May-July leaders and trend-resumption breakouts in the May-July laggards means the broader market will be fine. In fact, we are seeing the equal-weight and mid-cap ETFs go for breakouts, while the small-cap ETFs bounce off range support.
The tweet below comes from @LoneStockTrader:
No matter what your strategy is, a good process should always put you in a position to let the trade come to you instead of looking for it.
These are words of great wisdom. Don’t force the shot when you don’t have to. There is no shot clock so we can be patient and wait for our preferred setups. There were setups in mid May for some tech-related ETFs, a nice wedge in IHI in mid June and then wedges galore in mid July. Currently, I do not see setups in XLK, QQQ, IGV, XLV, IBB and IHI right now and it may be some time before these set up again. The July setups led to breakouts and these are mostly in the trend-monitoring phase right now.
You can learn more about my chart strategy in this article covering the different timeframes, chart settings, StochClose, RSI and StochRSI.
SPY Grinds to Yet Another New High
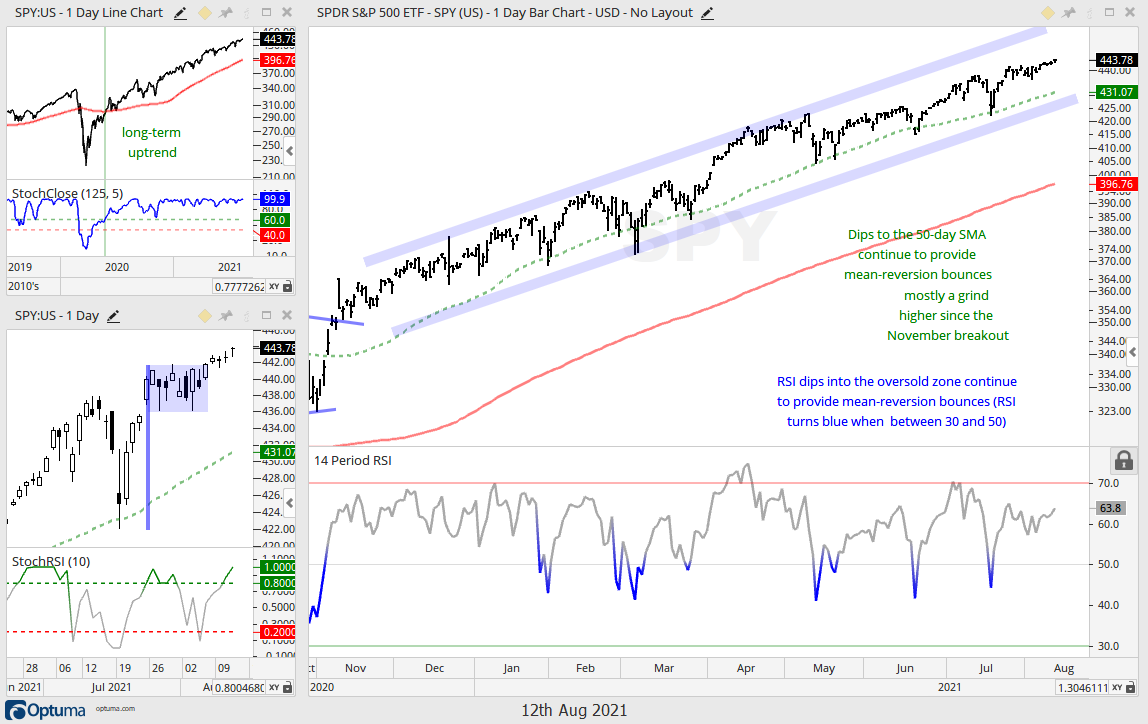
Large-caps continue to lead with the S&P 500 SPDR (SPY) hitting another new high this week. Overall, the key benchmark has been grinding higher since the early November surge and shows no signs of letting up. Short-term, SPY broke out of a flag four days ago and this breakout is holding (see candlestick chart lower left). And that’s all I have to say about that.
Equal-weights and Mid-caps Get Breakouts
The average stock in the S&P 500 was dragging its feet as the S&P 500 EW ETF (RSP) consolidated from May to July. This changed over the last few weeks as RSP broke out of this consolidation and hit new highs the last two weeks. ETFs related to industrials, materials and finance were lagging from May to July, but they turned up the last few weeks and pushed RSP to new highs. This means upside participation within the S&P 500 is broadening.
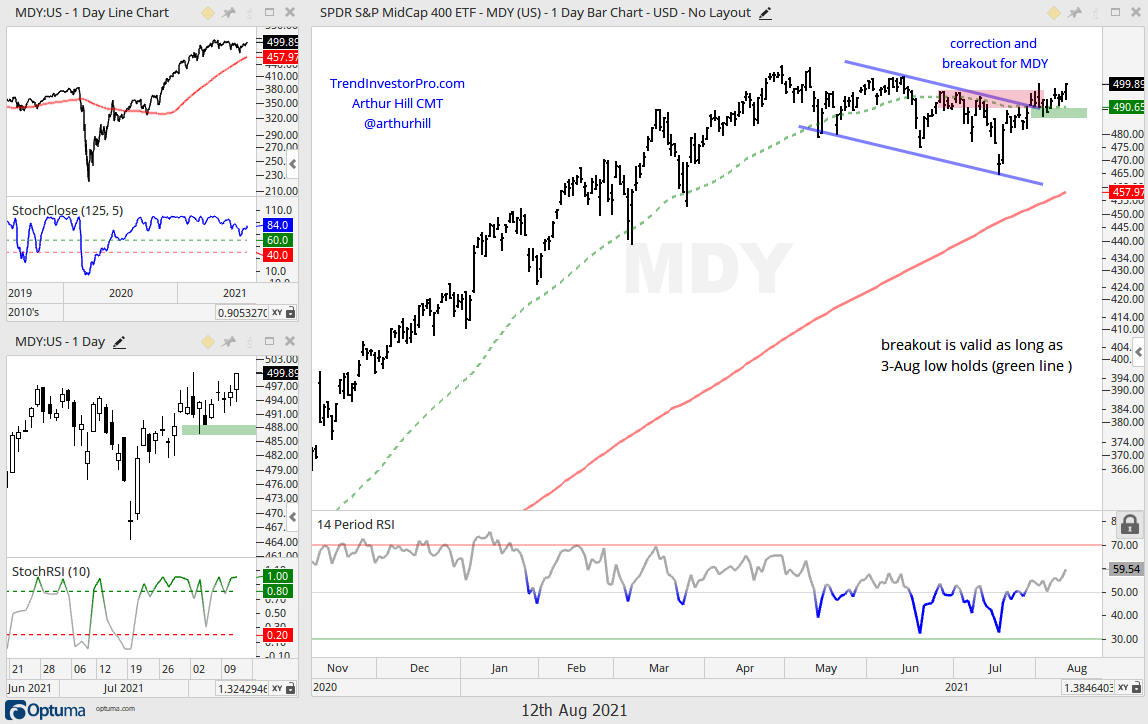
The S&P MidCap 400 SPDR (MDY) is also getting in on the action with a falling channel correction and a breakout over the last two weeks. A falling channel after a new high is deemed a correction within the bigger uptrend. MDY held well above the rising 200-day in July and the channel breakout signals an end to this correction (resumption of the bigger uptrend). This also suggests that the advance is broadening.
IWM Bounces within Trading Range
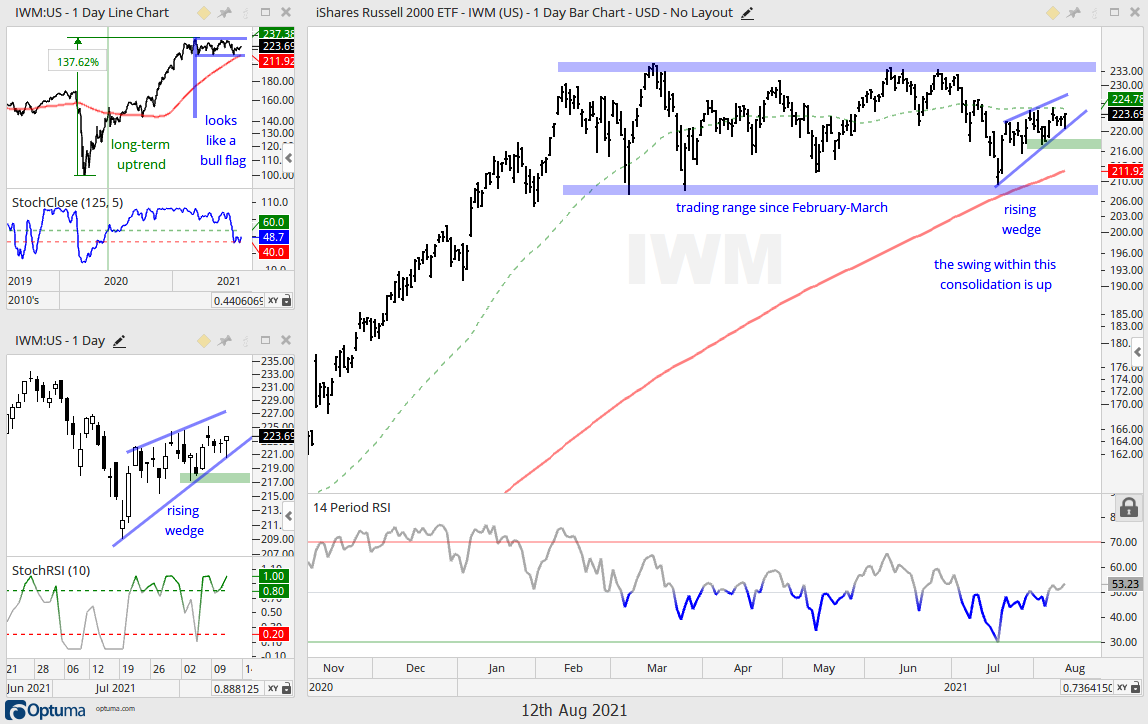
The Russell 2000 ETF (IWM) is also partaking in the market bounce over the last few weeks. IWM held the March lows and advanced towards the rising 50-day SMA, and the middle of its six month range. The swing within this range is up as long as the wedge rises and this favors a range breakout (new high). Why? Because IWM is above its rising 200-day SMA and the six month trading range looks like a massive consolidation within an uptrend on the line chart (upper left). Yes, a long-term bullish continuation pattern. Last week’s low marks wedge support at 217. A break here would reverse the upswing within the big range.
There are dozens of channels and wedges that formed between May and July, and I am going to start with these first. The second section will cover the ETFs with big moves from May to August. These ETFs are technically leading, but I do not see bullish setups and they are in the trend-monitoring phase. There are also dozens of wedge/channel breakouts the last few weeks. After a big advance, a falling channel or wedge represents a correction within a bigger uptrend. It is a bullish continuation pattern that retraces between one third and two thirds of the prior advance. Some corrections are shallow (1/3) and some are deep (2/3). We never know the exact path, but the pattern is still a correction within a bigger uptrend, which is what really matters. A breakout reverses the falling channel/wedge and signals a continuation of the bigger uptrend.
You can learn more about falling wedge patterns in this video.
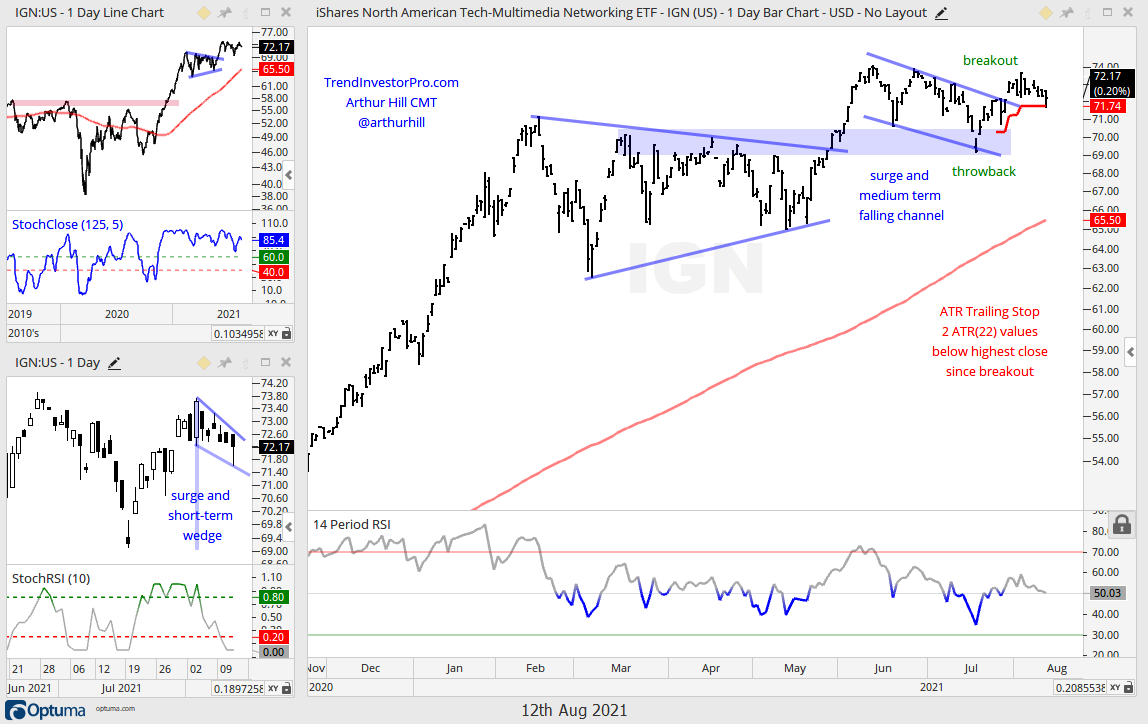
The Networking ETF (IGN) chart shows the fractal nature of technical analysis. The patterns are roughly the same for bar and candlestick charts, but the timeframes are different. The bar chart shows a surge in May-June, a falling channel into July and a breakout in late July. The candlestick chart shows a two week surge and six day falling wedge, which is a short-term bullish continuation pattern. A breakout at 73 would reverse this wedge and signal a continuation higher.
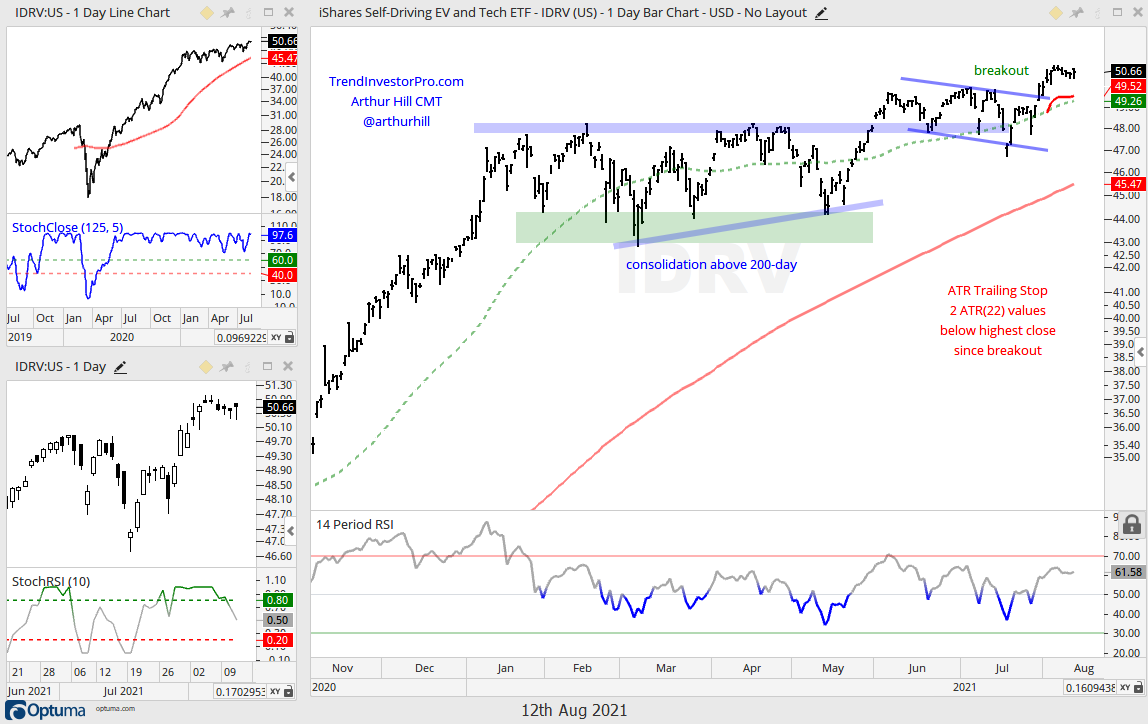
Of the three EV ETFs, the Autonomous EV ETF (DRIV) is the strongest because it hit a new high Wednesday, the Self-Driving EV Tech ETF (IDRV) is second because it hit a new high last week and the Global Auto ETF (CARZ) is a close third because it remains just below its June high. All three broke out of falling channel patterns in late July.
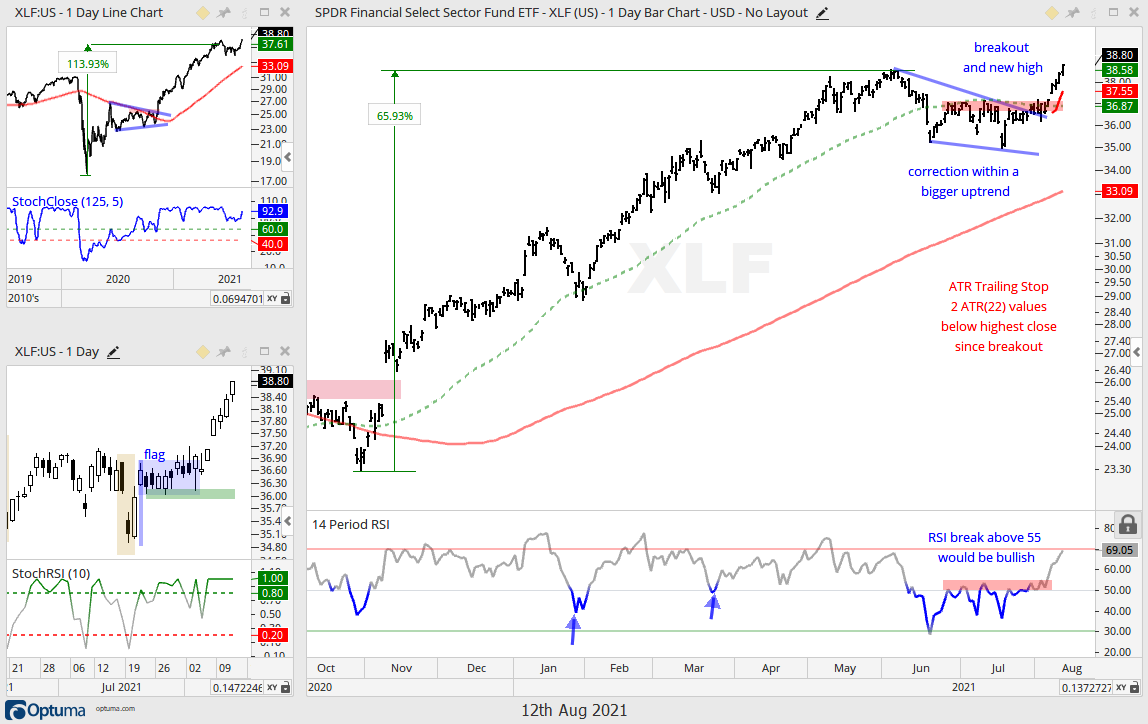
The Finance SPDR (XLF) broke out of a flag on August 3rd (candlestick chart) and a falling wedge a few days later (bar chart). The ETF caught fire the last five days with a market leading surge led by insurance and banks. XLF is still the fourth biggest sector in the S&P 500 (11.5%). Thus, this breakout and new high bode well for the broader market.
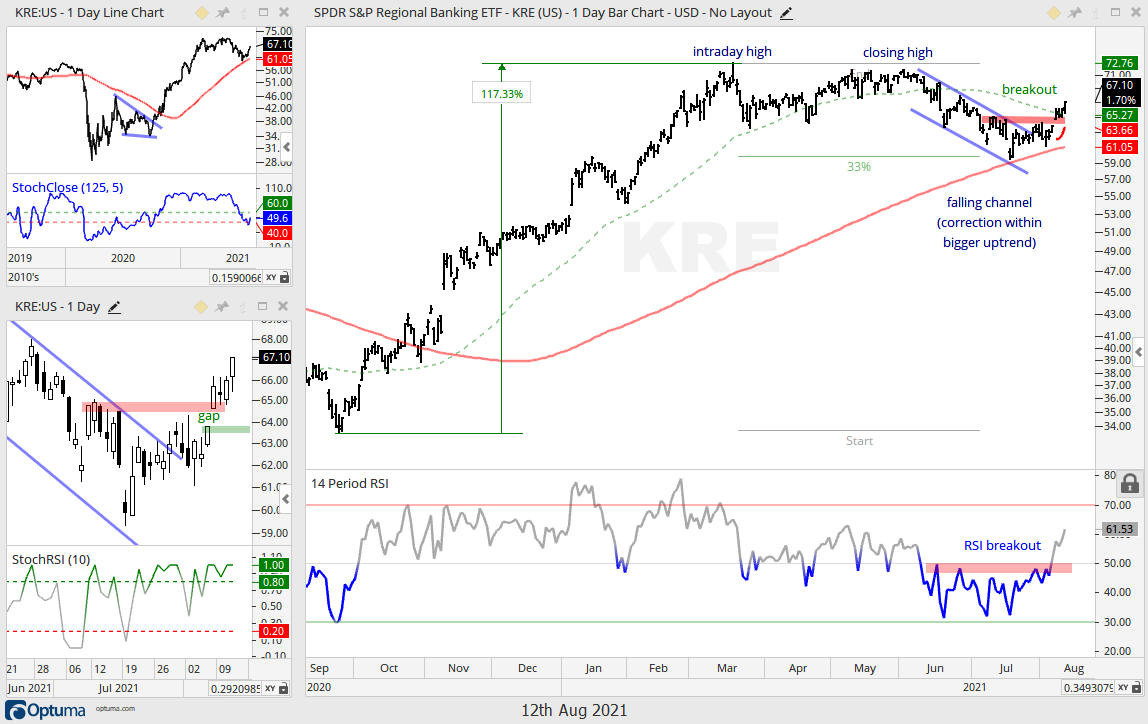
I am keeping the Bank SPDR (KBE) and Regional Bank ETF (KRE) with the Finance SPDR (XLF), but these two are not as strong because they have yet to hit new highs. Nevertheless, I expect them to hit new highs because they also broke out of falling channel patterns with breakaway gaps on August 6th. The chart below shows KRE with a gap breakout on the price chart and an momentum breakout in RSI. The breakout zone and gap turn first support to watch should there be a throwback. A close below the August 5th close would fill the gap and call for a re-evaluation.
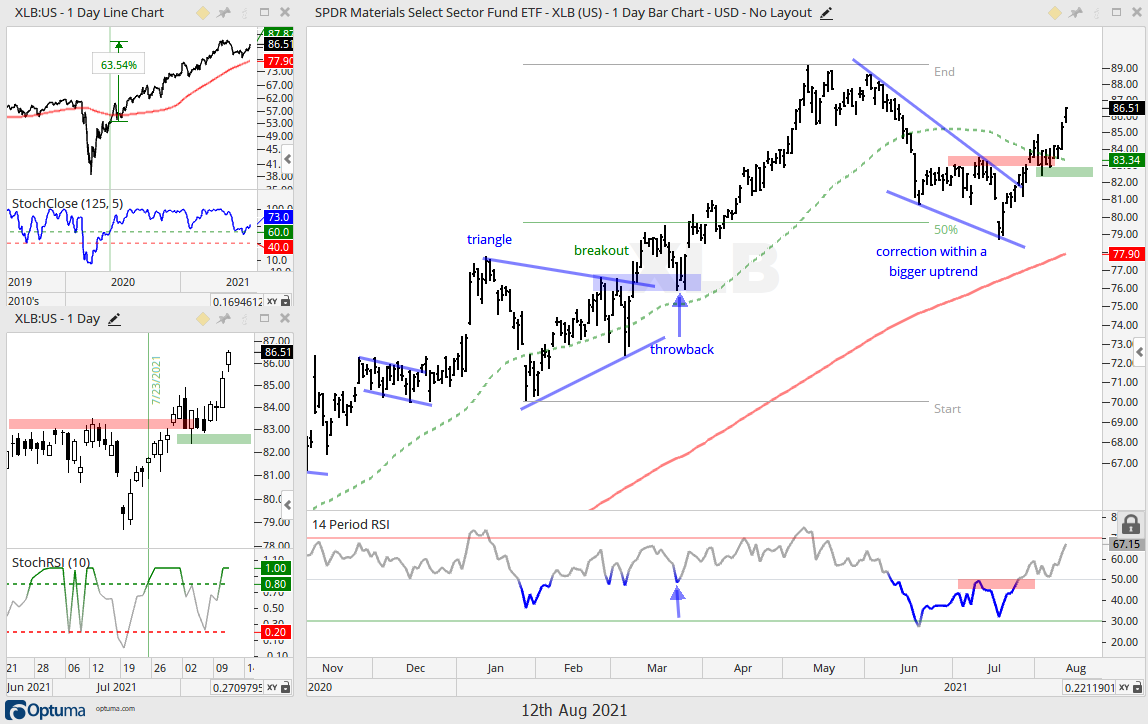
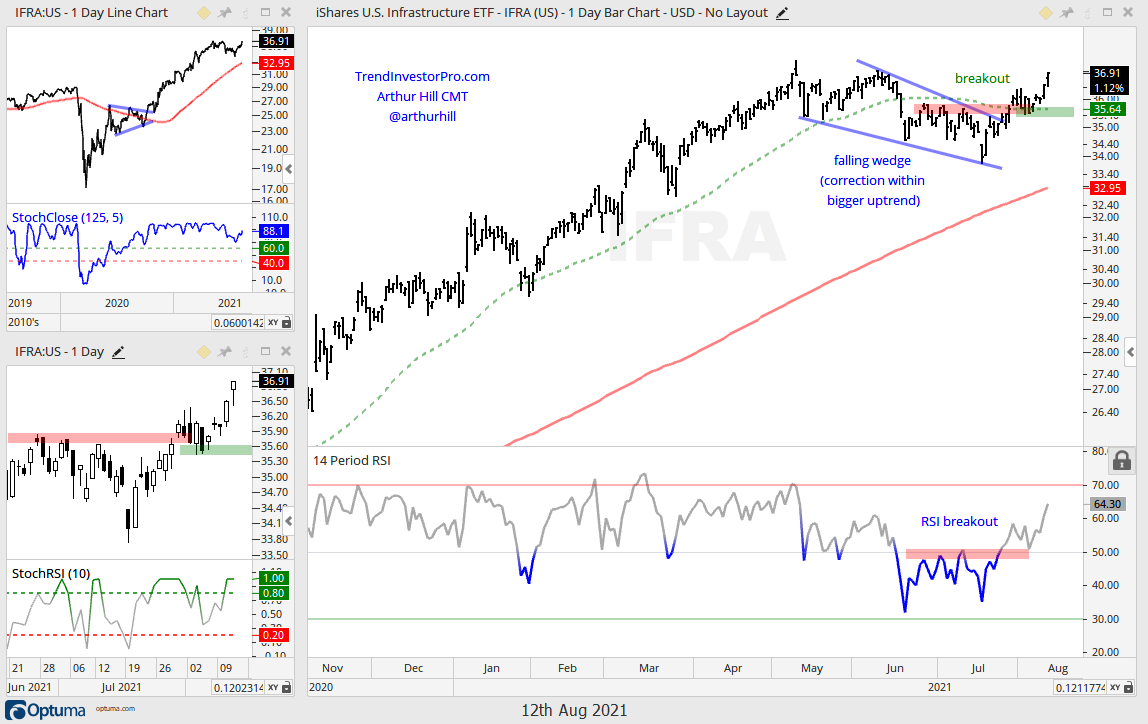
The Industrials SPDR (XLI) and Materials SPDR (XLB) are as old economy as it gets. Think infrastructure, building materials, metals, chemicals and steel. These two, along with the Infrastructure ETF (IFRA) and Global Infrastructure ETF (PAVE), hit new highs in May, corrected with falling wedges into July and broke out over the last few weeks. There is clearly a theme at work here in the market. The chart below shows XLB with a falling wedge correction that retraced 50%. There was a StochRSI pop on the candlestick chart (23-July) and a wedge breakout in late July. XLB surged the last four days for a strong follow through and a new high is expected. The August 3rd low marks support near the breakout and a close below this level would call for a re-evaluation. The second chart shows IFRA with similar characteristics.
May-July Wedge/Channel, late July Breakout, Strong Follow Thru
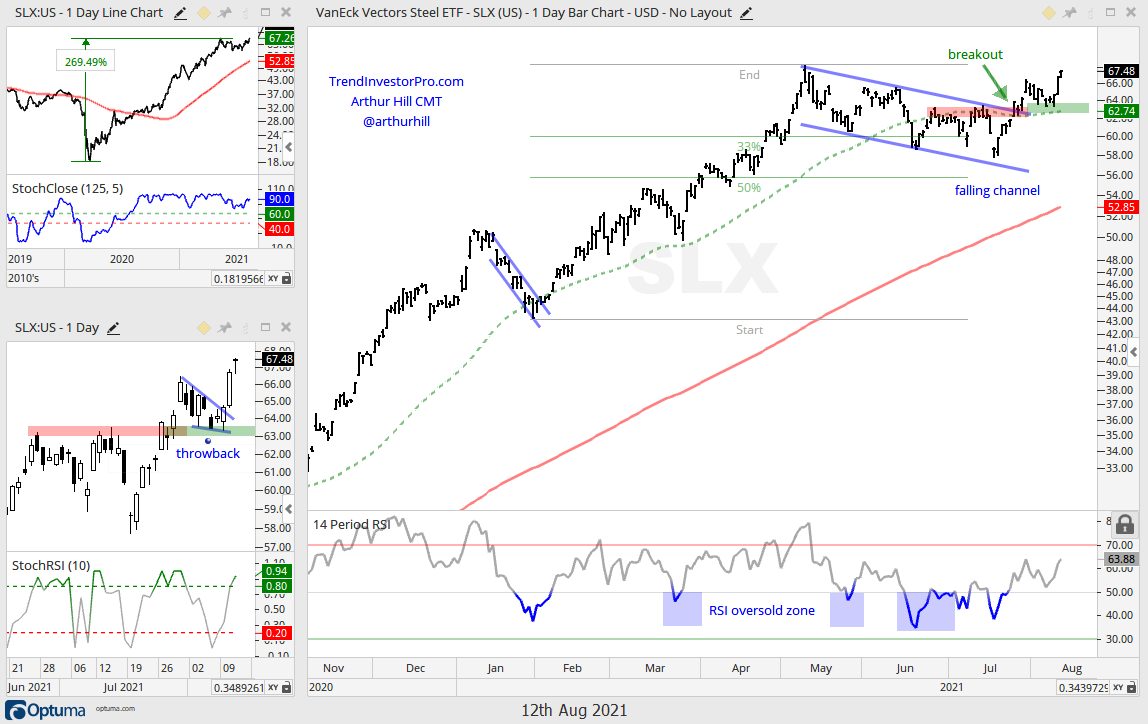
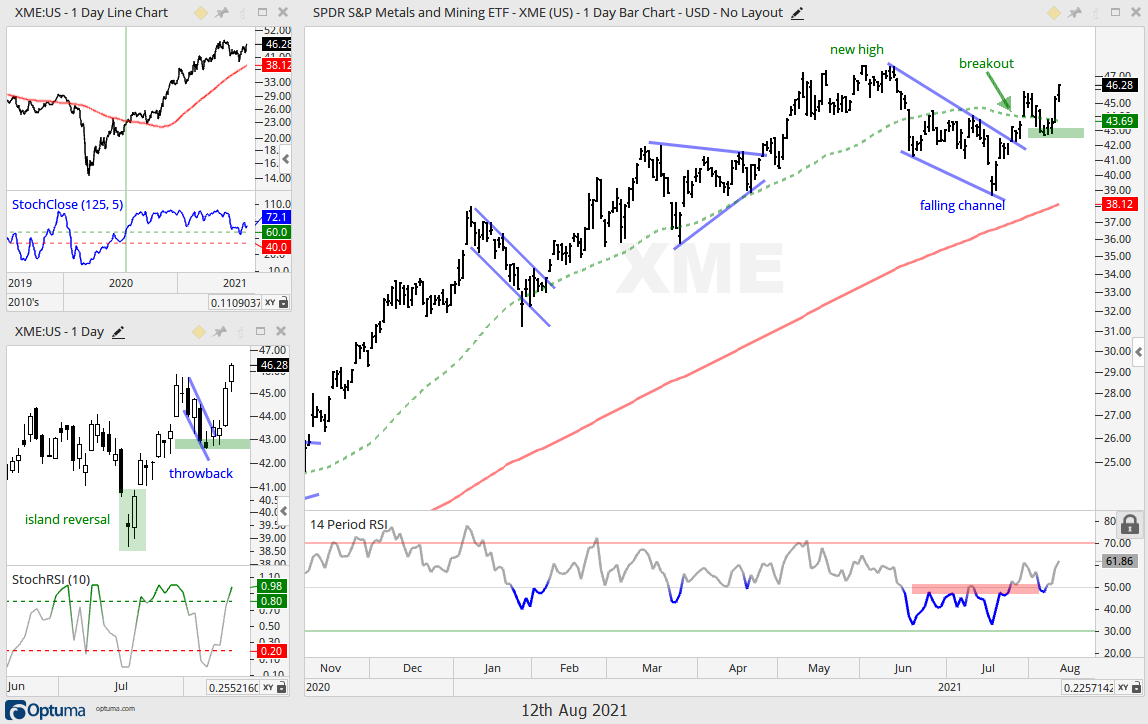
SLX, XME
Speaking of hard materials, the Steel ETF (SLX) and Metals & Mining SPDR (XME) also broke out in late July and continued higher this week. The trends, setups, patterns and breakouts are similar to the ETFs above so there is not much to add. The charts below show SLX and XME with corrections and breakouts. I removed the ATR Trailing Stops because sometimes there is a clear support level to watch going forward and I prefer to allow a little more wiggle room. SLX and XME broke out, fell back to the breakout zones and bounced this week. This week’s lows mark support and a close below these lows would warrant a re-evaluation.
May-July Wedge, late July Breakout, Strong Follow Thru
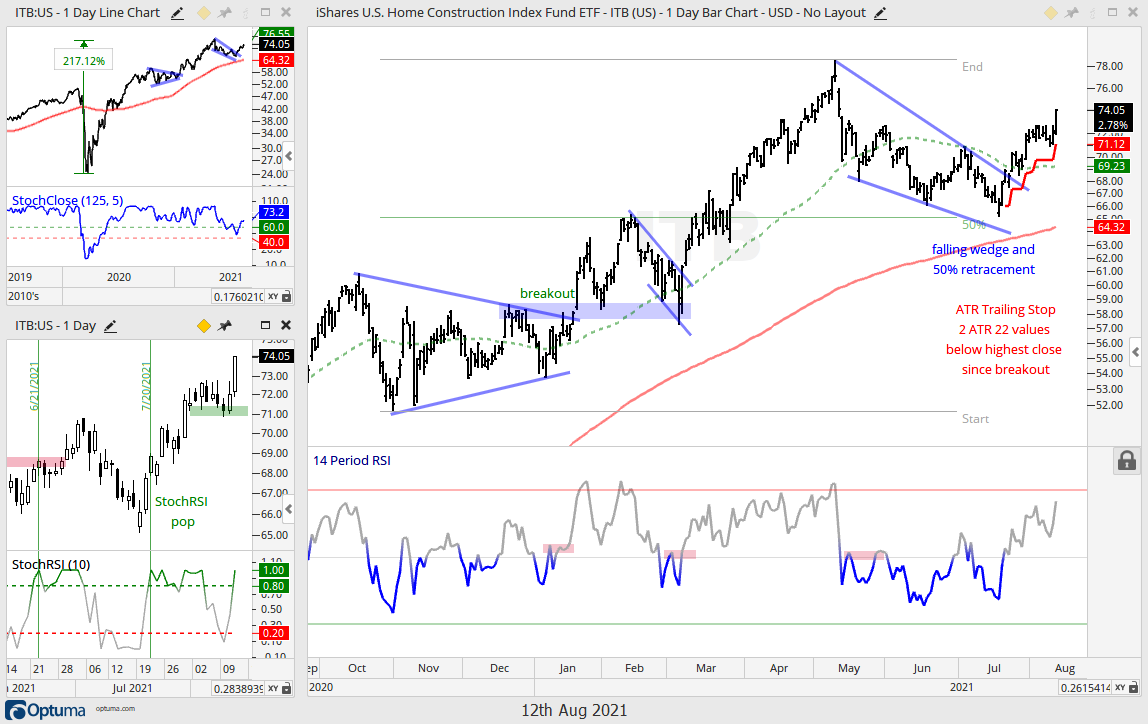
ITB, XHB
The Home Construction ETF (ITB) and Homebuilders ETF (XHB) are very similar in make-up and both sport similar patterns: new highs, steep falling wedges, breakouts and strong follow through. These are in the trend-monitoring phase because they are up over 5% since their StochRSI pops and wedge breakouts. The trend-monitoring phase means it is time to manage the position and consider your exit options. Short-term traders may consider a profit target for half the position and a trailing stop for the rest. Longer term players may be using these bullish continuation patterns to accumulate during a bigger uptrend and exit when the long-term trend reverses. Plan the trade first and then trade according to that plan! Don’t change your shot in mid air, unless, of course, your are MJ.
May-July Wedge, late July/early Aug Breakout
COPX, DBB, CPER
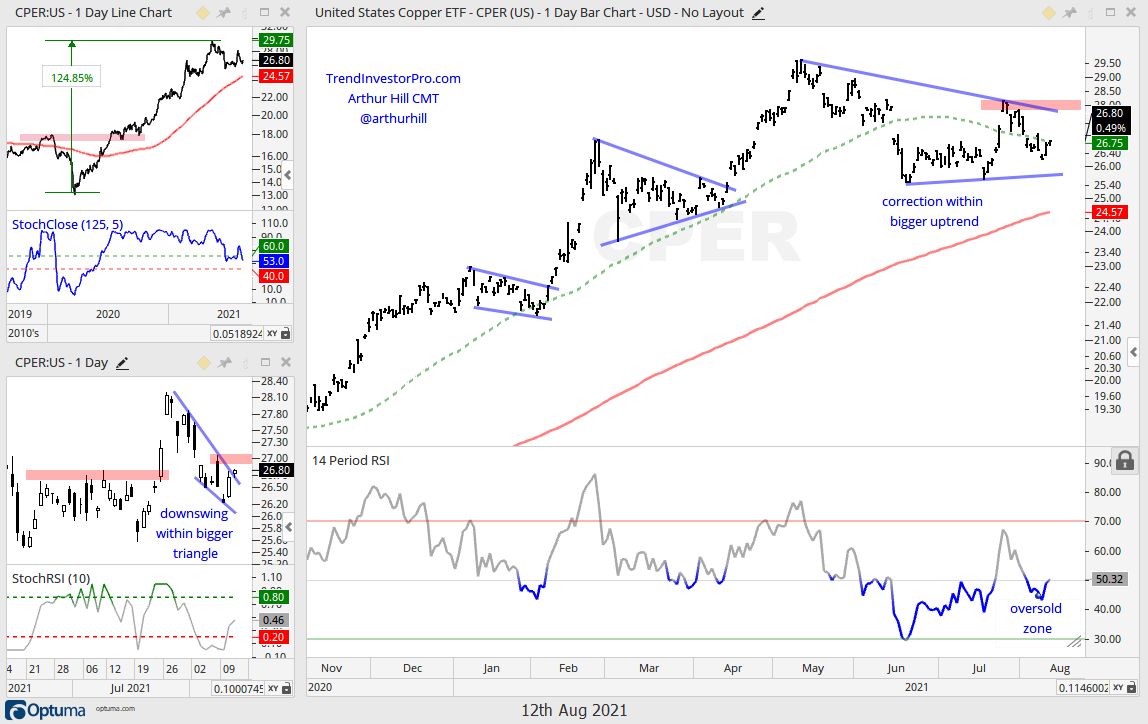
Before we get to the wedge breakout in the Copper Miners ETF (COPX), I would like to highlight the triangles in the Copper ETF (CPER) and DB Base Metals ETF (DBB). All three are in long-term uptrends with new highs in May and prices remain above the rising 200-day SMAs. The first chart shows CPER with a surge above 28 in late July and quick drop back below the 50-day. Filtering out the short-term noise, the developing pattern looks like a triangle consolidation, which is a bullish continuation pattern. A break above the late July high would be bullish and open the door to new highs. The candlestick chart (lower left) captures the downswing within the triangle. A break above 27.10 would be short-term bullish and increase the chances of a bigger triangle breakout. Click here to check prices for Sept 2021 Copper Futures at the CME.
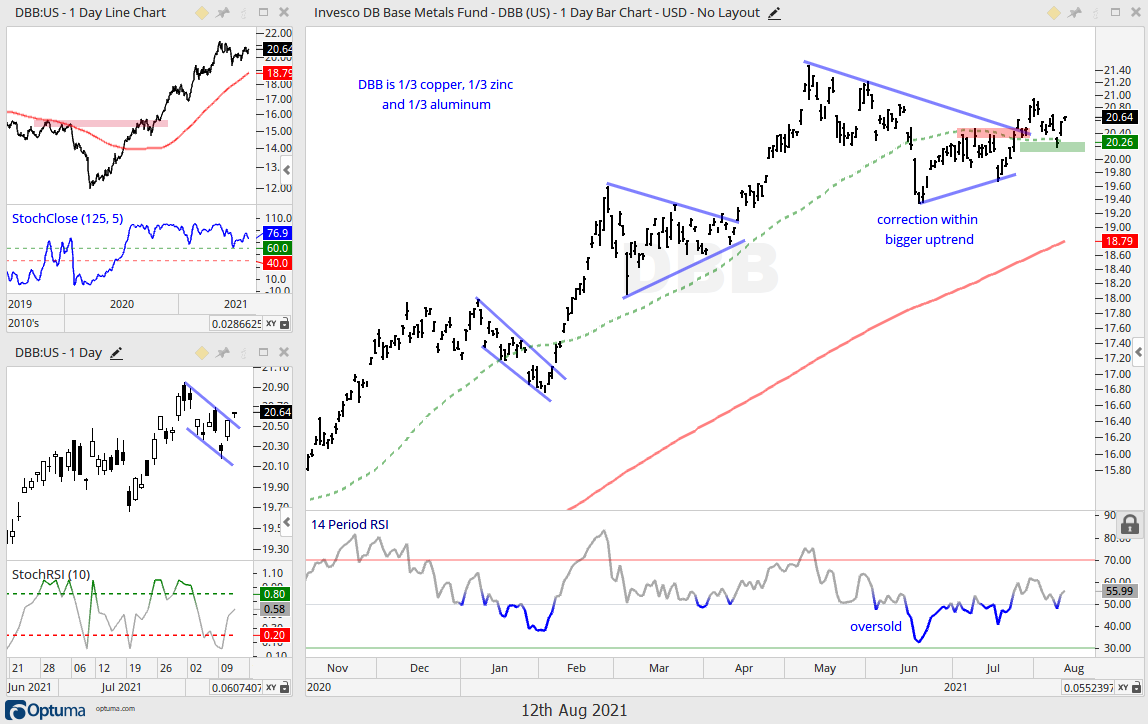
The next chart shows the DB Base Metals ETF (DBB), which is equal parts (1/3) copper, aluminum and zinc. DBB also sports a triangle and the ETF broke out with a surge in late July. DBB fell back to the breakout zone and 50-day SMA Monday and then bounced on Tuesday-Wednesday. The breakout is bullish and holding. A close below 20.10 would call for a re-evaluation.
And now for the Copper Miners ETF (COPX), which sports a falling wedge and breakout. COPX more than doubled from late October to May and then fell over 20% from the May closing high to the July closing low. Big advances give way to big corrections. COPX broke out with a surge into late July, fell back and then bounced the last two days. This breakout is holding and bullish as long as this week’s low holds.
You can learn more about ATR Trailing stops in this post, which includes a video and charting option for everyone.
May-July Wedge, late July/early Aug Breakout
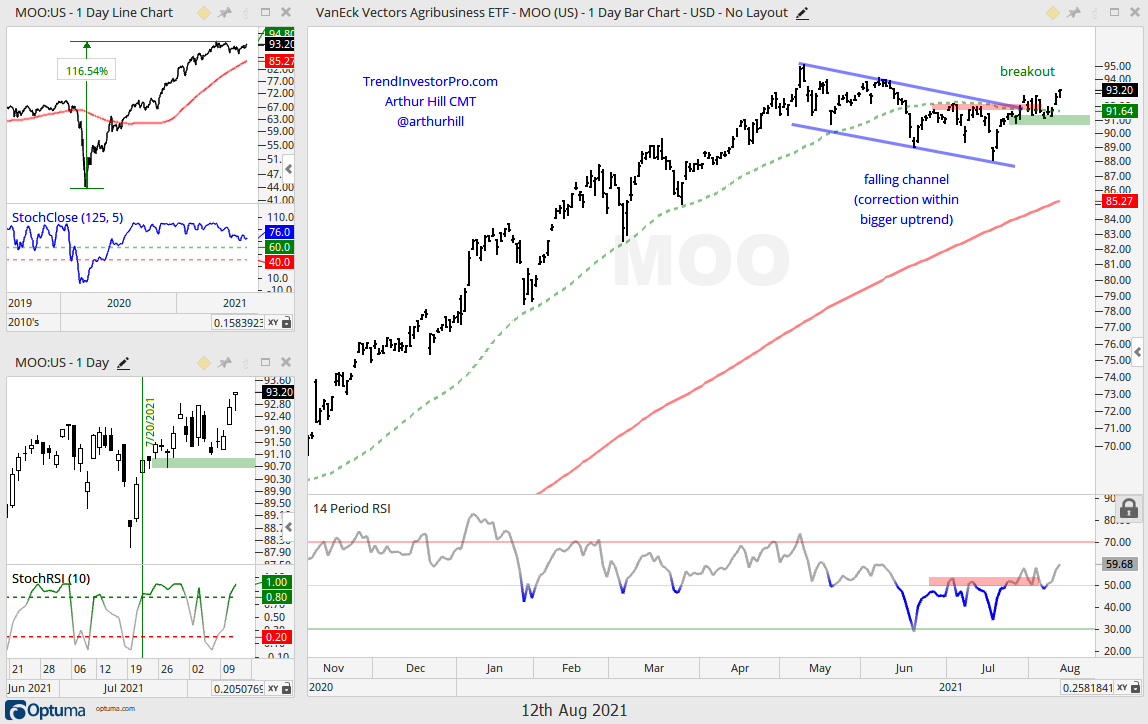
DBA, MOO
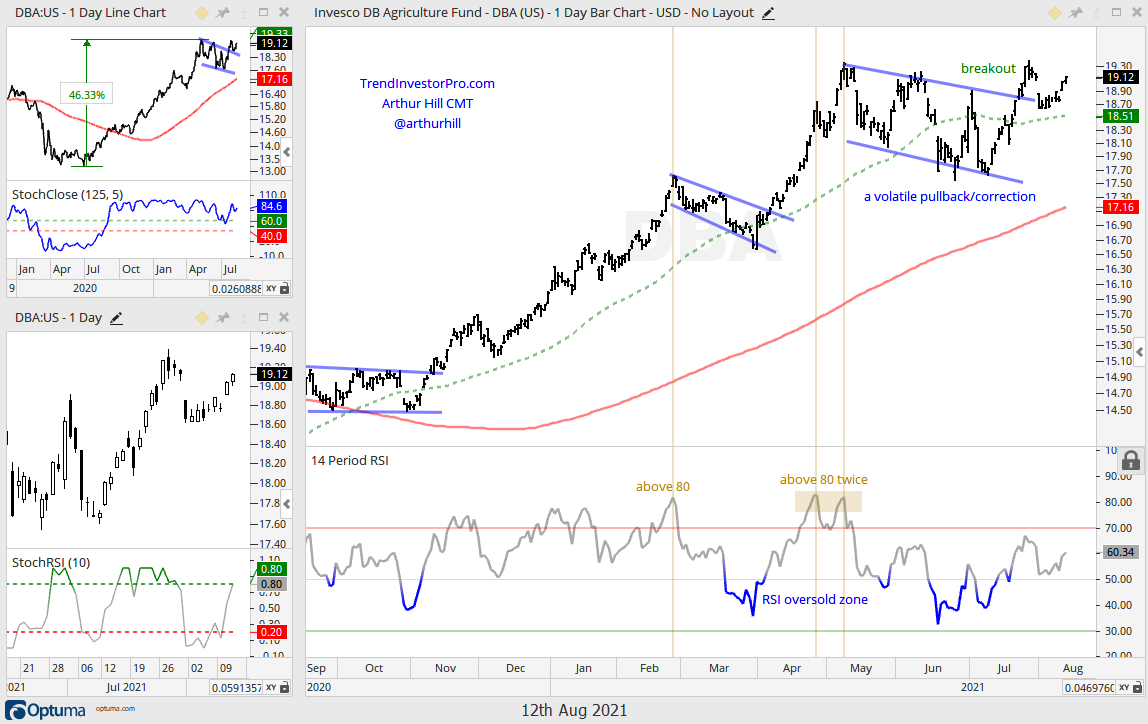
I would like to think that the DB Agriculture ETF (DBA) and Agribusiness ETF (MOO) are related and positively correlated. A quick look shows that these two are indeed positively correlated for the most part, which means an uptrend in DBA should be positive for MOO. DBA became way overbought in late April and early May with RSI readings above 80. The ETF then corrected with a volatile falling channel (big swings). Regardless of volatility, it is a falling channel after a big advance and this makes it a correction within an uptrend (bullish continuation pattern). DBA is breaking out and looks set to continue higher. The next chart shows MOO with a channel breakout as well.
Support Bounce, Short-term Reversal mid July, No Follow Thru
XLE, XES, XOP
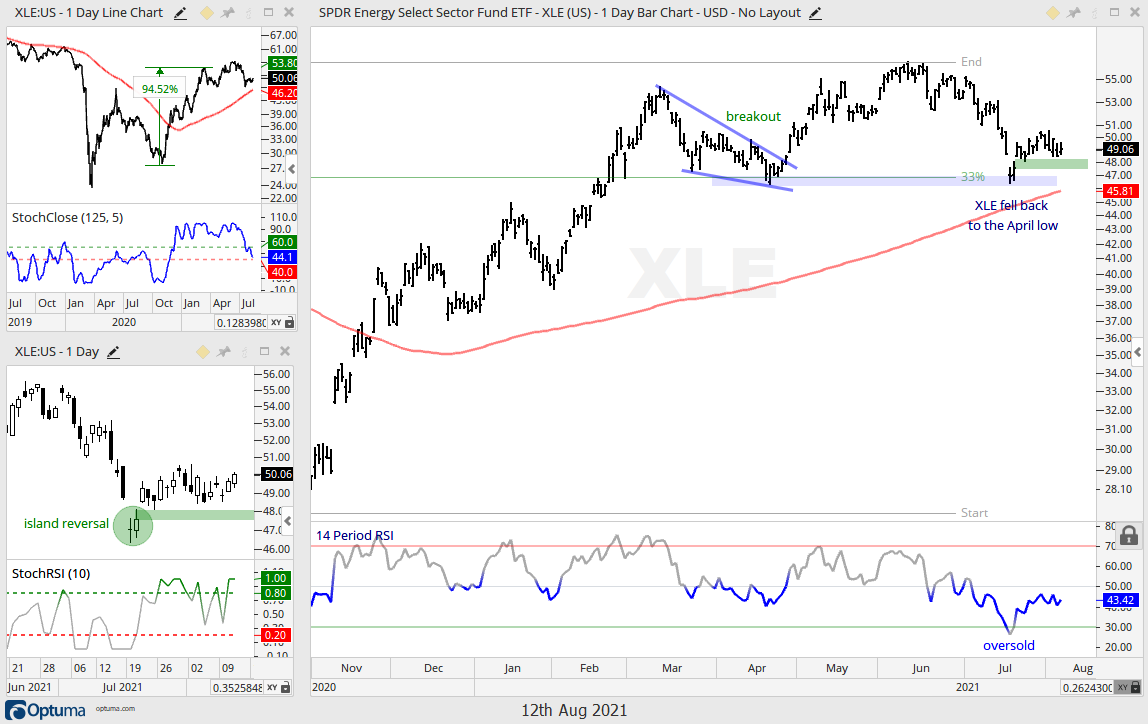
ETFs related to the industrials and materials sectors led the market over the last few weeks, but ETFs related to energy did not participate. Seems that the Energy SPDR (XLE) and Oil & Gas Equipment & Services ETF (XES) would be related to these old economy groups. Their underperformance the last two to three weeks is a negative. At the very least, there are better looking charts out there right now. The first chart shows XLE hitting a new high in June and then falling all the way back to the April low. There was an exhaustion gap down on July 19th and then a gap up two days later to forge an island reversal. XLE attempted to follow through, but stumbled and post reversal price action is not inspiring.
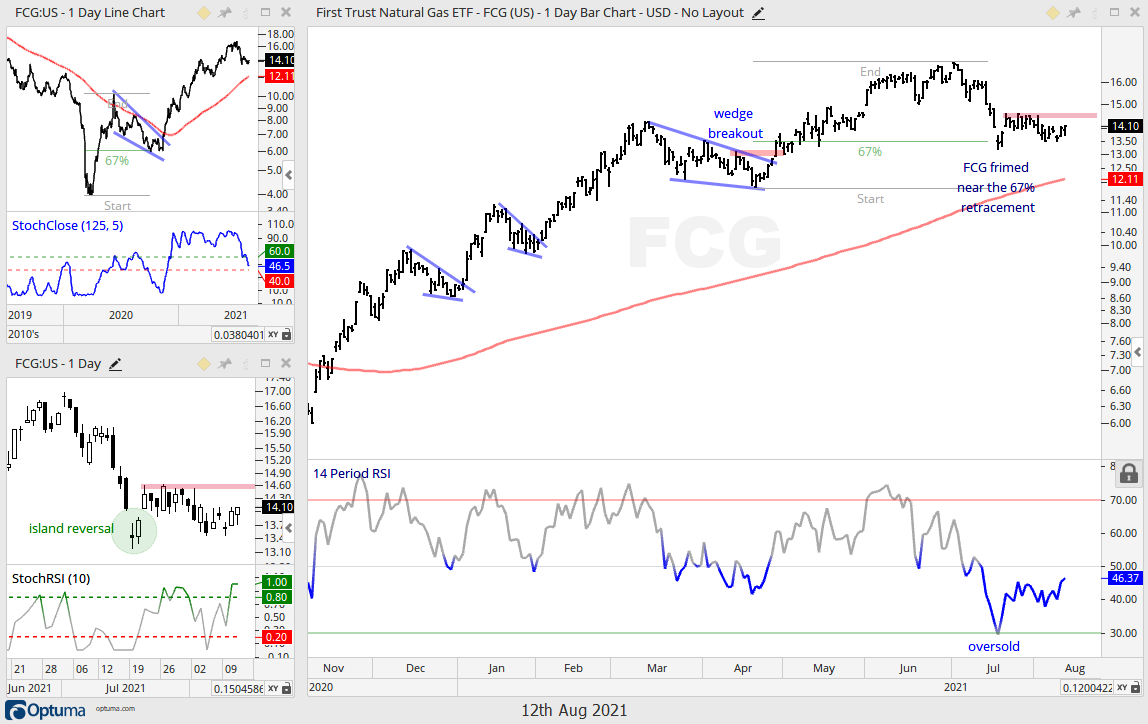
The Oil & Gas Equipment & Services ETF tested its April low and the Oil & Gas Exploration & Production ETF (XOP) held just above its April low so it is slightly stronger. These two charts are not shown. The next chart shows the Natural Gas ETF (FCG) firming near the 67% retracement line and well above the April low. This one is clearly the strongest of the group. A break above the late July highs would be bullish.
ETFs in the groups below are leading the market over the last few months with new highs and strong moves. They are in clear uptrends, but most are quite extended after big moves and I do not see bullish setups right now (except maybe an oversold condition in FDN and a bull flag in FIVG). The tech-related ETFs could be vulnerable to a rotation within the broader market as we see ETFs related to finance, industrials and materials breaking out. This does not mean I am bearish on the tech related ETFs. It just means I do not see any setups and will wait for the next setup. It could be days, weeks or months. You never know.
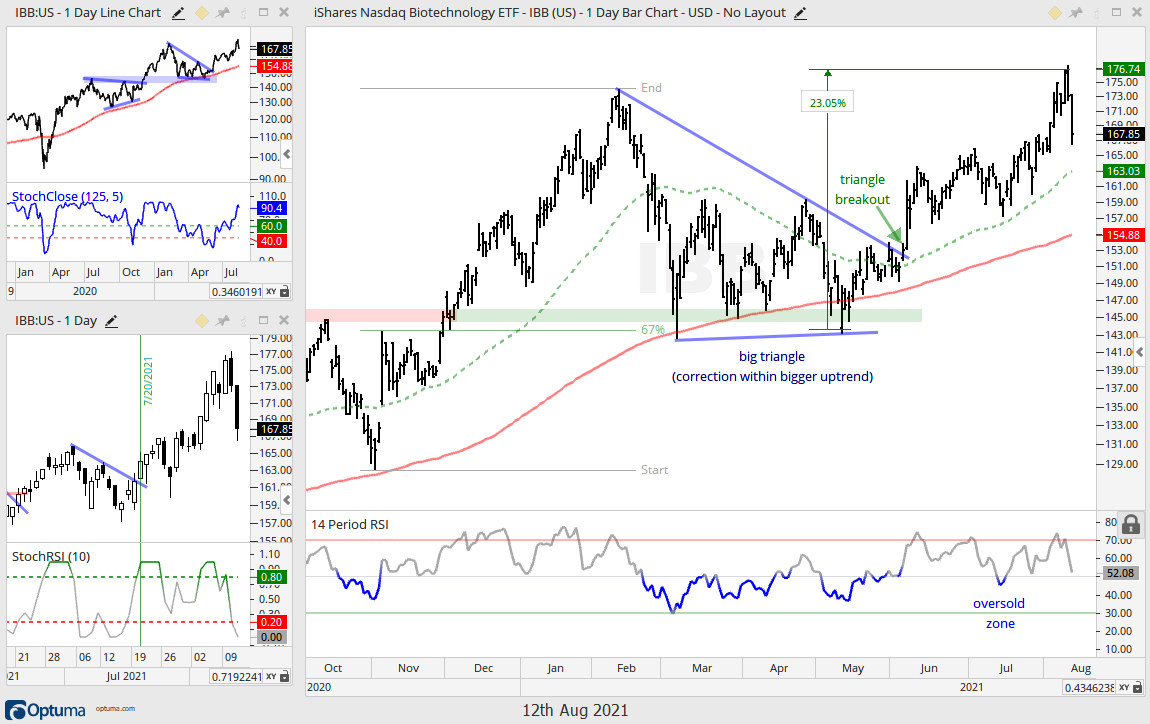
Not Entirely Unexpected Price Action from IBB
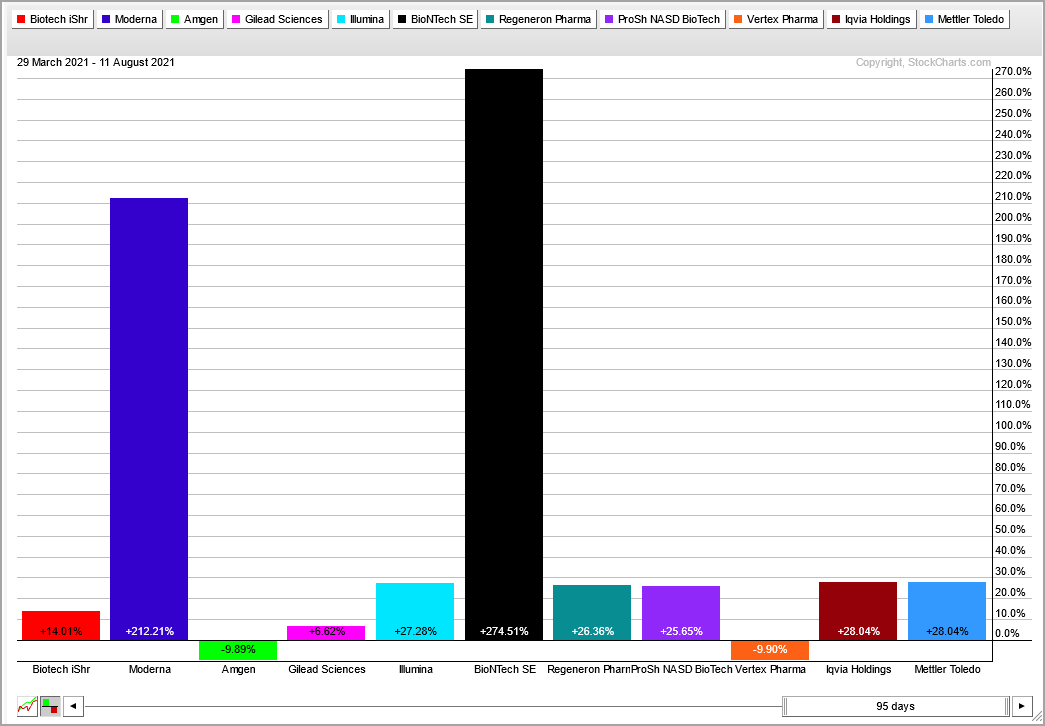
The Biotech ETF (IBB) fell 4.74% the last two days, which should not come as a big surprise because two of the top five holdings fell around 20% the last two days. Moderna (MRNA) and Biontech (BNTX) account for 9.8% and 4.7%, respectively. Both were up more than 300% from late March to early August. $MRNA and $BNTX are doing the heavy lifting for $IBB, but strength is broad within this group since late March. Of the top 10 stocks, 7 are up 20+ percent and only 2 are down. MRNA accounted for just 3.2% of IBB in Nov-2020 and BNTX was not even in the ETF.
The next chart shows IBB with a triangle breakout and 23% advance from the May low to the August high. There was one oversold dip in mid July. IBB remains long-term bullish and on my radar for bullish setups. Time to show some patience and wait for the setup.
Steady Multi-Month Uptrend, No Setup
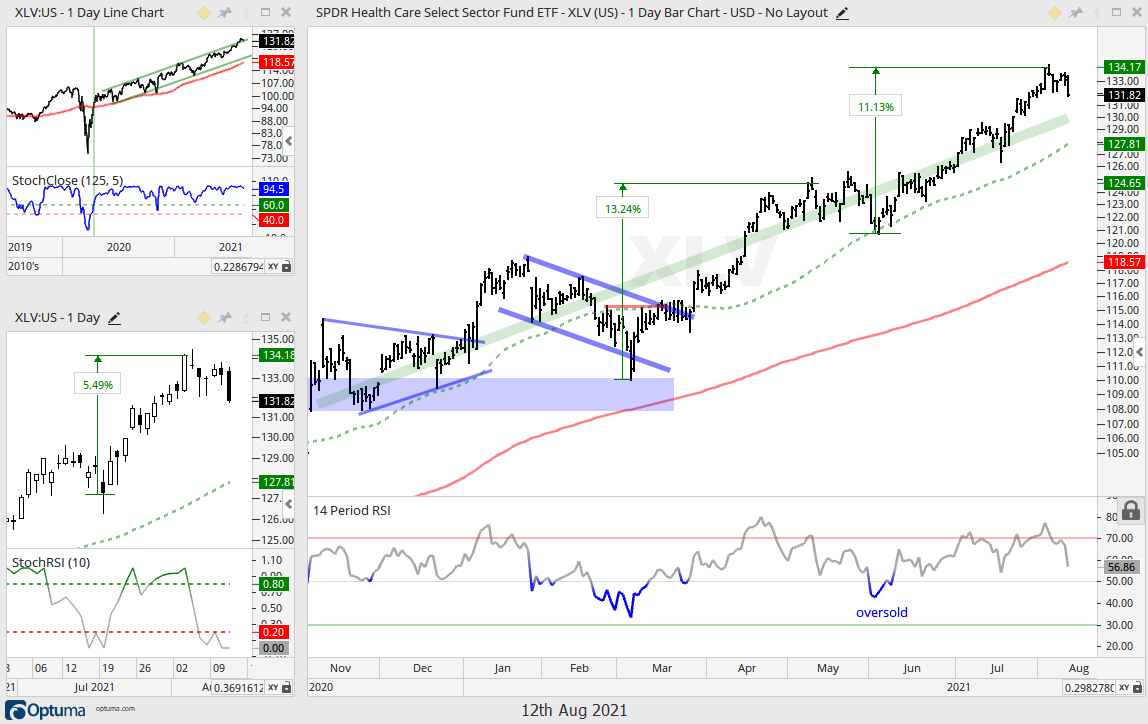
XLC, XLV, XLRE, IYR, REZ, PHO
The first chart shows the Healthcare SPDR (XLV) with a steady advance since the late March breakout. The ETF is up over 20% since late March and getting a bit extended. The thick green line shows the linear regression, which represents the trend mean (middle). The green dashed line is the 50-day SMA. A pullback to the trend mean and/or rising 50-day could provide the next setup.
Big Advance mid May to Early Aug, No Setup
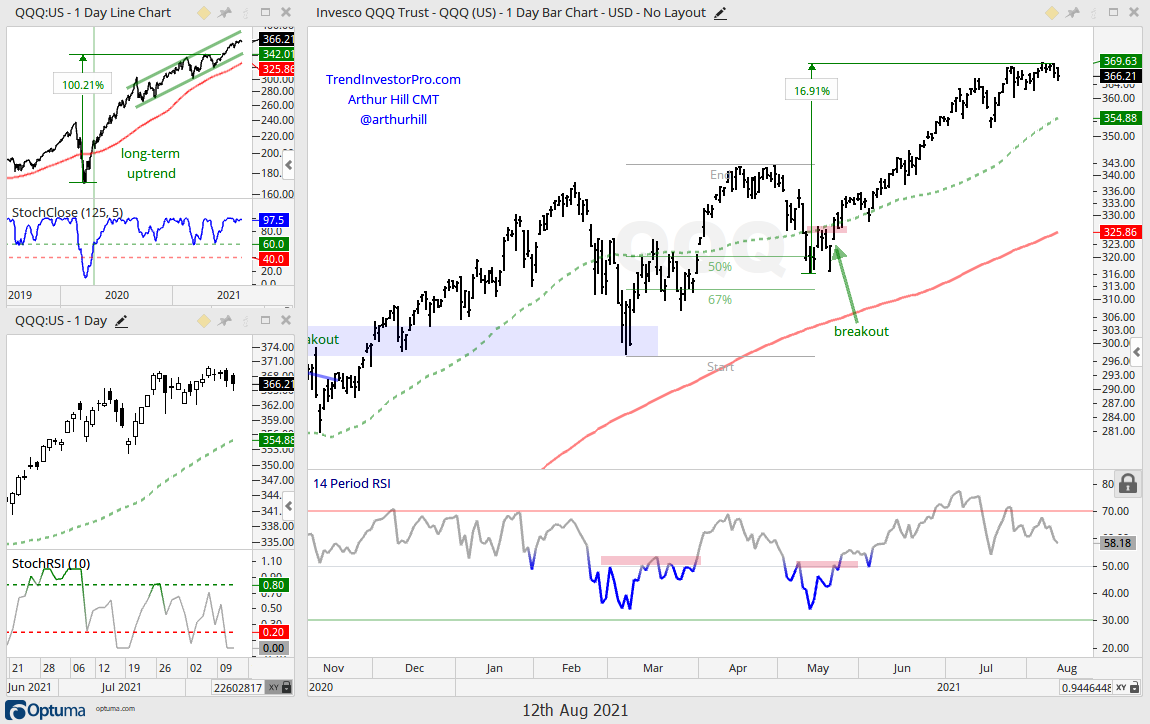
QQQ, XLK, IGV
The next chart shows the Nasdaq 100 ETF (QQQ) with a 17% advance from mid May to early August. The advance started with a bounce off the 50-67% retracement zone and a short-term breakout. QQQ (366) is quite extended right now and the rising 50-day SMA is around 355.
Choppy Uptrend since March, No Setup
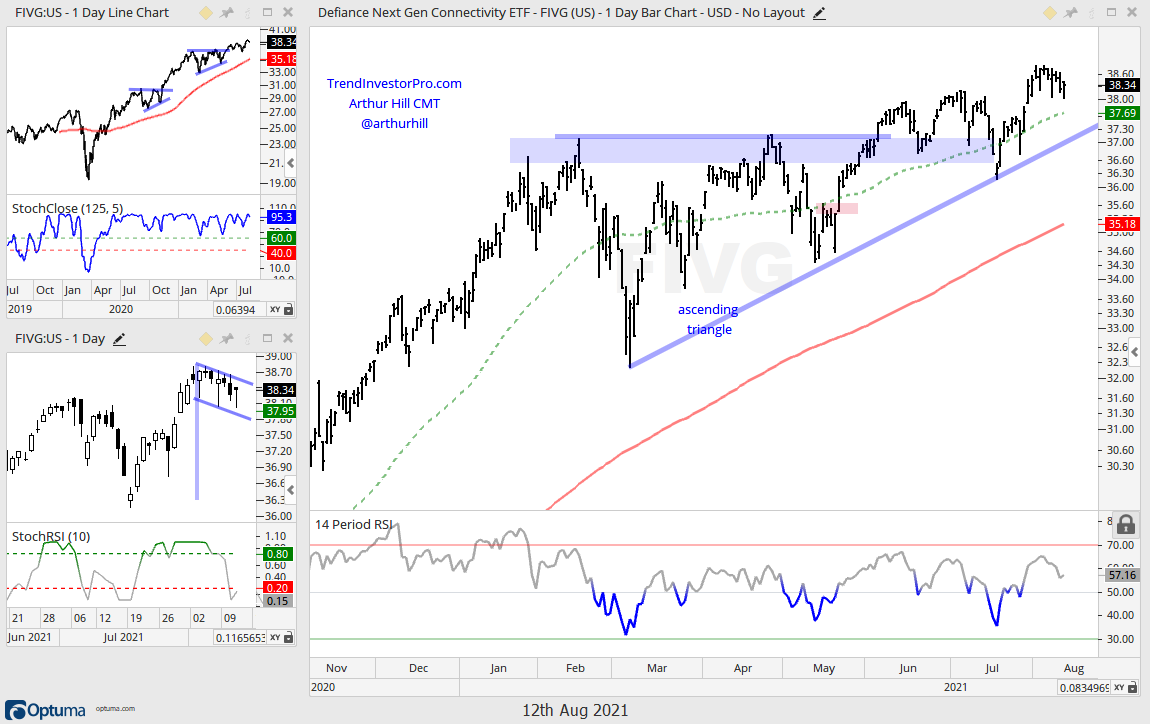
SOXX, SMH, FIVG
ETFs in this group are in uptrends since March and all three hit new highs here in August. The uptrends are quite choppy and this makes them a challenge for short-term setups (volatility). The chart below shows the Next Gen Connectivity ETF (FIVG) with a surge to new highs and a bull flag over the last six days. A breakout at 38.7 would signal a continuation higher.
")