Breadth Wanes as Corrections Unfold, SPY Remains Immune, TLT Flies the Bull Flag, GLD hits Moment of truth (Premium)

Timing a correction in the S&P 500 has been a fool’s errand since the November surge and breakout. The index brushed off negative seasonality in February and August. Techs and high flyers declined from mid February to mid May, but the S&P 500 kept right on trucking as money rotated elsewhere. Despite new highs in early September, I continue to see evidence that weakness is spreading within the index and there are plenty of stocks/ETFs in correction or downtrend mode right now. Bonds are also perking up and a breakout in TLT could show money moving into a safe-haven asset.

On a closing basis, SPY has not experienced a 5% drawdown since late October. On an intraday basis, high to low, there was a 5% drawdown from February 16th to March 4th, around six months ago. SPY was back at a new high in mid March and is up around 20% since the early March low. On the chart below the solid blue line shows the level for a 5% drawdown from the high. This line was last touched on March 4th.

By comparison, the Russell 2000 ETF (IWM) has experienced 9 downswings of at least 5% (high to low) since mid February. IWM is above its early March low, but still below its March high and its June high. The trading range since mid February is either a big topping formation or a big bullish consolidation. Flip a coin.

There are lots a groups in correction or downtrend mode since early March (125 days or six months). The Oil & Gas Equipment & Services ETF (XES) and Clean Energy ETF (PBW) are down more than 20%. The Airline ETF (JETS) and the Online Retail ETF (IBUY) are down more than 10%. The Regional Bank ETF (KRE) and Biotech SPDR (XBI) are down around 8%. The Aerospace & Defense ETF (XAR) is down around 6% and Russell 2000 ETF (IWM) is down around 4%.

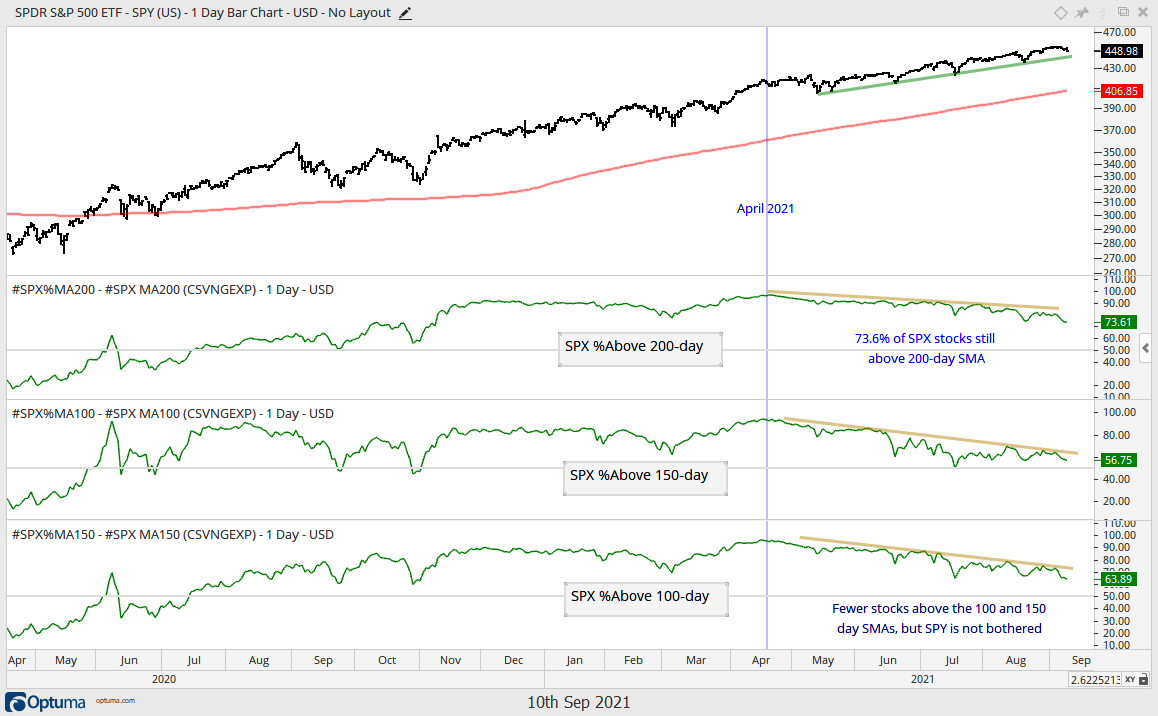
Breadth indicators confirm the existence of downtrends and/or corrections, but have yet to reach a tipping point that would be outright negative (<50%). 73.6% of S&P 500 stocks are above their 200-day SMAs. Still plenty for a bull market, but this is the lowest reading since early November 2020. 63.9% of S&P 500 stocks are above their 100-day SMAs and this is the lowest reading since October 30th.

Large-caps continue to lead with SPY, QQQ and the S&P 500 EW ETF (RSP) hitting new highs again this week. Small-caps (IWM) and micro-caps (IWC) bounced off support zones, but remain stuck in trading ranges that extend back to March. SPY, QQQ, RSP, MDY, IJR and IWM have bullish StochClose signals, while the Russell Microcap ETF (IWC) remains with a bearish StochClose signal.

Seasonally, September is the weakest month of the year for the S&P 500, but price action remains strong for large-caps (click here for full report on seasonal patterns).

The Composite Breadth Model (CBM) remains bullish and has been bullish since May 2020 (see Market Regime page for charts covering the CBM, yield spreads and Fed balance sheet).

Investment grade and junk grade corporate bond spreads narrowed from late September 2020 to late June 2021 and then flattened out at low levels the last two months. There are no signs of stress in the credit markets.

The Fed balance sheet edged higher this week and recorded another all time high. It has been in a steady uptrend (expansion) since mid July 2020.

The 20+ Yr Treasury Bond ETF (TLT) is going for a flag breakout.

The Dollar backed off resistance, but the cup remains half full.   

Gold failed to break resistance and is at its moment of truth.   

Oil remains in corrective mode with a falling channel since July.    

There will be another commentary  later today covering some recent StochClose signals. I will show ways to identify pullbacks after a bullish trend signal. Sometimes the trend pauses, and sometimes it doesn’t.

TLT Goes for Flag Breakout

The 20+ Yr Treasury Bond ETF (TLT) surged on Thursday and completely recouped the losses from Friday-Monday, which were in reaction to the employment report. Overall TLT remains in a long-term uptrend: StochClose is bullish, price is above the 200-day and the 50-day is above the 200-day. The decline from late July to early September is deemed a correction within a bigger uptrend. TLT was mildly oversold this week as RSI dipped into the 40-50 zone and Thursday’s surged triggered a StochRSI pop. Thus, the flag remains in play and a breakout is in the making. A close below 145 would call for a re-evaluation.

Gold Falters at Resistance

Gold is getting whipped around, but the overall trend and pattern are the same. Technically, GLD remains in a downtrend because StochClose triggered bearish on June 22nd. However, it would not take much to reverse this signal because StochClose is currently at 52.3. On the bar chart, GLD surged from March to early June and then corrected with a falling wedge. A higher low formed from March to August and this shows buying pressure at higher prices (positive). The falling wedge is also typical for a correction after a big advance. GLD broke the wedge trendline, but was turned back at resistance this week. Support from the mini-flag (candlestick chart) and late August lows is at hand, which makes this a moment of truth. A bounce from here and break above the July-August highs would be bullish.

Dollar Hits Short-term Support

The Dollar fell sharply into early September, became oversold and got an oversold bounce. StochClose has been bullish since June 23rd, which is a day after StochClose turned bearish for GLD. On the price chart, UUP is range bound since January and just above the mid point of this range (50% line). This is also a good exercise in understanding StochClose (125,5) as an indicator. StochClose measures the location of the close relative to the closing high-low range over a 125-day period (blue lines). This value is then smoothed with a 5-day SMA. A move below the 40% line would put the close firmly in the lower half of the 125-day range and push StochClose toward 40, possibly leading to a bearish signal. For now, the trend is up and UUP is at a moment of truth short-term, just like GLD. Support from the August low is at hand and a break would reverse the upswing within the trading range. A support break in UUP would be positive for gold, while a bounce off support would keep the upswing alive and would be negative for gold.  

Oil Stalls at Channel Line

Oil remains in a long-term uptrend and a medium-term downtrend. Long-term, spot crude hit a new high in early July and remains above the rising 200-day SMA. Medium-term, the ETF fell in July-August and formed a falling channel. A breakout at 71 would be bullish for oil and argue for a continuation of the bigger uptrend. Short-term, the swing within this channel is up, but oil is hitting resistance in the 70 area. A break below 47 in USO would reverse the upswing (see candlestick chart).  

Thanks for tuning in and happy Friday!

ETF Trends, Patterns and Setups – Uptrends and Extended, Oversold vs OVERSOLD, ETFs with Lower Highs Underperforming (Premium)

Of the 113 ETFs in the Core List, 79 are in uptrends (70%) and 34 are in downtrends (30%). This is more than enough to support a bull market in stocks. Six of the seven major index ETFs are in uptrends (SPY, RSP, MDY, IJR, IWM , QQQ) and one

ETF Trends, Patterns and Setups – Uptrends and Extended, Oversold vs OVERSOLD, ETFs with Lower Highs Underperforming (Premium) Read More »

Weekend Video – Analyzing and Quantifying New Trend Signals, Old School ETFs Hold Breaks as September Looms (Premium)

SPY continues on its stairway to higher prices with another new high this week. We are also seeing strength in mid-caps as MDY holds its breakout and new trend signals in small-caps (IJR and IWM). Breadth is not as strong as it used to be, but strong enough to support a bull market. Yield spreads show no signs of stress and the

Weekend Video – Analyzing and Quantifying New Trend Signals, Old School ETFs Hold Breaks as September Looms (Premium) Read More »

ETF Trends, Patterns and Setups – New Trend Signals, RSI(14) versus the Momentum Composite, Failed Breakouts Lead to Bigger Consolidations (Premium)

There were several new uptrend signals this past week and these signals suggest a stronger risk appetite in the stock market. Today’s report will review the StochClose indicator and some of these new trend-following signals. We will also show these signals on the revamped Ranking and Trend Table. Today’s charts also

ETF Trends, Patterns and Setups – New Trend Signals, RSI(14) versus the Momentum Composite, Failed Breakouts Lead to Bigger Consolidations (Premium) Read More »

ETF Trends, Patterns and Setups – A Choppy Affair, More Uptrends than Downtrends, Breakouts Holding and Failing (Premium)

Chop is the name of the game for a large part of the market. Some ETFs are grinding higher with tight and steady uptrends (SPY, XLC) and some are in more volatile uptrends (QQQ, IHI). Several of these are quite extended too. We saw a number of

ETF Trends, Patterns and Setups – A Choppy Affair, More Uptrends than Downtrends, Breakouts Holding and Failing (Premium) Read More »

Weekend Video – Large-caps Continue to Lead, TLT Perks Up, Some Breakouts Holding and Some are Failing (Premium)

Large-caps remain in bull mode with SPY, QQQ and the S&P 500 EW ETF leading. Small-caps and micro-caps tell another story with downtrend signals based on StochClose. We have yet to see a flight to safety that could trigger a correction in SPY, but I am watching TLT as it forms a bull

Weekend Video – Large-caps Continue to Lead, TLT Perks Up, Some Breakouts Holding and Some are Failing (Premium) Read More »

Junk Bond Spreads Widen, Small and Micro Caps Underperform, Energy Related ETFs Fail to Bounce (Premium)

Today’s commentary will look at the recent widening in Junk bond spreads because this widening shows less confidence in corporate bonds with the highest risk. We are also seeing some risk aversion in the stock market because small-caps are lagging large-caps. Small-caps represent higher

Junk Bond Spreads Widen, Small and Micro Caps Underperform, Energy Related ETFs Fail to Bounce (Premium) Read More »

Stock/Bond Ratio Turns, Gold Follows TLT Lower, Oil Hits Support with a Bang and the Dollar Remains Rangebound (Premium)

The stock market environment is bullish and we are seeing a rotation within the stock market. Yield spreads are edging up, but so is the Fed balance sheet. Elsewhere, we are seeing more risk appetite when looking at the stock/bond ratio. The recent breakdown in bonds appears

Stock/Bond Ratio Turns, Gold Follows TLT Lower, Oil Hits Support with a Bang and the Dollar Remains Rangebound (Premium) Read More »

ETF Trends, Patterns and Setups – Signs of Rotation, Old Economy ETFs Start to Lead, Prior Leaders Start to Lag, SPY Doesn’t Care (Premium)

Signs of rotation kicked in with a big surge in the 10-yr yield and the rotations continued over the past week. We are seeing leadership from the groups that lagged from May to July. These are ETFs related to finance, industrials, materials and housing. ETFs related to tech and healthcare led the market from May to July and these groups could be poised

ETF Trends, Patterns and Setups – Signs of Rotation, Old Economy ETFs Start to Lead, Prior Leaders Start to Lag, SPY Doesn’t Care (Premium) Read More »

Weekend Video – Big Moves in Bonds, Gold and the Dollar trigger Signs of Rotation within Stock Market (Premium)

Signs of rotation suddenly appeared in the markets with the Treasury bond ETFs falling sharply and the 10-yr yield surging. The Dollar followed yields higher, while the Gold SPDR followed bonds lower. Within the stock market, we saw strength in banks lift small-caps and weakness in XLY and XLK weigh on the S&P 500 SPDR. Elsewhere, the S&P 500 EW

Weekend Video – Big Moves in Bonds, Gold and the Dollar trigger Signs of Rotation within Stock Market (Premium) Read More »

Treasury bond ETFs, Gold and Dollar Battle 200-day SMAs – Oil and SPY Remain Firmly Above Rising 200-day SMAs (Premium)

This report covers the intermarket arena: oil, bonds, gold and the Dollar. In particular, the 200-day SMAs are in play for the Treasury Bond ETFs, the 10-yr Treasury Yield, the Gold SPDR and the Dollar Bullish ETF. The Treasury bond ETFs and Dollar are just above their FALLING 200-day SMAs, and the Gold

Treasury bond ETFs, Gold and Dollar Battle 200-day SMAs – Oil and SPY Remain Firmly Above Rising 200-day SMAs (Premium) Read More »

ETF Trends, Patterns and Setups – S&P 500 Continue to Lead, Finance and Industrial SPDRs Battle for Breakouts, EV ETFs Take the Lead Again (Premium)

Tech, Healthcare, Communication Services, REITs and Water are leading the market since mid May. ETFs related to Finance, Industrials, Materials and Energy corrected in June and July. Some made bids to end these corrections (Housing, Copper, Steel) and some are struggling to get above resistance (XLI, XLF). Downtrends in the Regional Bank ETF

ETF Trends, Patterns and Setups – S&P 500 Continue to Lead, Finance and Industrial SPDRs Battle for Breakouts, EV ETFs Take the Lead Again (Premium) Read More »

Weekend Video – Correction Concerns vs Signals, Materials Related ETFs Break Out, XLI and XLF Stall at Resistance (Premium)

SPY and QQQ eked out new highs this week and IWM even bounced. However, IWM is still down over 5% the last twenty weeks and seriously lagging the other two, which are up double digits. Despite continued strength in SPY, there are some concerns brewing under the surface. Yield spreads edged up, S&P 500 breadth is

Weekend Video – Correction Concerns vs Signals, Materials Related ETFs Break Out, XLI and XLF Stall at Resistance (Premium) Read More »

Scroll to Top