
Market and ETF Report – Stocks Short-term Oversold, Oil and Ag Commodities Hold Up, Industrials Metals Hit (Premium)

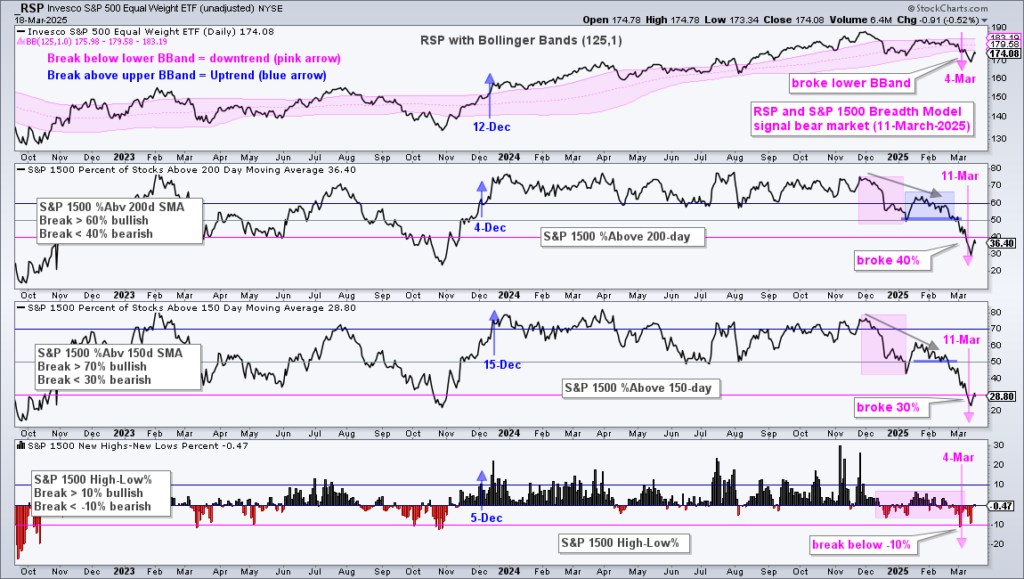
The Composite Breadth Model remains bearish and we are in a bear market environment for stocks. Oil and agricultural commodities remain relatively strong, but industrial metals were hit pretty hard the last two weeks. Downside participation broadened over the last two weeks with most groups getting hit. We are talking stocks, commodities, non-Dollar currencies, bonds and everything in between. I am concerned that selling pressure broadened like this. Even so, there are still some commodity-related ETFs in uptrends and they remain the focus.

Just how broad-based was the selling pressure of the last ten days? Of the 276 ETFs in the Master ETF List, only 13 are positive over the last ten trading days (KWEB, BDRY, KRBN, DBE, EIDO, CHIQ, UUP, FXI, REM, ITB, KSA, CQQQ and XHB). This means pretty much everything was hit and there were very few places to high. The list of 10-day gainers is interesting in that it includes China (KWEB, CHIQ, FXI, CQQQ), Housing (ITB, XHB), the Dry Bulk Shipping ETF (BDRY) and the Global Carbon ETF (KRBN).  

About the ETF Trends, Patterns and Setups Report

This report contains discretionary chart analysis based on my interpretation of the price charts. This is different from the fully systematic approach in the Trend Composite strategy series. In this ETF Trends, Patterns and Setups report, I am looking for leading uptrends and tradable setups within these uptrends. While I use indicators to help define the trend and identify oversold conditions within uptrends, the assessments are mostly based on price action and the price chart (higher highs, higher lows, patterns in play). Sometimes the chart assessment can be at odds with the indicators.

Scheduling

I am working in the US for now and the next ETF/Market Report will be on Thursday evening, May 5th.

Normal scheduling will resume on Tuesday, May 10th with a report posted before 9AM ET.

Many thanks to all those sending their condolences. I greatly appreciate it.

SPY and QQQ are Short-term oversold, but Long-term Bearish

SPY fell 9% in April and QQQ fell 13.60%. Both are short-term oversold after sharp declines that breached the March lows and this could give way to an oversold bounce or some firming. The long-term trend, however, is clearly down as both formed lower highs from January to March and lower lows from February to early May. These lower lows and lower highs combine to define a falling channel or the current downtrend. SPY tagged the lower line of this channel with a low in the 405 area on Monday and bounced back above 410.

Even though both SPY and QQQ are short-term oversold, I am not interested in short-term bullish setups because the bigger trend is down. The Trend Composites are both negative and prices are working their way lower here in 2022. The chart below shows that QQQ has yet to reach the lower trendline of the falling channel and could have further to fall. Also notice that the Trend Composite has been negative since mid January.

You can learn more about my chart strategy in this article covering the different timeframes, chart settings, StochClose, RSI and StochRSI.

Oil and Ag Leading Industrial and Precious Metals

Stocks fell sharply over the past month and selling pressure extended into industrial and precious metals. The PerfChart below, which extends from April 1st to May 3rd, shows spot prices for twelve commodities. On the left, note that copper, gold and silver are down. In the middle, oil and gasoline are up, and natural gas is up 39%. Agricultural commodities are also holding up as wheat, soybeans and corn show gains.

Oil Remains within Bullish Continuation Pattern ($WTIC, DBE)

West Texas Intermediate ($WTIC) has gone sideways since the parabolic surge above 120 and drop to the low 90s in the first half of March. Prices have simply moved sideways as oil consolidates within an uptrend. A consolidation within an uptrend is considered a bullish continuation pattern and this means a breakout is expected, and possibly underway. There are two smaller wedges within the larger wedge and both of these short-term breakouts are holding.

The bottom window shows the DB Energy ETF (DBE), which is around 11.50% natural gas, 28% diesel and 20.8% gasoline. This one is benefitting from the big gains in natty and fuel. DBE hit a new high on Monday and then fell back on Tuesday with an inside day. While an inside day could be a short-term reversal, I am not interested in short-term bearish reversal patterns when the bigger trend is up.

You can learn more about exit strategies in this post,
which includes a video and charting options for everyone.

DB Agriculture ETF Corrects (DBA and WEAT, CANE, JO)

The DB Agriculture ETF (DBA) also succumbed to selling pressure over the last two weeks as it fell around 4%. The decline, however, looks like a short-term bullish continuation pattern (small falling wedge). The long-term trend is clearly up so this is viewed as a pullback within this uptrend. A wedge breakout would signal an end to the pullback and a resumption higher.

Wheat is the second largest component in DBA and the Wheat ETF (WEAT) is also correcting with a small wedge. The overall trend for WEAT is up with the big wedge and breakout representing the last setup. After a move above 11, WEAT corrected with a small wedge the last two weeks and this is viewed as a short-term bullish continuation pattern. A breakout would end this correction and signal a continuation higher.

The Momentum Composite aggregates signals in five momentum-type indicators to identify short-term overbought and oversold conditions. This indicator is part of the TIP Indicator Edge Plugin for StockCharts ACP

Energy-related ETFs Hold Up (XLE, XES, FCG)

The energy-related ETFs continue to hold up the best overall. Many hit new highs in April and then fell back with sharp 3-day declines towards the end of the month. Even though the Momentum Composite did not dip to -3 or lower to become oversold, an 8 to 10 percent decline in three days is enough to create a short-term oversold condition. Furthermore, many of these ETFs tested their March lows on the late April pullback and these lows mark support. The chart below shows XLE with an example.

Industrial Metals Plunge and Test Resolve (DBB, CPER, COPX)

The DB Base Metals ETF (DBB), Copper ETF (CPER) and Copper Miners ETF (COPX) were hit hard over the last two weeks with 10+ percent declines. Moreover, these declines were pretty much straight down as they fell rather sharply. Zinc and Aluminum are also down sharply. The DB Base Metals ETF (DBB), which is equal parts zinc, aluminum and copper, remains in a long-term trend because the Trend Composite is positive and the ETF hit a new high in March. The current decline, however, is testing resolve because it is so sharp. At this point, DBB retraced one half to two thirds of the prior advance. Though deep, this is still normal for a pullback within a bigger uptrend. DBB is also above the lower line of the long rising channel. Thus, it looks like DBB is entering a potential make or break zone in the 23 area. DBB either firms soon to forge a short-term reversal or weakens further to reverse the bigger uptrend.

The Copper ETF (CPER) presents us with a real challenge because the Trend Composite turned negative and it exceeded its late January low. I will note, however, that the nearby copper futures contract on TradingView (COPPER1!) has yet to break its January lows and remains above the rising 200-day SMA. I still remain bullish on CPER because of price action in the nearby futures contract. A break below the January lows would be bearish and I will monitor this. Short-term, CPER is in the falling knife category and needs to break 27.5 to reverse this fall.

The Copper Miners ETF (COPX) is holding up better because the Trend Composite remains positive and price held above the January low (green line). COPX also firmed the last five days and a break above last week’s high would be short-term bullish.

Palladium ETF Holds Support Zone (PALL)

There is no real change in the Palladium ETF (PALL) as the ETF firms near the support zone (blue shading). Overall, I view the 100% surge and new high as long-term bullish. The trend is also up because the Trend Composite remains positive. PALL did not hold the wedge breakout and turned very volatile the last few weeks. Nevertheless, I view the falling wedge as a correction within an uptrend and the breakout as bullish as long as the March-April lows hold. A break below these lows would be bearish.

Uranium Returns to Breakout and Firms (URA)

The Uranium ETF (URA) is another one of these metal-related ETFs with a sharp pullback the last three weeks. The Trend Composite turned negative, but URA has yet to break support. Note that this Trend Composite signal is based on data that is NOT adjusted for dividends (_URA at StockCharts). The trend call for URA is challenging, but I still consider the trend up because of the late February breakout. The decline back to the 22-24 area retraced 50 to 67 percent of the prior advance, which is normal. A falling wedge or flag did not form, but URA is firming and a break above last week’s high would be bullish. A close below 22 would argue for a re-evaluation.

Gold Remains within Big Wedge Correction (GLD)

The Gold SPDR (GLD) represents precious metals and remains in an uptrend. The ETF hit a new high in March and the Trend Composite remains positive. The falling wedge after the new high retraced over 2/3 and this could be an overshoot. In any case, this still looks like a correction after a big advance and a breakout would signal a continuation higher. I am still watching the swings within the pattern for an early clue. The red line defines the downswing within the pattern and a break above 127 would reverse this swing. This could open the door to a bigger wedge breakout.

All Sectors Participating in the Bear Market

We saw downside participation broaden over the last two weeks as defensive groups and leaders were hit with selling pressure. This is a negative sign because it means correlations within the stock market are rising and there are fewer places to hide (get positive return). The PerfChart below shows performance for SPY and the 11 sector SPDRs over the last ten trading days. Utilities, staples and healthcare (right side) are the classical defensive sectors and they were down four to seven percent over the past two weeks.  While these defensive sectors and related groups should, in theory, hold up better in a bear market, they are unlikely to actually advance and will probably just decline less. Note that XLE (purple) held up the best of the eleven, while the Communication Services SPDR (XLC) and Consumer Discretionary SPDR (XLY) were hit the hardest.

Stock ETFs with Uptrends and Pullbacks (PBJ, MOO, XME, XLB)

So, correlations are rising and we are in a bear market. That pretty much means to avoid bullish signals in stock-related ETFs. Why? Because the odds are not good for a successful trade or move higher in these conditions. Even so, there are a few stock-related ETFs that still have uptrends and short-term bullish setups. Their uptrends are defined by new highs in April and positive Trend Composites. They are setting up short-term because they retraced one to two thirds of a prior advance. Some formed falling flags or wedges, and some returned to broken resistance, which turns support. Those interested in such setups should watch for a short-term bullish catalyst, such as a StochRSI(10) pop above .80 or a short-term breakout.

Prior Report

Sunday’s video covered the broad market environment, gold, bonds, the Dollar, oil and dozens of ETFs. I also chimed in on widening yield spreads and increase in downside participation.

You can learn more about my chart strategy in this article covering the different timeframes, chart settings, StochClose, RSI and StochRSI.

Thanks for tuning in and have a great day!

Market/ETF Video – Downside Participation Broadens, Industrial Commodities Hit, Oil and Ag Remain Strong (Premium)

The weight of the evidence remains bearish for stocks and participation to the downside expanded significantly over the last six trading days. Even the low volatility leaders were hit hard and there were few places to hide as correlations rose among stocks. Bonds managed to firm, but do not offer an alternative to stocks

Market/ETF Video – Downside Participation Broadens, Industrial Commodities Hit, Oil and Ag Remain Strong (Premium) Read More »

Market and ETF Report –  Downside Participation Broadens, QQQ and IWM Lead Lower, Three ETFs in Uptrends with Oversold Conditions (Premium)

It is not pretty out there. The Composite Breadth Model is bearish and yield spreads are rising. We are also seeing large-techs (QQQ) and small-caps (IWM) lead the broader market lower. Selling pressure intensified with lopsided down days on Friday and Tuesday. Basically

Market and ETF Report –  Downside Participation Broadens, QQQ and IWM Lead Lower, Three ETFs in Uptrends with Oversold Conditions (Premium) Read More »

Market and ETF Report – Breadth Deteriorates, Leading ETFs Take Hits, Some Commodity ETFs Hold Up (Premium)

The broad market environment for stocks was more bearish than bullish early last week and became even more bearish after the sharp decline on Thursday-Friday. Downside participation broadened as many of the market leaders were hit hard. We are talking about the Metals & Mining SPDR, the

Market and ETF Report – Breadth Deteriorates, Leading ETFs Take Hits, Some Commodity ETFs Hold Up (Premium) Read More »

Market and ETF Report – The Value of Plain Charts, Short-term Setups to Front Run, About that H&S in QQQ (Premium)

Today we are going to dive into the subjective world of chart analysis. The weight of the evidence is bearish for stocks, but it is not overwhelmingly bearish because the S&P 500 breadth models are still net bullish. The market is quite divided and this is why SPY has been flat since September. The January-March decline

Market and ETF Report – The Value of Plain Charts, Short-term Setups to Front Run, About that H&S in QQQ (Premium) Read More »

Market/ETF Video – Weight of the Evidence is Bearish, but Bulls are Still Fighting (Premium)

The weight of the evidence for the stock market remains more bearish that bullish. More stocks are below their 200-day SMAs than above, volatility is above average for SPY and the Composite Breadth Model is net bearish. Nevertheless, the S&P 500 SPDR and the S&P 500 EW ETF are trying to forge short-term reversals with big moves on Tuesday.

Market/ETF Video – Weight of the Evidence is Bearish, but Bulls are Still Fighting (Premium) Read More »

Market and ETF Report – Defensive at Best, Bearish at Worst, Commodity-Related ETFs Continue to Lead (Premium)

The broad market environment for stocks is more bearish than bullish. The Composite Breadth Model is negative, more stocks are below their 200-day SMAs than above and the S&P 500 is below its 200-day. Also note that yield spreads are rising again, offensive groups are lagging and defensive groups are leading.

Market and ETF Report – Defensive at Best, Bearish at Worst, Commodity-Related ETFs Continue to Lead (Premium) Read More »

Market and ETF Report – Know Thy Strategy, SPY vs Market, SPY vs XLB, Software vs Cybersecurity (Premium)

There are often crosscurrents in the market and these can create confusion. For example, the Trend Composite for SPY is positive, but the 5-day SMA is below the 200-day SMA. On the price chart, SPY appears to be in a downtrend in 2022, but there is a short-term bullish

Market and ETF Report – Know Thy Strategy, SPY vs Market, SPY vs XLB, Software vs Cybersecurity (Premium) Read More »

Market/ETF Video – Weakness under the Surface and in Key Groups, Defensive and Commodity ETFs Lead (Premium)

The Composite Breadth Model flipped back to bearish as the 5-day SMA for SPX crossed below the 200-day SMA. Despite whipsaws in the model, the percentage of stocks above the 200-day SMA and High-Low Percent paint a picture of weakness in 2022. SPY and RSP may be holding up, but the

Market/ETF Video – Weakness under the Surface and in Key Groups, Defensive and Commodity ETFs Lead (Premium) Read More »

Mkt/ETF Commentary – Defining Oversold, Working with Sentiment Indicators, High Beta vs Low Volatility (Premium)

The broad market ETFs were hit with selling pressure on Wednesday with growth oriented groups leading the way lower. SPY fell 1%, QQQ was down 2.17%, the Semiconductor ETF fell 2.5% and the Russell 2000 Growth ETF was down 1.88%. In contrast, groups associated

Mkt/ETF Commentary – Defining Oversold, Working with Sentiment Indicators, High Beta vs Low Volatility (Premium) Read More »

Mkt/ETF Commentary – Defensive Groups Lead Split Market, Commodity ETFs Set Up with Pullbacks, Wary of Flag Breakouts (Premium)

There are large pockets of strength in the stock market, but also large pockets of weakness. In fact, these pockets are almost equal and this is the reason the S&P 500 has gone nowhere since Thanksgiving. The Composite Breadth Model is net bullish and split. The S&P 500 trend model is net bullish

Mkt/ETF Commentary – Defensive Groups Lead Split Market, Commodity ETFs Set Up with Pullbacks, Wary of Flag Breakouts (Premium) Read More »

Market/ETF Video – Price and Breadth Thrusts, the Real ETF Leaders, Commodity ETFs Still Strong, PALL Pullback, KRE Setup (Premium)

This video starts with broad market analysis and then moves to the individual ETFs. The broad market section includes the Composite Breadth Model, Fed balance sheet and yield spreads. Breadth indicators, SPY, QQQ, bonds, gold and the Dollar are also covered. Analysis, then turns to the ETFs charts with leading trends, emerging trends and setups.

Market/ETF Video – Price and Breadth Thrusts, the Real ETF Leaders, Commodity ETFs Still Strong, PALL Pullback, KRE Setup (Premium) Read More »

Mkt/ETF Commentary – Mean Reversion Timeframe versus Trend Reversing Timeframe, 7 Themes to Keep in Mind (Premium)

It as been 18 days since Putin invaded Ukraine and SPY is up 5.32% since the close on Wednesday, February 23rd. QQQ is up 6.3% and IWM is 6.5%. The 20+ Yr Treasury Bond ETF (TLT), an alleged safe-haven, is down 4.6%. While the gains in stocks are

Mkt/ETF Commentary – Mean Reversion Timeframe versus Trend Reversing Timeframe, 7 Themes to Keep in Mind (Premium) Read More »

Weekend Video – Biggest Moves since Nov-2020, Small-caps Lag, Hard Throwbacks for Oil, Gold and Metals (Premium)

This video starts with broad market analysis and then moves to the individual ETFs. The broad market section includes the Composite Breadth Model, Fed balance sheet and yield spreads. Breadth indicators, SPY, QQQ, bonds, gold and the Dollar are also covered. The ETF section

Weekend Video – Biggest Moves since Nov-2020, Small-caps Lag, Hard Throwbacks for Oil, Gold and Metals (Premium) Read More »

Mkt/ETF Commentary – Short-term Volatility is a Challenge, but it Does not Change Existing Trends (Premium)

It is important to remember that the major trends in play right now were in place before Russia invaded Ukraine. High-flying tech stocks were out of favor late last year and remain out of favor. Weakness spread as the Market Regime turned bearish in mid February and remains bearish.

Mkt/ETF Commentary – Short-term Volatility is a Challenge, but it Does not Change Existing Trends (Premium) Read More »

Weekend Video – Breadth Deteriorates, Yield Spreads Widen, Commodities Turn Volatile, Very Few Uptrends in Stock-Related ETFs (Premium)

This video starts with broad market analysis and then moves to the individual ETFs. The broad market section includes the Composite Breadth Model, Fed balance sheet and yield spreads. Breadth indicators

Weekend Video – Breadth Deteriorates, Yield Spreads Widen, Commodities Turn Volatile, Very Few Uptrends in Stock-Related ETFs (Premium) Read More »

Scroll to Top