
SPY/QQQ Hold Up, MDY/IWM Draw Battle Lines, 6 Short-term Breakouts, 4 Pullback Setups, Breakouts in Semis

Use CRTL+P to Print

The next report will be on Tuesday, January 14th. 

Video Headlines

  • %Above 200-day Indicators Above 50%
  • %Above 20-day Indicators Fall Short
  • SPY Works its Way Higher
  • QQQ also Works its Way Higher (plus XLK, MAGS)
  • RSP Holds the Key to Broader Market (plus MDY, IJR, IWM, XLF, KRE)
  • Flag/Pennant Breakouts (CIBR, FINX, XLC, SKYY, IHI, AMLP)
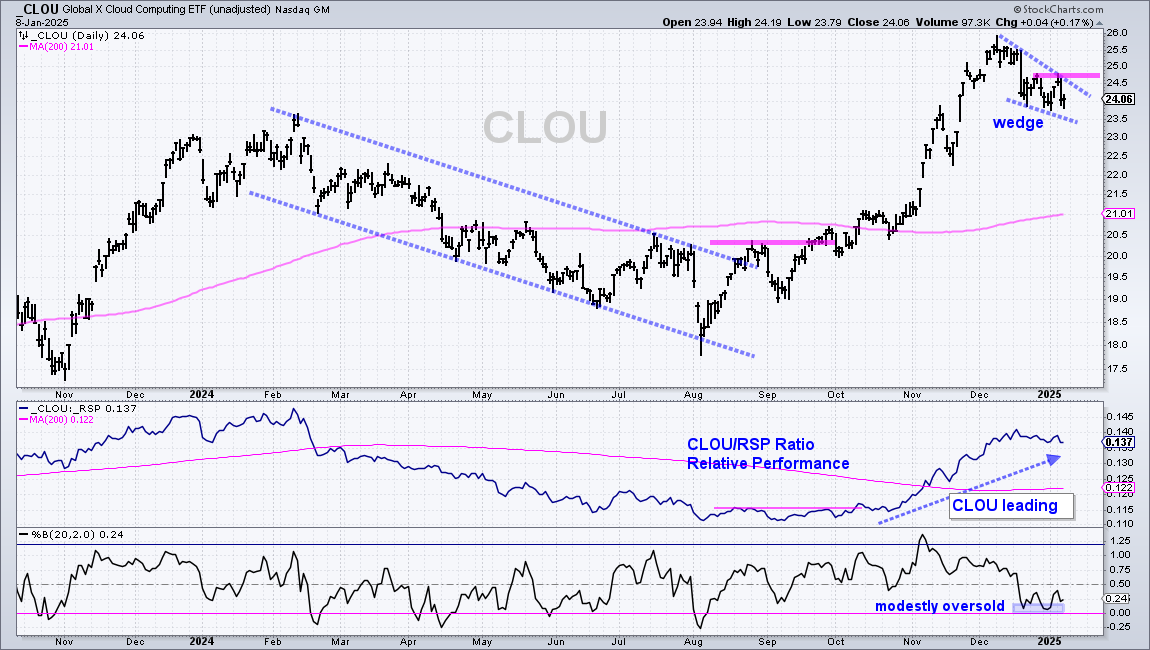
  • Falling Wedge/Channel Patterns (XLI, ITA, IGV, CLOU)
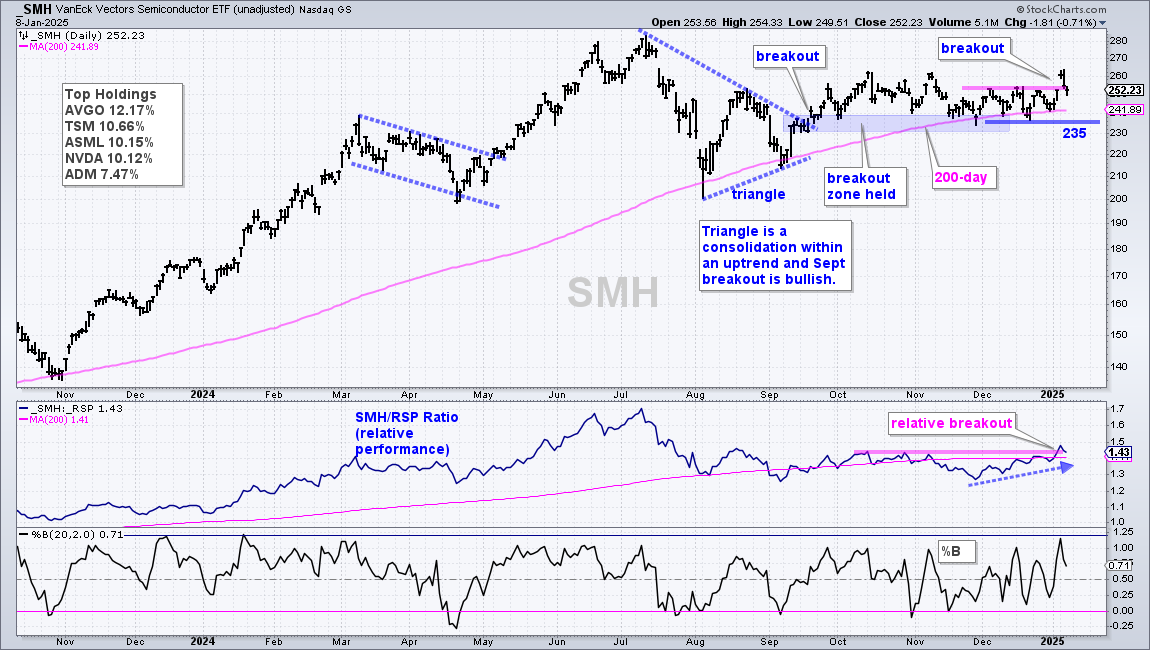
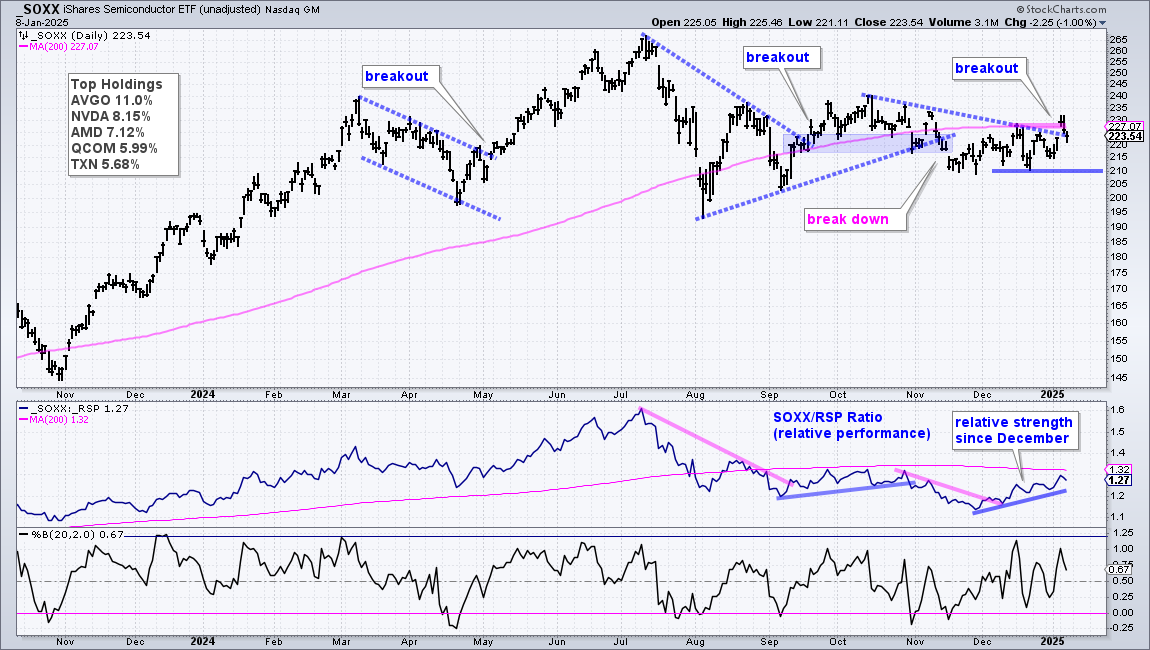
  • Semiconductor ETFs Fall Back after Breakouts
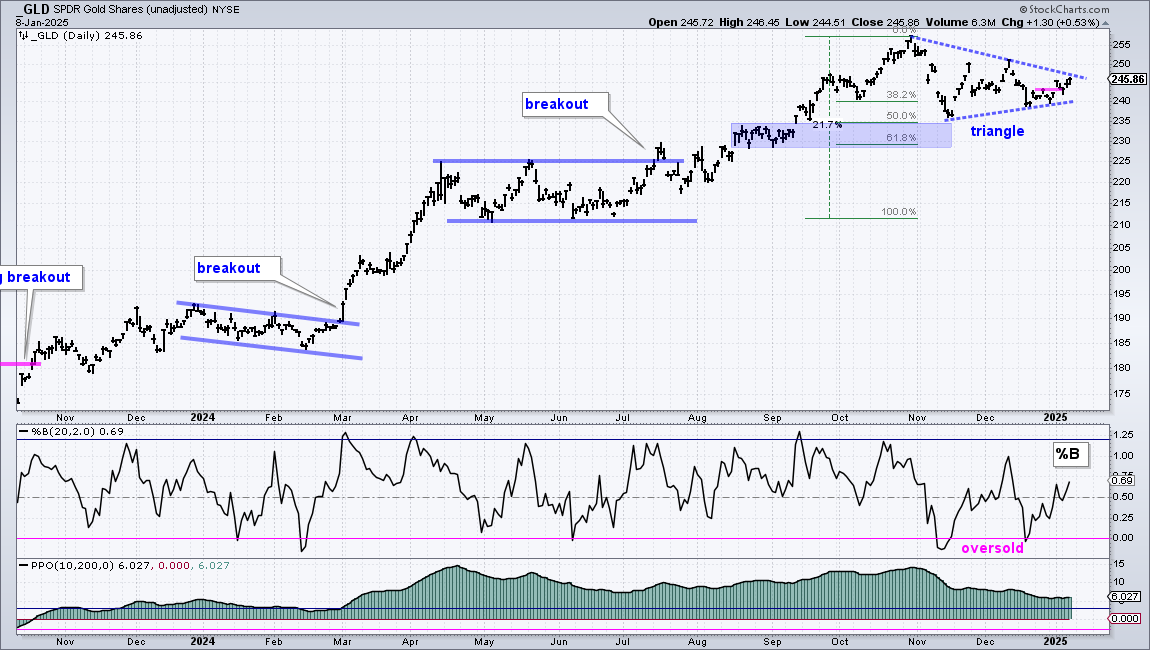
  • Gold SPDR Forms Bullish Triangle (GLD)
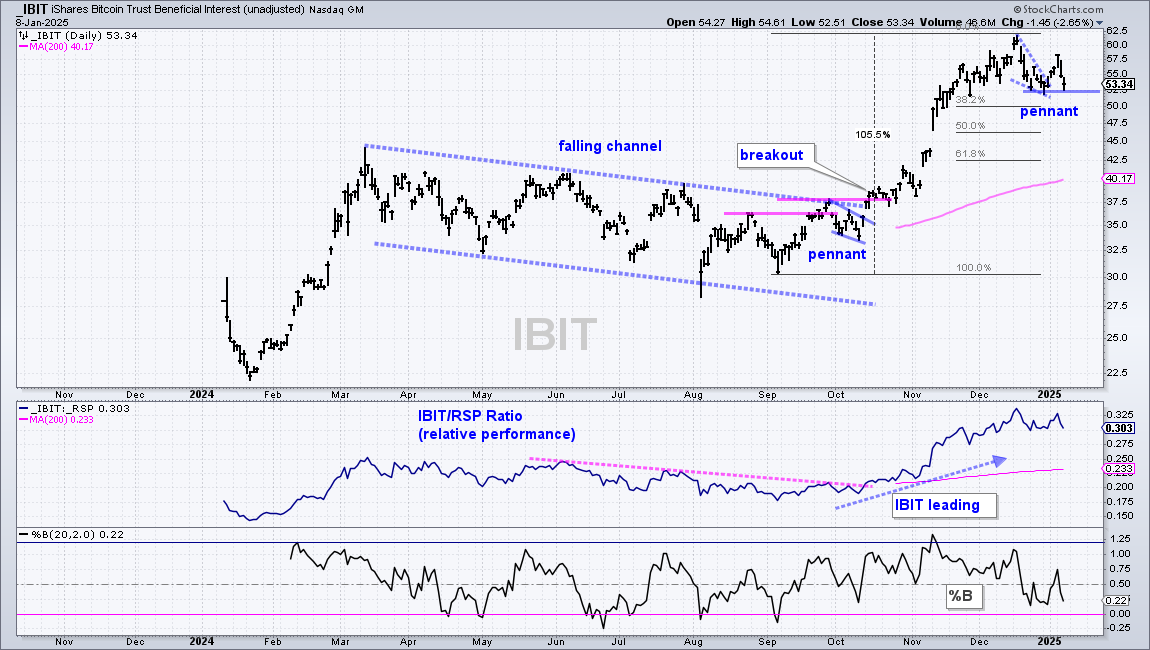
  • Bitcoin ETF Falls Back after Pennant Breakout

There is not much change in the overall picture since Tuesday’s report. The weight of the evidence remains bullish, but stocks were destabilized with sharp declines and weakening breadth in mid December. At this point, I view the December declines as pullbacks within bigger uptrends. SPY and QQQ are holding strong, but mid-caps and small-caps have yet to rebound.

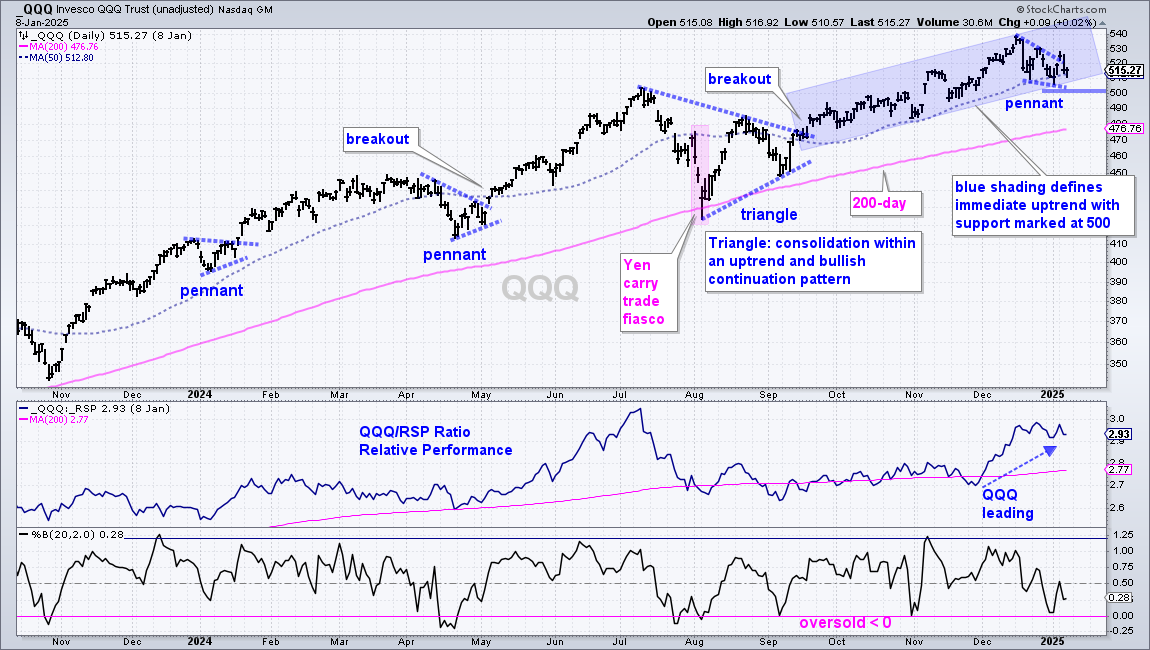
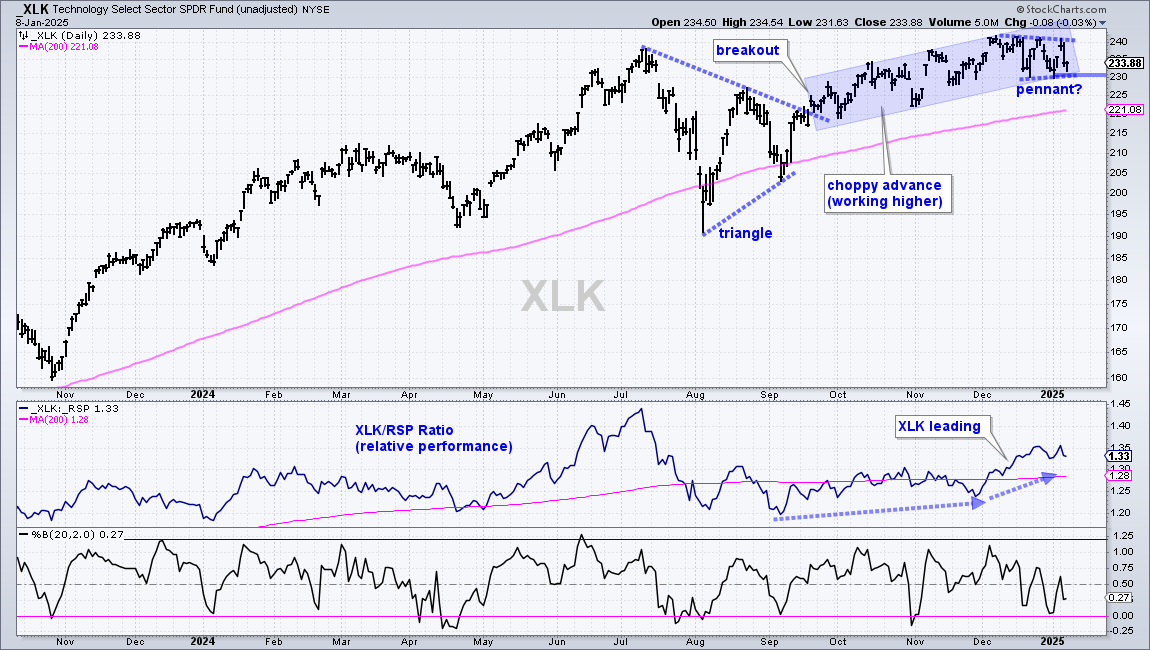
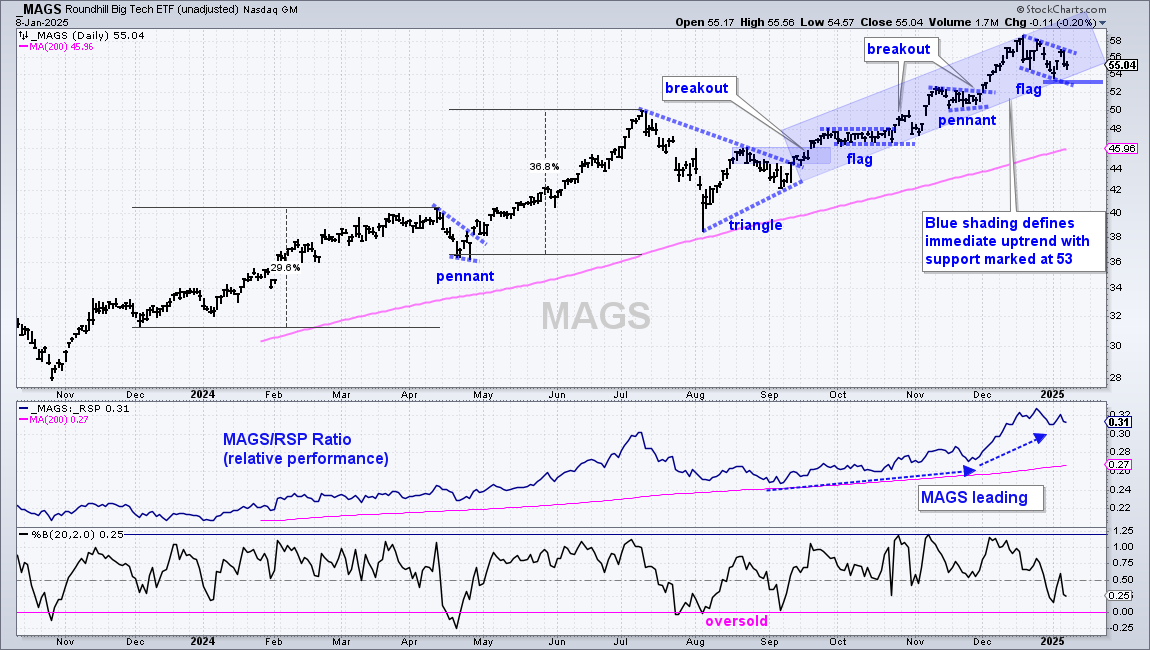
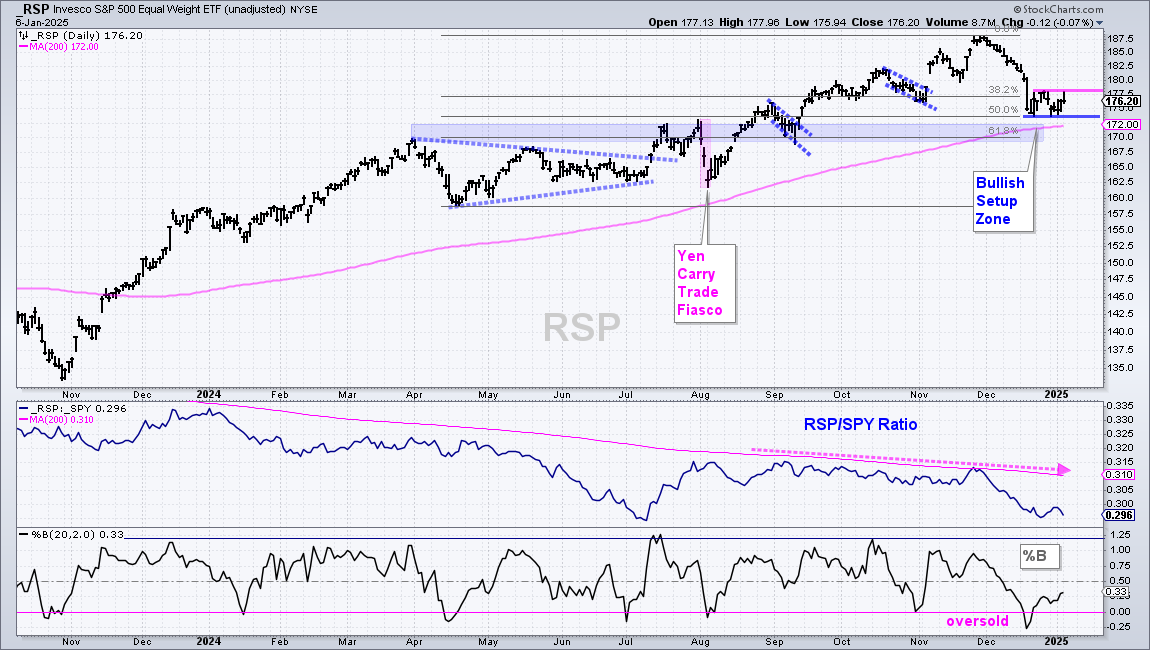
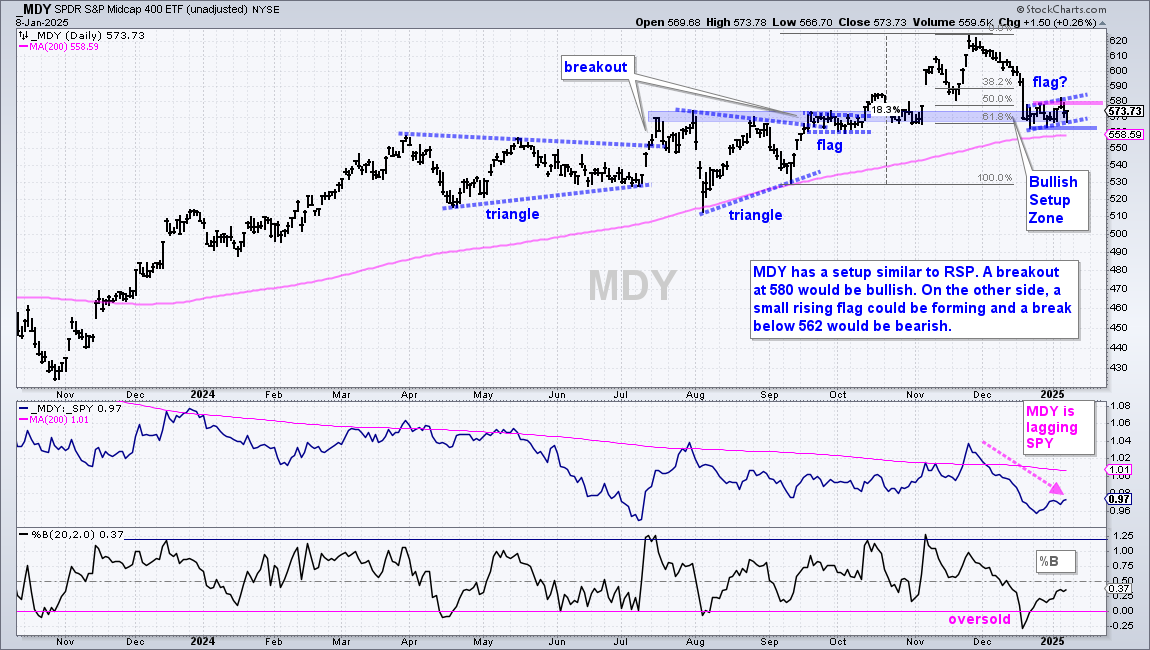
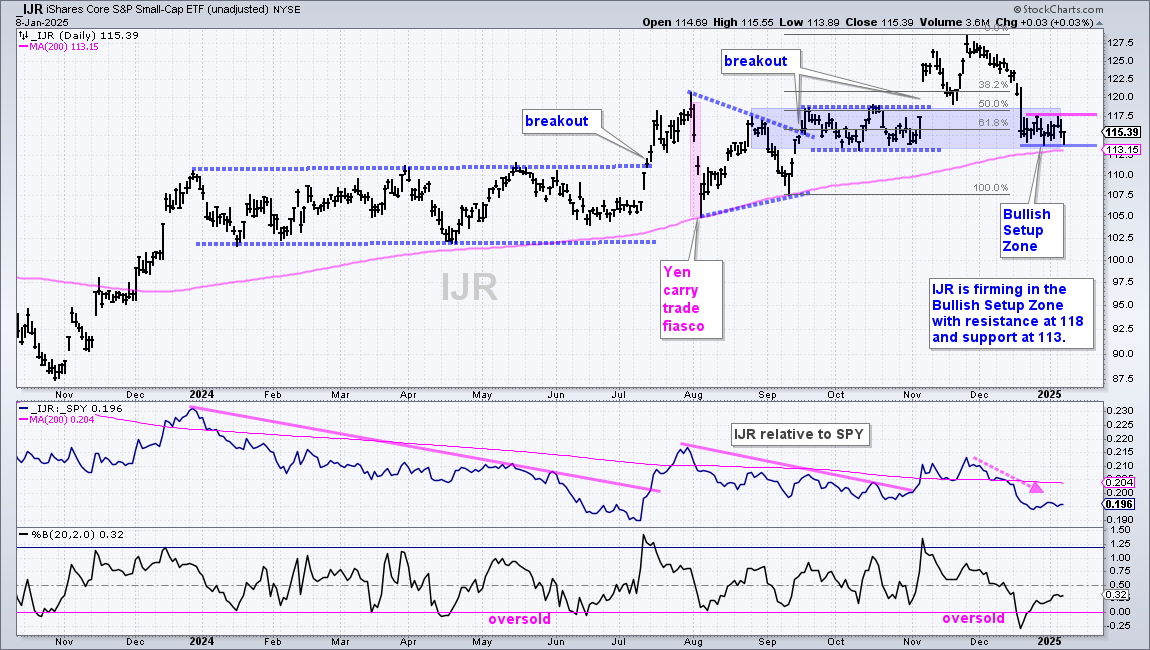
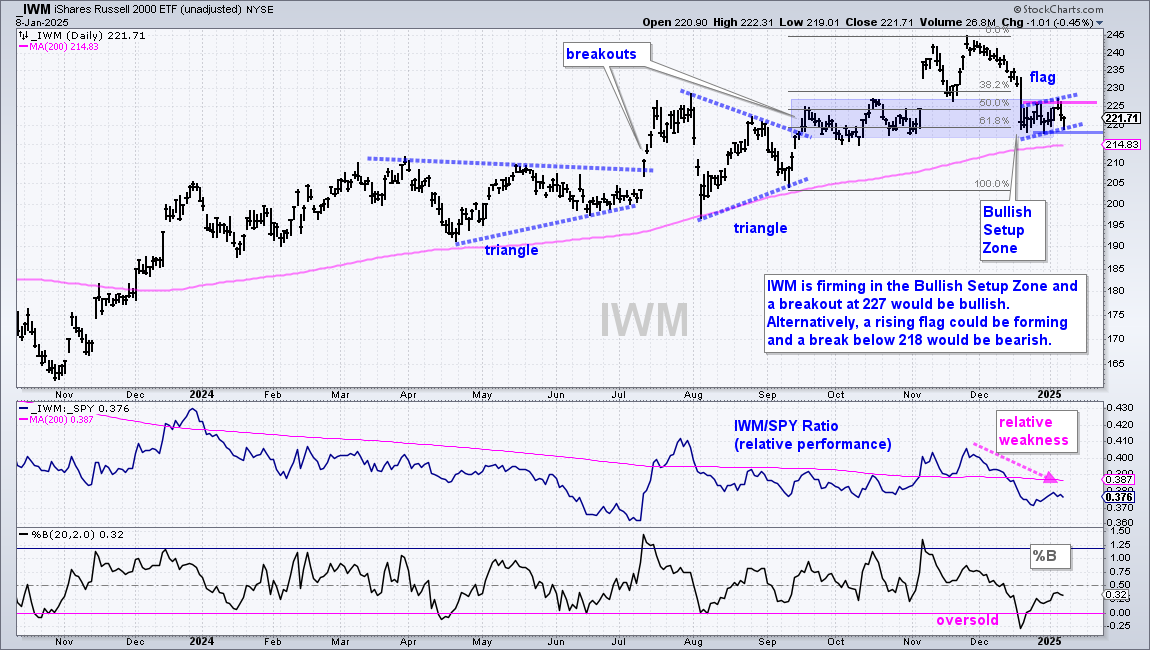
Today’s report starts with long-term and short-term breadth. We then turn to SPY, QQQ, XLK and MAGS. These leaders are in uptrends since their triangle breakouts in mid September and I am using the December lows to mark support. Support breaks in these key ETFs would weigh on stocks and broaden the correction. The S&P 500 EW ETF (RSP), mid-caps and small-caps led the way lower in December and these ETFs firmed the last three weeks with consolidations. The battle lines are drawn. Upside breakouts in these ETFs would show broadening upside participation and be bullish for stocks overall.

We then focus on a group of ETFs showing strength in January with flag/pennant breakouts (CIBR, FINX, XLC, SKYY, IHI, AMLP). There is also a group with bullish setups working, but no breakouts just yet (XLI, ITA, IGV, CLOU). The Semiconductor ETFs (SMH,SOXX) fell back after their breakouts, but I still think the cup is half full. We close with a bullish triangle in the Gold SPDR and a shaky pennant breakout for the Bitcoin ETF.

Note that the US equity markets are closed on Thursday, January 9th, in observance of a National Day of Mourning for President Jimmy Carter.

Short of a Breadth Thrust

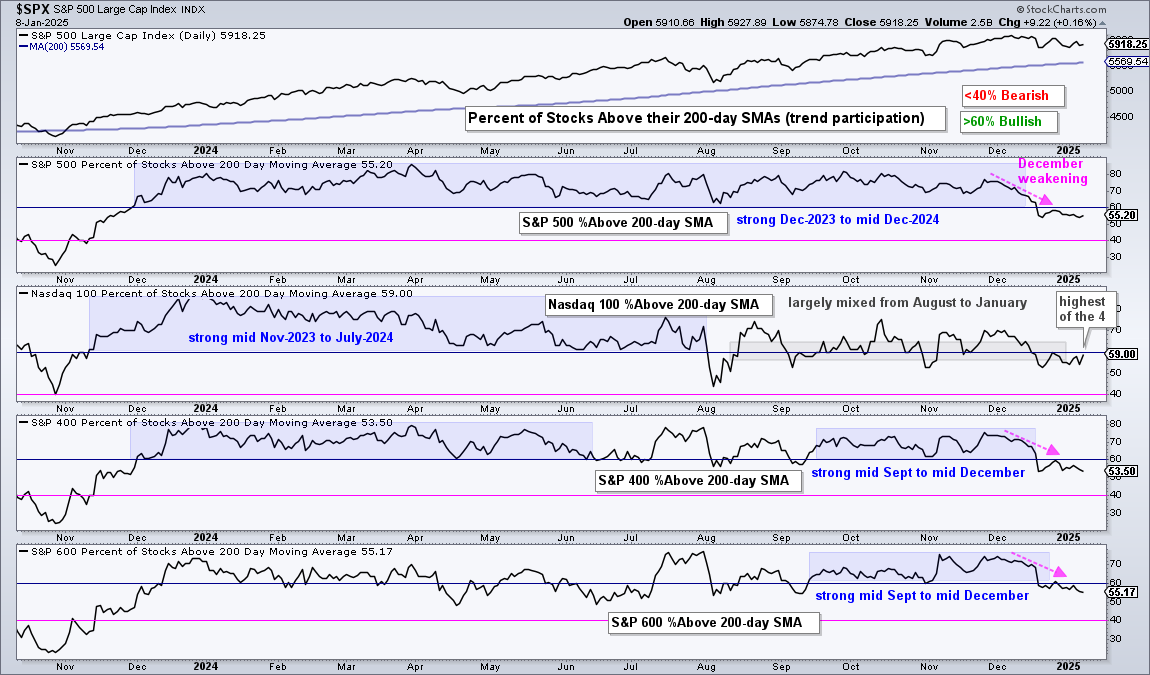
The chart below shows the percentage of stocks above the their 200-day SMAs for the S&P 500, Nasdaq 100, S&P MidCap 400 and S&P SmallCap 600. All four fell below 60% in December and remain below 60%. Some 55% of S&P 500 stocks are above their 200-day SMAs, which means 45% are below and in long-term downtrends. Of note, NDX %Above 200-day is the highest of the four (59%) and showing some relative strength.

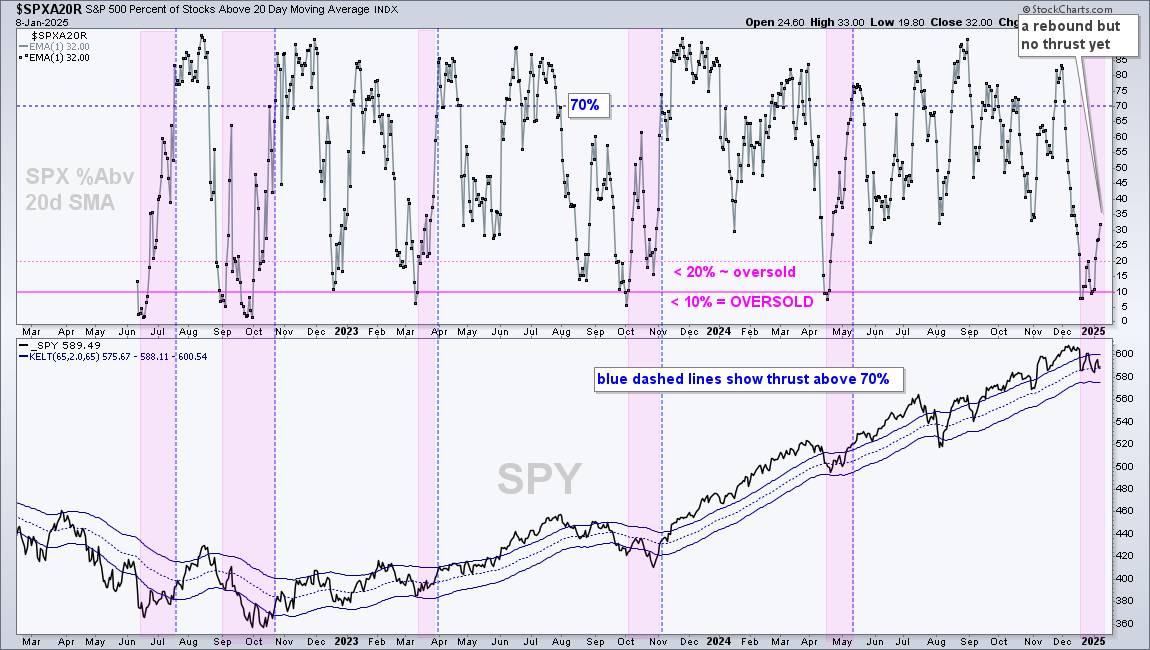
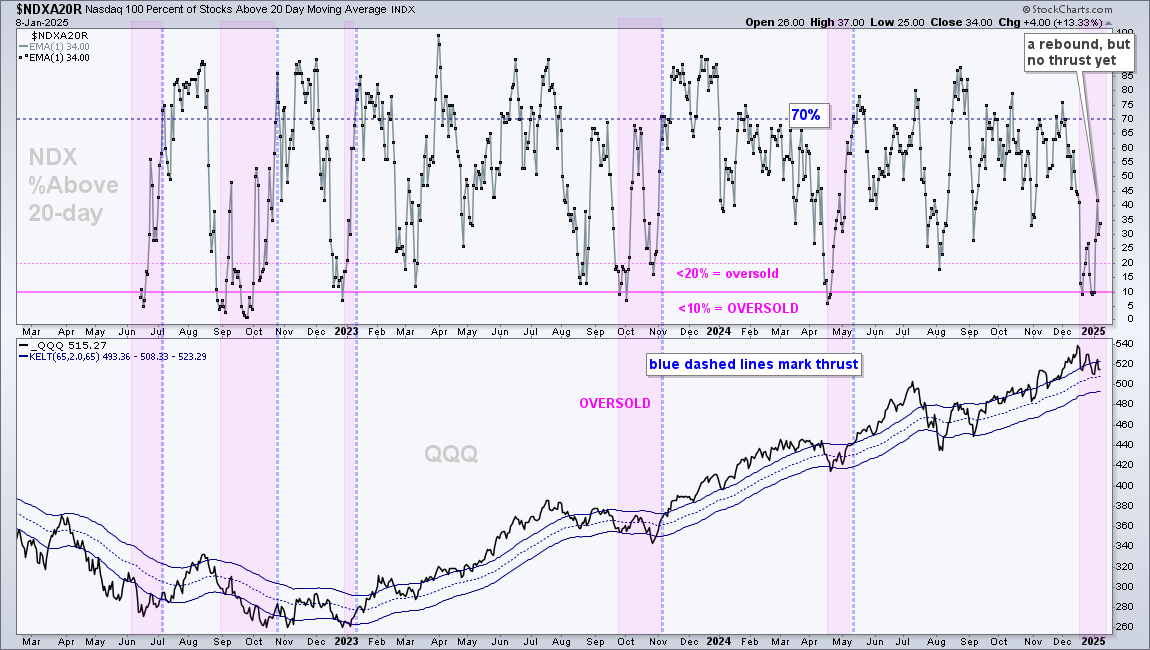
As noted on Tuesday, I am watching S&P 500 Percent Above 20-day SMA ($SPXA20R) and Nasdaq 100 Percent Above 20-day SMA ($NDXA20R) for signs of an upside participation thrust. These needs to exceed 70% to signal a robust rebound. The charts below show these indicators for reference.

SPY Works its Way Higher

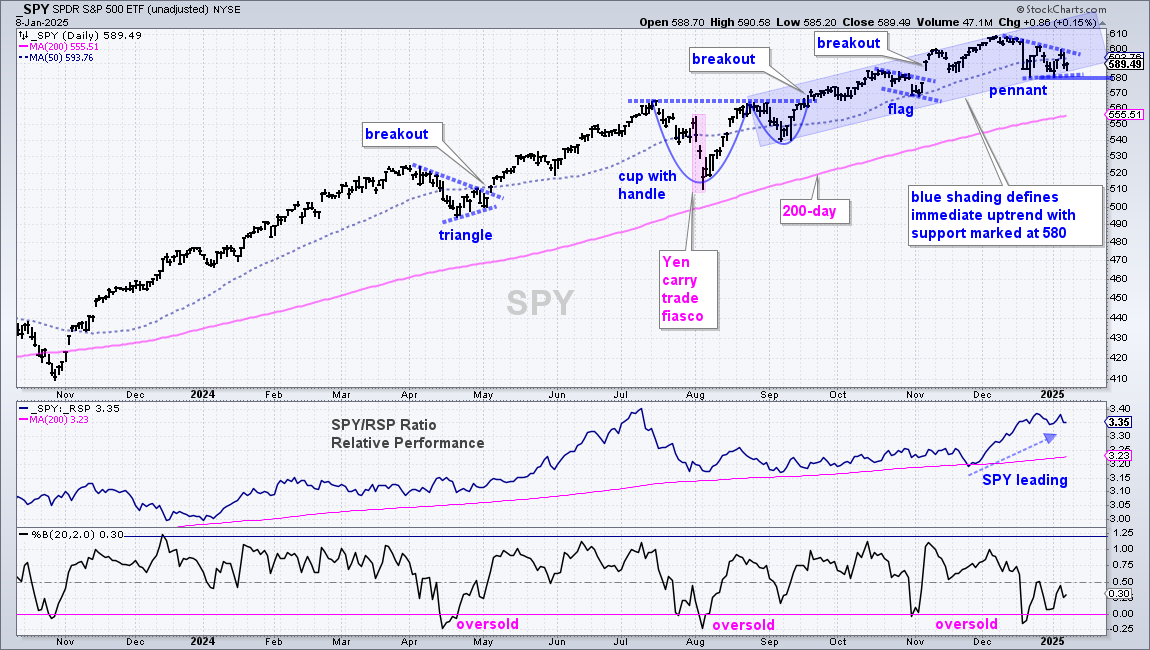
The blue shading defines the immediate uptrend, which kicked off with the cup-with-handle breakout in mid-September. Support is set at 580 and the bulls are clearly in control as long as this level holds. A break below 500 would argue for a correction back towards the rising 200-day SMA. Shorter-term, SPY formed a pennant as it oscillated around the 50-day SMA. Pennants are short-term continuation patterns that get their bias from the prior move, which was up. This pennant is a bullish continuation pattern and a breakout at 600 would be bullish. This setup is valid as long as 580 holds.

QQQ also Works its Way Higher

The blue shading defines the immediate uptrend, which kicked off with the triangle breakout in mid-September. Support is set at 500 and the bulls are clearly in control as long as this level holds. A break below 500 would argue for a correction back towards the rising 200-day SMA. Shorter-term, QQQ formed a pennant and broke the support line with a pop on Monday. The ETF fell back over the last two days, but I attribute this to news cycle noise. Pennants are short-term continuation patterns that get their bias from the prior move, which was up. This pennant is a bullish continuation pattern that is in play as long as 500 holds.

The next charts shows XLK and MAGS with similar setups.

RSP Holds the Key to Broader Market

The S&P 500 EW ETF (RSP) consolidated the last three weeks with clear support and resistance levels that will help determine the next move for stocks overall. First, RSP remains in a long-term uptrend with a 52-week high in early December and price above the rising 200-day SMA. RSP fell sharply in December, became oversold as %B dipped below 0 and then firmed near a Bullish Setup Zone. The 50% retracement, broken resistance turned support and rising 200-day mark this zone (blue shading). This zone is where we can expect firming after a pullback and a possible upside reversal. The battle lines are drawn with the three week consolidation. A breakout at 179 would be bullish, while a break below 173 would be bearish. RSP represents the “average” stock in the S&P 500 so the direction of the break will have consequences for the broader market (mid-caps and small-caps).

The next charts show MDY, IJR, IWM and XLF, KRE and KIE with similar setups. As noted before, small-caps are more sensitive to interest rates and the recent rise in the 10-yr Treasury Yield is weighing.

Flag/Pennant Breakouts (CIBR, FINX, XLC, SKYY, IHI, AMLP)

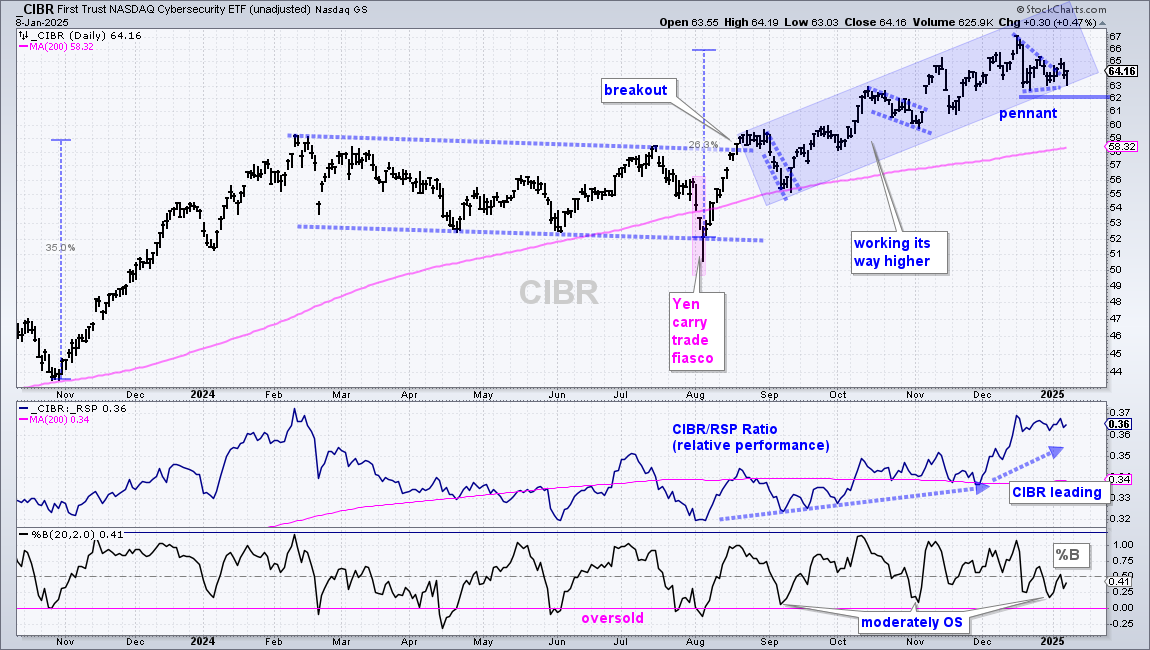
A number of ETFs are in clear uptrends, but they stalled or fell back over the last few weeks. They formed small bullish continuation patterns, such as flags or pennants. These represent a pullback or consolidation within the bigger uptrend and breakouts are bullish. The first chart shows the Cybersecurity ETF (CIBR) with the blue shading defining the immediate uptrend. Support is set at 62 and the bulls are in control as long as this level holds. A pennant (small triangle) formed in the second half of December and CIBR broke the upper line with a surge on Monday. The ETF fell back over the last two days, but the pattern remains in play, and bullish as long as 62 holds.

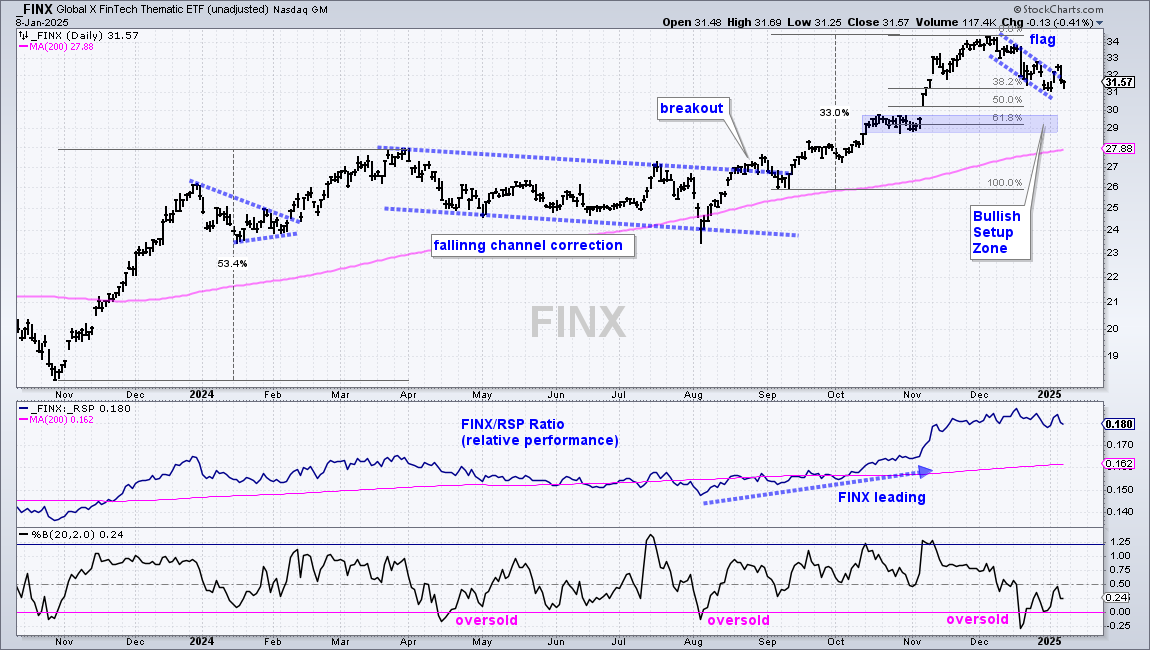
The next chart shows the FinTech ETF (FINX) with a flag breakout on Monday and pullback the last two days.

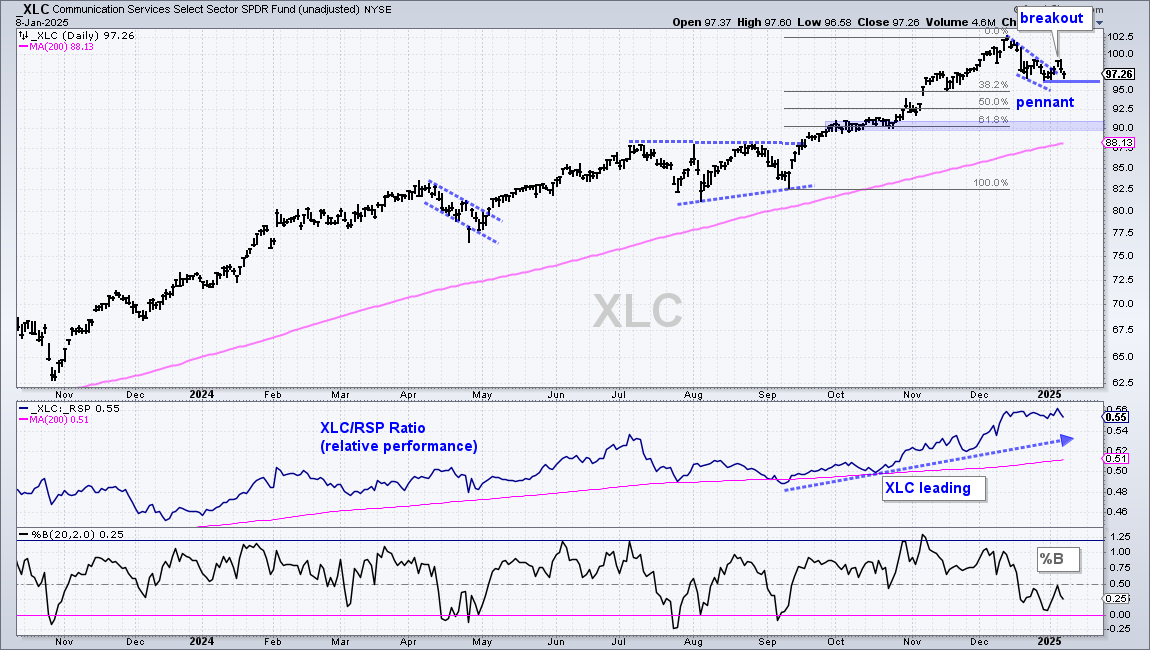
The next chart shows the Communication Services SPDR (XLC) with a pennant breakout on Monday and pullback the last two days.

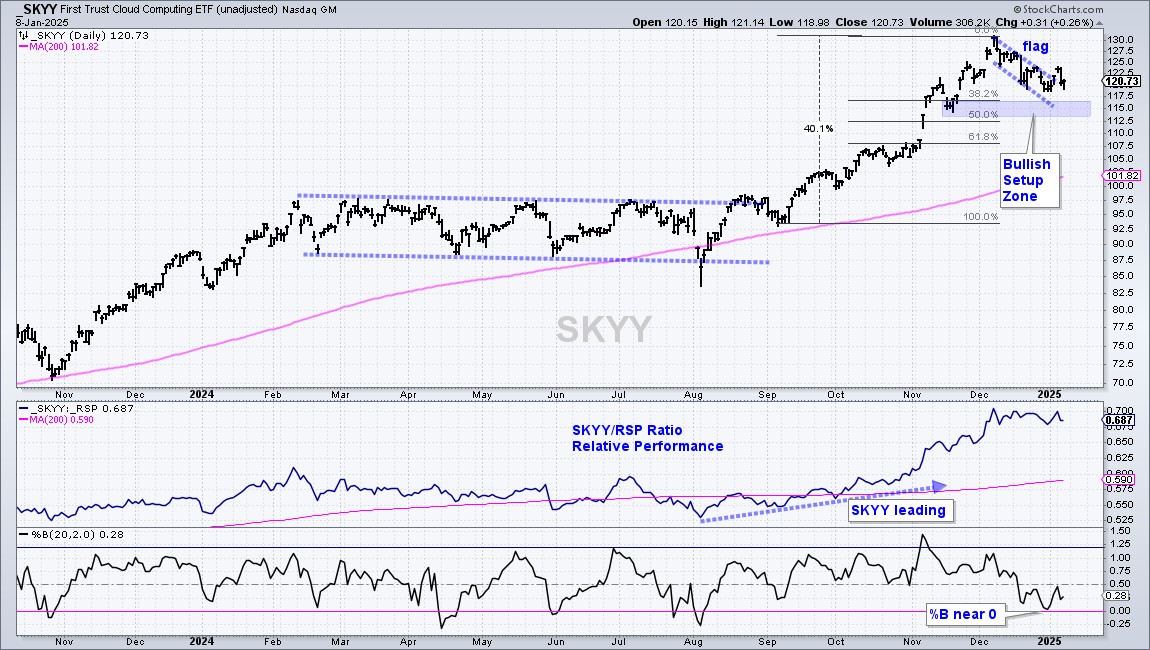
The next image shows the Cloud Computing ETF (SKYY) with a flag breakout and two day pullback after the breakout.

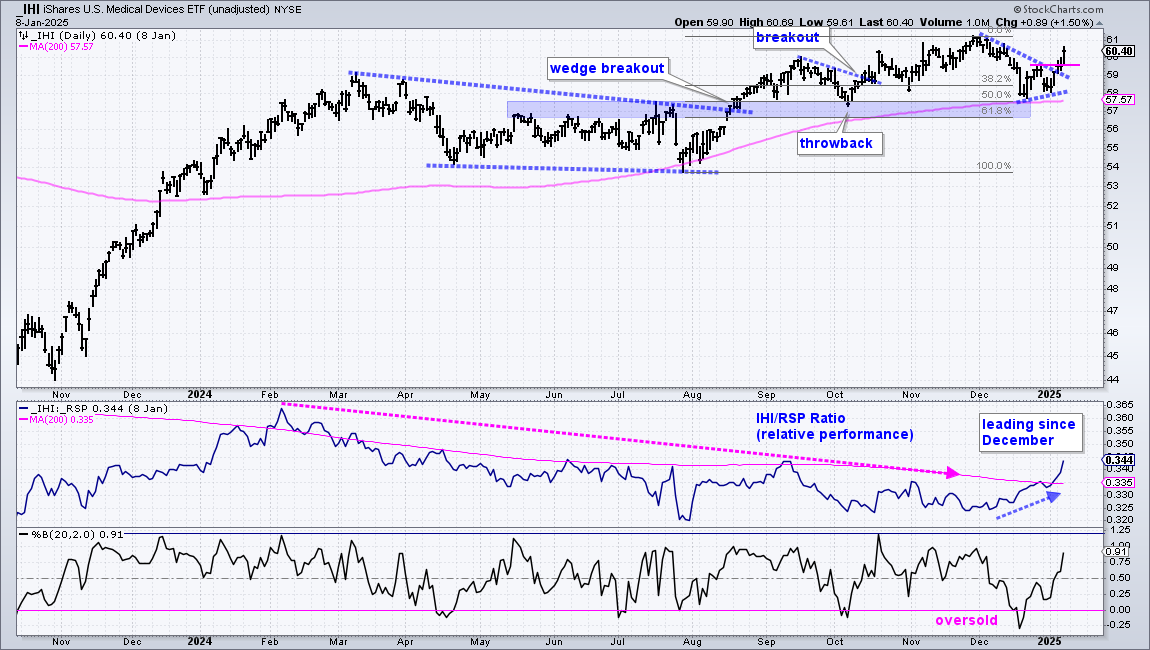
The next image shows the Medical Devices ETF (IHI) with a pennant breakout and continued strength the last two days. IHI is also leading since December as the price-relative moved above its 200-day SMA this year.

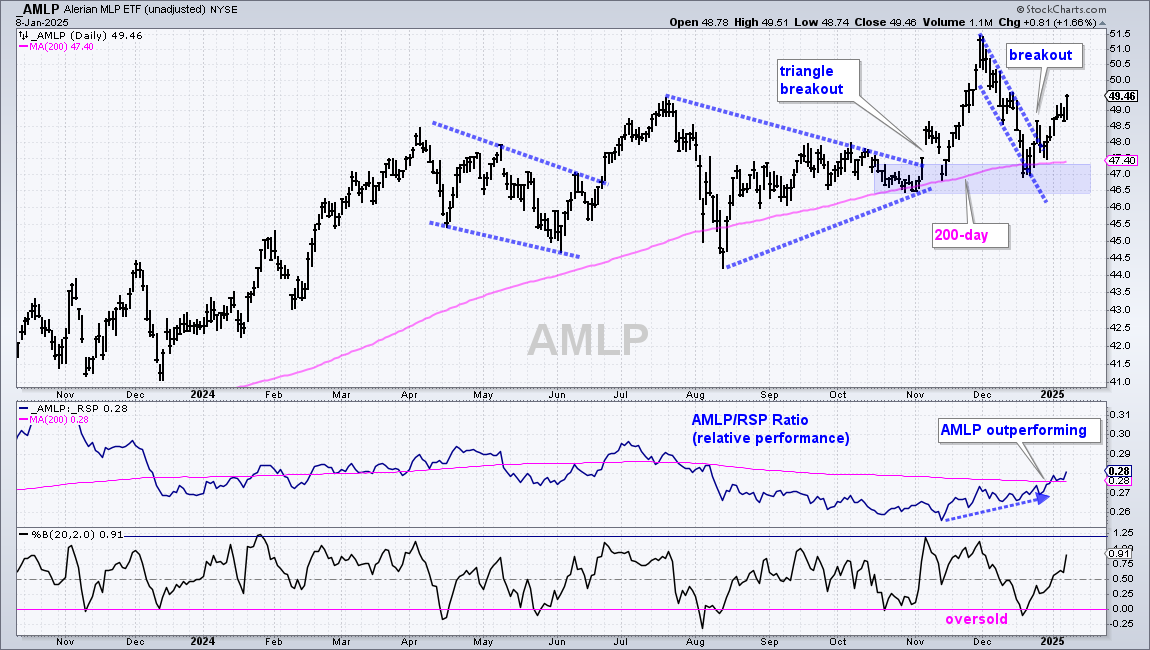
The next image shows the MLP ETF (AMLP) with a rather sharp pullback in December and a channel breakout in late December. AMLP extended higher in January and the AMLP/RSP ratio moved above its 200-day SMA (relative strength).

Falling Wedge/Channel Patterns (XLI, ITA, IGV, CLOU)

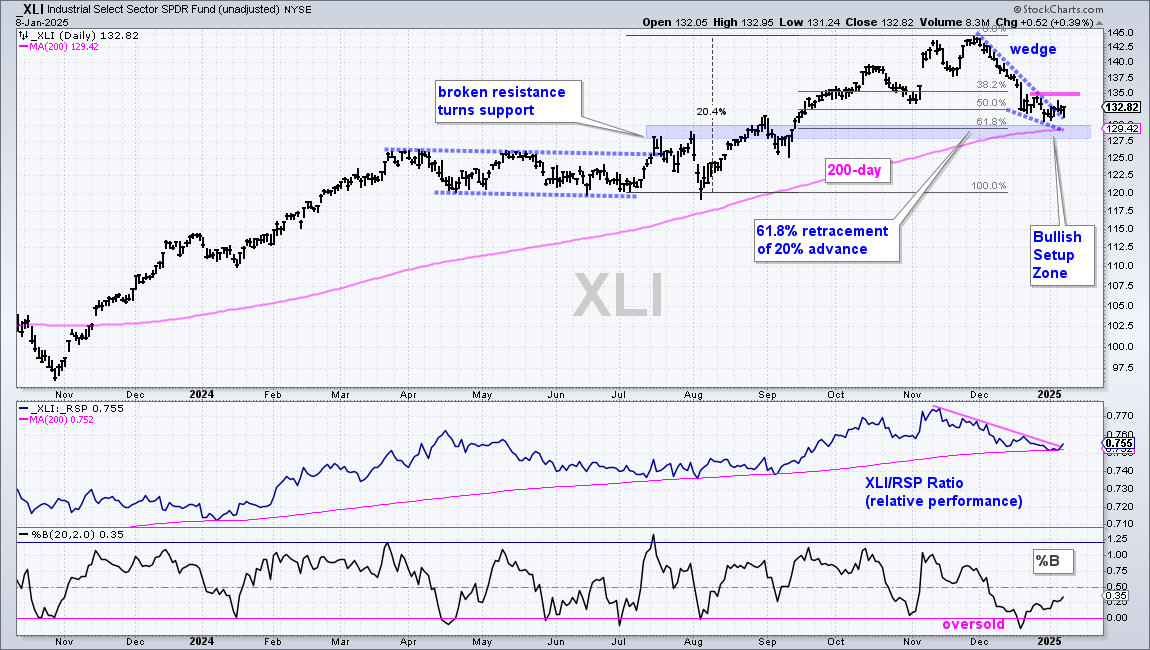
The next four ETFs pulled back in December and have yet to reverse these pullbacks with breakouts. All are in long-term uptrends with new highs in November or December and price above the 200-day SMA. The first chart shows XLI trading near a Bullish Setup Zone. The blue shading marks broken resistance turned support, the 61.8% retracement and the rising 200-day SMA. %B also became oversold in mid December. XLI is firming, but remains short of a breakout. Resistance is set at 135 and a breakout here would be bullish. This would be positive for the market.

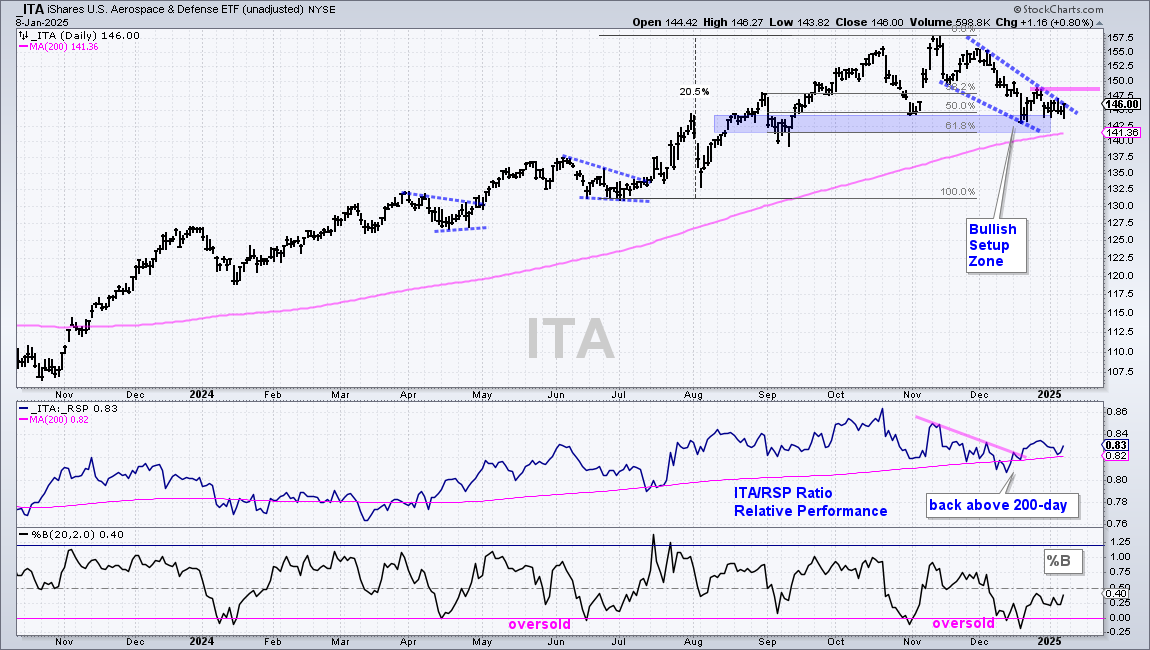
The next chart shows the Aerospace & Defense ETF (ITA) with a similar setup.

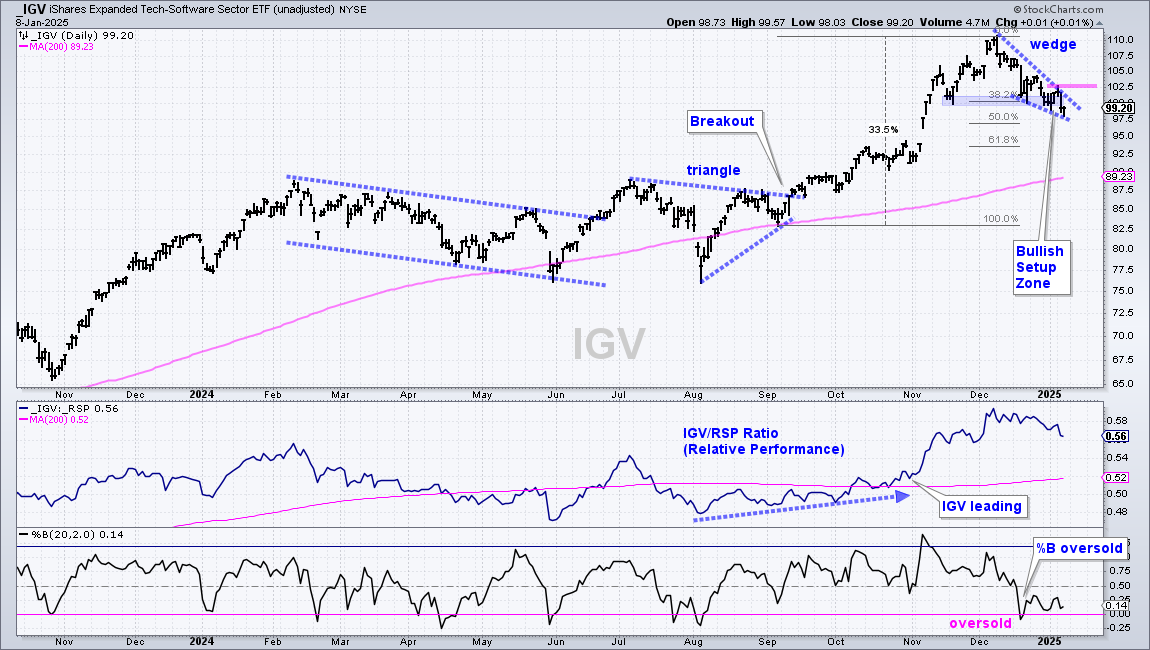
The next chart shows the Software ETF (IGV) with a falling wedge and resistance marked at 103.

The next chart shows the Cloud Computing ETF (CLOU) with falling wedge resistance at 24.80.

Semiconductor ETFs Fall Back after Breakouts

The Semiconductor ETF (SMH) broke its December highs with a surge on Monday and then fell back with the rest of the market over the last two days. I am not ready to call this breakout a failure and view the cup as half full. We need to allow some wiggle room, especially with the crazy news flow, which is unlikely to stop. Overall, the triangle breakout is the dominant pattern and this breakout held, as did the 200-day SMA. The bulls get the benefit of the doubt as long as 235 holds.

The Semiconductor ETF (SOXX) is not as strong as SMH, but it has a breakout working as well. First, the triangle breakout in mid September did not hold as SOXX broke support in mid November. The  ETF did not fall apart, but did remain below its 200-day SMA until early January. With a surge on Monday, SOXX broke the mid December high and 200-day SMA. This move reverses the downswing from mid October to December. I am setting support at 210.  

Gold SPDR Forms Bullish Triangle (GLD)

The Gold SPDR (GLD) is forming a triangle consolidation within a long-term uptrend. GLD hit a new high in late October and then corrected with a triangle the last two months. The swing within the triangled turned down with a sharp decline in mid December, but GLD firmed around 240 and broke short-term resistance with a bounce the last two days. The swing within the triangle is now up and this increases the chances for a bigger breakout at 250. Also notice that there were two oversold readings as %B dipped below 0 in mid November and mid December.

IBIT Falls Back after Pennant Breakout

The Bitcoin ETF (IBIT) doubled from early September to mid December and then fell back into yearend. The ability to double in three months tells us that this is one volatile ETF. Be prepared for a wild ride. A pennant formed with the pullback into late December and IBIT broke out with a surge above 55 to start the year. This surge is already faltering as IBIT fell back the last two days. The ETF has support from the pennant lows so the first test is at hand. A break below 52 would argue for a deep pullback, perhaps to the 50% retracement line.

Thanks for tuning in and have a great day!

Levels to Watch for Breadth Thrusts, Small-caps Fail at Breakout Attempt, Semiconductor ETFs Break Out

Today’s report will show the deterioration in long-term breadth and the key levels to watch for short-term breadth. We will then review the breakout in the 10-yr Yield and breakdown in the Home Construction ETF. Attention then turns to the key levels for SPY, QQQ and a number of important ETFs. We close with the breakouts in the semiconductor ETFs (SMH and SOXX).

Levels to Watch for Breadth Thrusts, Small-caps Fail at Breakout Attempt, Semiconductor ETFs Break Out Read More »

Video – Breadth Stays Oversold, Large-caps and Techs Lead, Small and Mids Lag, Lots of Pullbacks within Bigger Uptrends

Today’s video starts with the long-term breadth indicators to establish the market regime. Short-term breadth became oversold and remains oversold after a weak bounce. We will set the level needed for a bullish thrust. Large-caps and techs are leading, while mid-caps and small-caps feel the heat from rising rates. A rough December produced pullbacks and many ETFs are trading in bullish setup zones. We cover these and identify short-term resistance going forward.

Video – Breadth Stays Oversold, Large-caps and Techs Lead, Small and Mids Lag, Lots of Pullbacks within Bigger Uptrends Read More »

A Rough December, Pullbacks within Uptrends, Marking Setup Zones and Resistance, Gold, Bitcoin and China

Today’s report starts with average stocks (equal-weight, mid-caps and small-caps). These groups fell rather sharply in December and gave back their November gains. They have fallen and cannot get back up. Many are trading near bullish setups zones, but remain short of breakouts needed to reverse the short-term pullbacks. We will set the key levels to watch for a dozen ETFs with setups. Attention then turns to gold, Bitcoin and China.

A Rough December, Pullbacks within Uptrends, Marking Setup Zones and Resistance, Gold, Bitcoin and China Read More »

Warning Signs vs Weight of the Evidence, Oversold Double Dip, Leading Tech, SMH Holds Triangle Breakout

Some warning signs appeared in December, but the weight of the evidence remains bullish. We will start with the long-term breadth indicators and then show the oversold conditions in the short-term breadth indicators. SPY and QQQ are still in long-term uptrends and testing their 50-day SMAs. Meanwhile, tech-related ETFs are leading as SMH holds its 200-day SMA.

Warning Signs vs Weight of the Evidence, Oversold Double Dip, Leading Tech, SMH Holds Triangle Breakout Read More »

Weighing Breadth, Yield Spreads and Trends, Warning Signs, Corrections, Breadth for Short-term Signals

Today’s report will highlight the warning signs over the last few weeks and assess the evidence (bull or bear market). Corrections are normal, but what might a normal correction entail? We will review the long-term breadth indicators, yield spreads and the weekly charts for SPY and QQQ, including correction targets. This report ends with two short-term breadth indicators to watch for a bullish signal.

Weighing Breadth, Yield Spreads and Trends, Warning Signs, Corrections, Breadth for Short-term Signals Read More »

10-yr Yield Breads 40-wk, Similarities with Summer 2022, SPX Becomes Oversold, What to Watch Now

The 10-yr Treasury Yield surged before, and after, the Fed statement. While interest rates are not the only factor affecting stocks, they are the focus right now and we will cover the relationship. S&P 500 stocks are oversold after a 3-week decline and these conditions could lead to a bounce. We will show how to distinguish between a strong bounce and a dead-cat bounce.

10-yr Yield Breads 40-wk, Similarities with Summer 2022, SPX Becomes Oversold, What to Watch Now Read More »

Video – Breadth, Yield Spreads, TLT, GLD, BTC, SPY, QQQ, MAGS, ITB, KBE, ITA, LIT, FXI and Follow Up for 14 Stocks

Today’s video starts with the deterioration in short-term breadth. Even so, long-term breadth remains net bullish and yield spreads narrow. We then address the surge in the 10-yr yields, weakness in small-caps and the break down in Home Construction ETF. There are setups in the Bank and Defense ETFs, while the Lithium and China ETFs fell back into their consolidations. We close with follow up on fourteen recently featured stocks.

Video – Breadth, Yield Spreads, TLT, GLD, BTC, SPY, QQQ, MAGS, ITB, KBE, ITA, LIT, FXI and Follow Up for 14 Stocks Read More »

Stocks Pullback, Yields Surge, Housing Hit, QQQ Leads, A Setup in Defense, Two Bullish Cloud Stocks

Today’s report starts with an overview of short-term break (weak) and long-term breadth (still bullish). QQQ is leading with a new high, but small-caps breadth is holding up as IJR forms a bullish wedge. We then look at the housing failure, weakness in hard assets, a wedge in gold, a bullish setup in a defense ETF and two cloud stocks with bullish charts.

Stocks Pullback, Yields Surge, Housing Hit, QQQ Leads, A Setup in Defense, Two Bullish Cloud Stocks Read More »

A Leader in Medical Devices, NVDA Stalls above Breakout, SMH Holds Support, CIBR and 3 Stocks

Today’s report covers a leading stock in the Medical Devices ETF (IHI), which is the strongest group with the Healthcare sector. We then analyze NVDA as it consolidates above the October breakout and shows the SMH chart. Attention then turns to the Cybersecurity group with three stocks forming short-term consolidations.

A Leader in Medical Devices, NVDA Stalls above Breakout, SMH Holds Support, CIBR and 3 Stocks Read More »

Video – Breadth, Yield Spreads, SPY, QQQ, IWM, XLV, XLP, CLOU, CIBR, SOXX, SMH, ITB, XHB, LIT, GLD, SLV and Eight Stocks

Today’s video starts with long-term breadth, yield spreads and the major index ETFs to define the broad market environment. We then focus on short-term weakness and the pullbacks in RSP, IWM and MDY. Some tech ETFs are very extended and a key group continues to lag. Housing ETFs are testing support, while gold and silver hold their breakouts. We finish with follow up for eight stocks.

Video – Breadth, Yield Spreads, SPY, QQQ, IWM, XLV, XLP, CLOU, CIBR, SOXX, SMH, ITB, XHB, LIT, GLD, SLV and Eight Stocks Read More »

Breadth and RSP Signal Pullback, Two Housing ETFs Set Up, Extended Tech ETFs, Two Stock Setups

Today’s report starts with the Advance-Decline Percent indicators to measure participation over the last two weeks. We then turn to the S&P 500 EW ETF to define the current pullback, as well as two housing-related ETFs. Some tech stocks are looking extended and we offer detailed analysis of the Cybersecurity ETF (CIBR). We close with bullish setups in an animal healthcare stock and a business software stock.

Breadth and RSP Signal Pullback, Two Housing ETFs Set Up, Extended Tech ETFs, Two Stock Setups Read More »

SPX/NDX Breadth, Yield Spreads, SPY/QQQ Trends, MAG7 Leads and Small-caps Try to Lead

Today’s report will cover the broad market environment. We start with the long-term breadth indicators for the S&P 500 and Nasdaq 100 (%Above 200-day, %Above 150-day, High-Low Percent). Attention then turns to the BBB yield spread and long-term chart analysis for SPY and QQQ. QQQ found its mojo as the MAG7 ETF leads. Mid-caps are lagging, micro-caps are leading the small-caps are mixed.

SPX/NDX Breadth, Yield Spreads, SPY/QQQ Trends, MAG7 Leads and Small-caps Try to Lead Read More »

5 Stocks: Tight Bullish Wedges, A Bullish Setup Zone, A Breakout Leader and One Near a Prior Breakout Level – Plus XLV and XBI (Premium)

Today’s report starts with a defense stock and a fintech stock forming tight wedges. After reviewing the rebounds in the Healthcare and Biotech ETFs, we then focus on two biopharma stocks: one testing a Bullish Setup Zone and the other with a leading breakout. And finally, we feature an under-the-radar tech stock trading near its breakout point from late October.

5 Stocks: Tight Bullish Wedges, A Bullish Setup Zone, A Breakout Leader and One Near a Prior Breakout Level – Plus XLV and XBI (Premium) Read More »

Plunge in 10yr Yield Triggers Home Builders – Analyzing ITB and Five Stocks (Premium)

Today’s report analyzes the move in the 10-yr Treasury Yield, the surge in ITB and five home builder stocks. Home Builders were lagging the last few months, but the declines look like normal corrections. The retracements were normal and some surged off bullish setup zones. In addition, we are seeing a momentum thrust in %B.

Plunge in 10yr Yield Triggers Home Builders – Analyzing ITB and Five Stocks (Premium) Read More »

Chart Trader – Biotech Oversold, MLPs Surge, Lithium Consolidates, Uranium Breaks Out, Two Leading Stocks and Two with Pullbacks (Premium)

Today’s report starts with some of the leading ETFs in strong uptrends – but without setups. These include software (IGV), fintech (FINX) and finance (XLF). Attention then turns to some oversold setups in Healthcare and Biotech, and the group’s leader (Medical Devices). MLPs are breaking out within the Energy sector and we are seeing two commodity ETFs strengthen (Uranium and Lithium). Turning to stocks, we have two breakout leaders (TJX, VRSK) and two former leaders with pullbacks (AVGO, UHS).

Chart Trader – Biotech Oversold, MLPs Surge, Lithium Consolidates, Uranium Breaks Out, Two Leading Stocks and Two with Pullbacks (Premium) Read More »

Chart Trader – QQQ Pulls Back, Using %B, Smalls Return to Breakout, Banks Lead, Cybersecurity Tests 50-day, Robotics hold Breakout (Premium)

This report covers recent pullbacks in the major index ETFs (SPY, QQQ, MDY and IJR). Financials are a key driver for small-caps and I will show a leading uptrend in the Bank SPDR (KBE). We will then cover the breakout in the Robotics & AI ETF (BOTZ) and the pullback in the Cybersecurity ETF (CIBR).

Chart Trader – QQQ Pulls Back, Using %B, Smalls Return to Breakout, Banks Lead, Cybersecurity Tests 50-day, Robotics hold Breakout (Premium) Read More »

Chart Trader Weekly Report – Broad Market Analysis, Leading Groups (ETFs), Chart Setups and Trading Ideas (Premium)

Stocks went on a tear the last eight days, but most of these moves were simply extensions of existing uptrends. Nevertheless, many stocks and ETFs became very overbought short-term. These include KBE, IGV, SKYY, FINX and CIBR. We also see the market pricing in policy shifts in Healthcare (XLV) and Defense (ITA), as well as the prospects of tariffs (CPER, DBB). Despite overbought conditions, it is a bull market we will highlight three stocks setting up: DDOG, CSX and CCEP.

Chart Trader Weekly Report – Broad Market Analysis, Leading Groups (ETFs), Chart Setups and Trading Ideas (Premium) Read More »

Chart Trader Weekly Report – Broad Market Analysis, Leading Groups (ETFs), Chart Setups and Trading Ideas (Premium)

The election has come and gone, and the market trends remain the same. The major index ETFs were in uptrends well before the election, breadth was strong throughout September-October and yield spreads showed confidence. This broad market trio was, and is, bullish. Tech-related ETFs extended on their breakouts and we will feature three AI stocks. Commodities were all over the place so we will revisit industrial metals and copper. Analysis includes VRTX, FCX, COPX and DBA.

Chart Trader Weekly Report – Broad Market Analysis, Leading Groups (ETFs), Chart Setups and Trading Ideas (Premium) Read More »

Chart Trader Weekly Report – Broad Market Analysis, Leading Groups (ETFs), Chart Setups and Trading Ideas (Premium)

The weight of the evidence remains bullish for stocks, but a correction is underway as Treasury yields surge and semiconductors weigh on the largest sector. Semis account for 35.57% of the Technology SPDR and this sector accounts for 32.24% of the S&P 500. We will review the long-term breadth indicators and show some short-term breadth indicators to watch for oversold conditions. Names hitting bullish setup zones include XLV, GEHC, AMGN, ITA, INDA, CPER and COPX.

Chart Trader Weekly Report – Broad Market Analysis, Leading Groups (ETFs), Chart Setups and Trading Ideas (Premium) Read More »

Scroll to Top