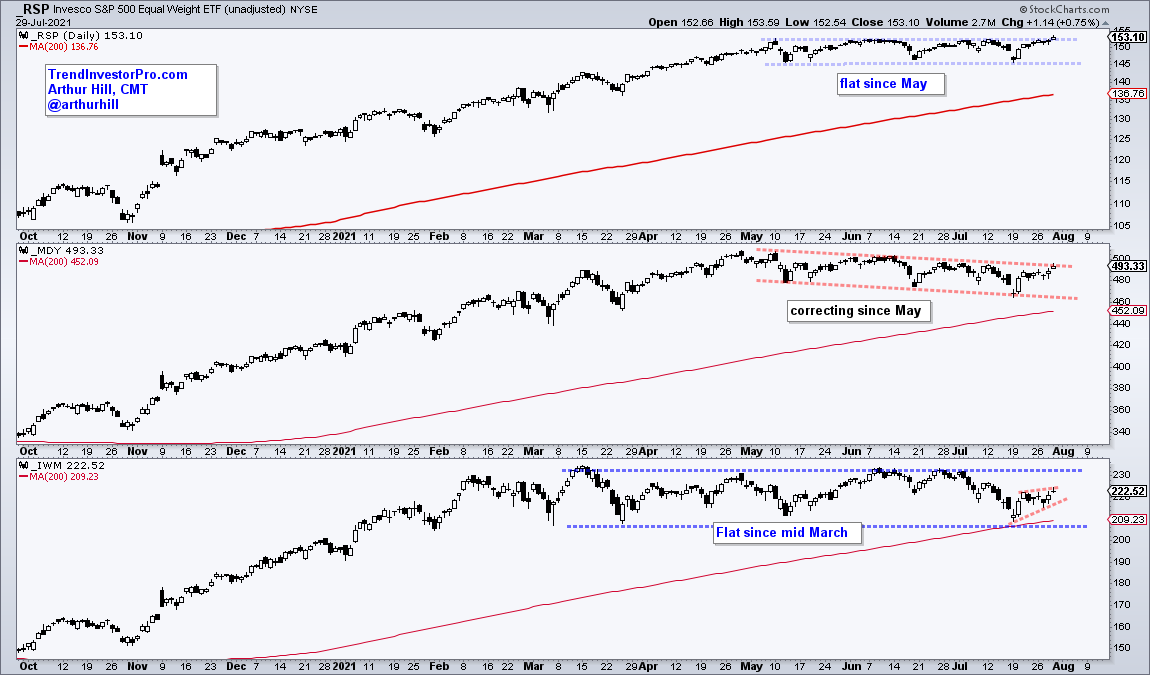
As noted on Thursday, the S&P 500 SPDR (SPY) is in a clear uptrend and price action remains bullish. The concerns start when we look under the surface and move down in market cap. The S&P 500 hit a new high this week and yet less than 60% of SPX stocks are above their 50-day SMAs. The S&P 500 EW ETF (RSP) eked out a new high this week, but the Russell 2000 ETF (IWM) peaked way back in March and remains around 5% below this high. IWM is bouncing off support, but I would watch this bounce closely because a small bearish wedge could be forming (red lines) and a break below 480 would argue for a move below the rising 200-day.
There are always concerns out there and there is always something to be worried about in the markets. This is why bull markets climb a wall of worry. The trick, I think, is to identify the point when concerns turn into signals. By the way, I can also add very weak seasonal patterns in August and September to the list of concerns. Click here for details. As far as an actual signal, I am watching three breadth indicators. Two of the three have been bullish since mid April 2020 and all three have been bullish since late May 2020. Bearish signals from two of the three would point to a correction in the S&P 500.
Percentage of SPX Stocks with Silver Crosses
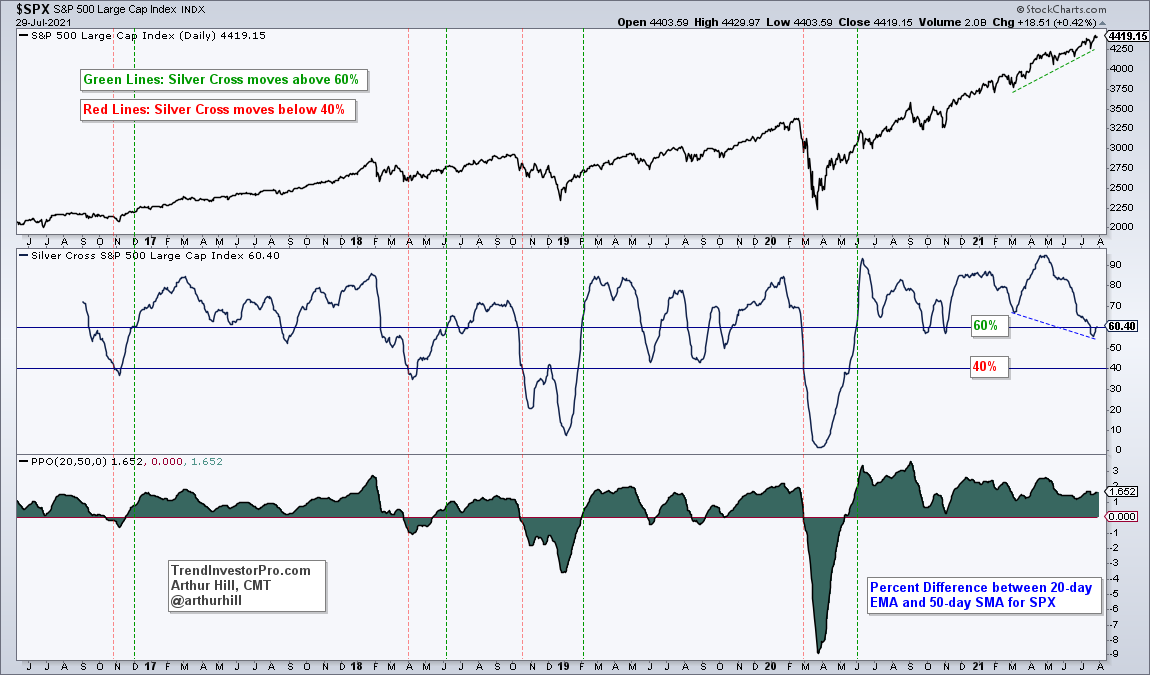
The first indicator shows the percent of S&P 500 stocks with a silver cross (20-day EMA above 50-day EMA). A cross above 60% is bullish, while a cross below 40% is bearish. The bullish/bearish thresholds are set just above/below the 50% line to reduce whipsaws. There were four sell signals since late 2016 (red lines). Two resulted in whipsaws (late October 2016, early April 2018) and two foreshadowed decent declines (mid October 2018, early March 2020).
The indicator is currently flirting with the 60% level, which is a level that gave way to bounces in September-October. However, the S&P 500 is near a new high and %SilverCross is below its early March low (blue line). This shows a lot less participation on the recent run to new highs. A break below 40% would tip the balance to the bears and argue for a correction in the S&P 500.
S&P 500 High-Low Line
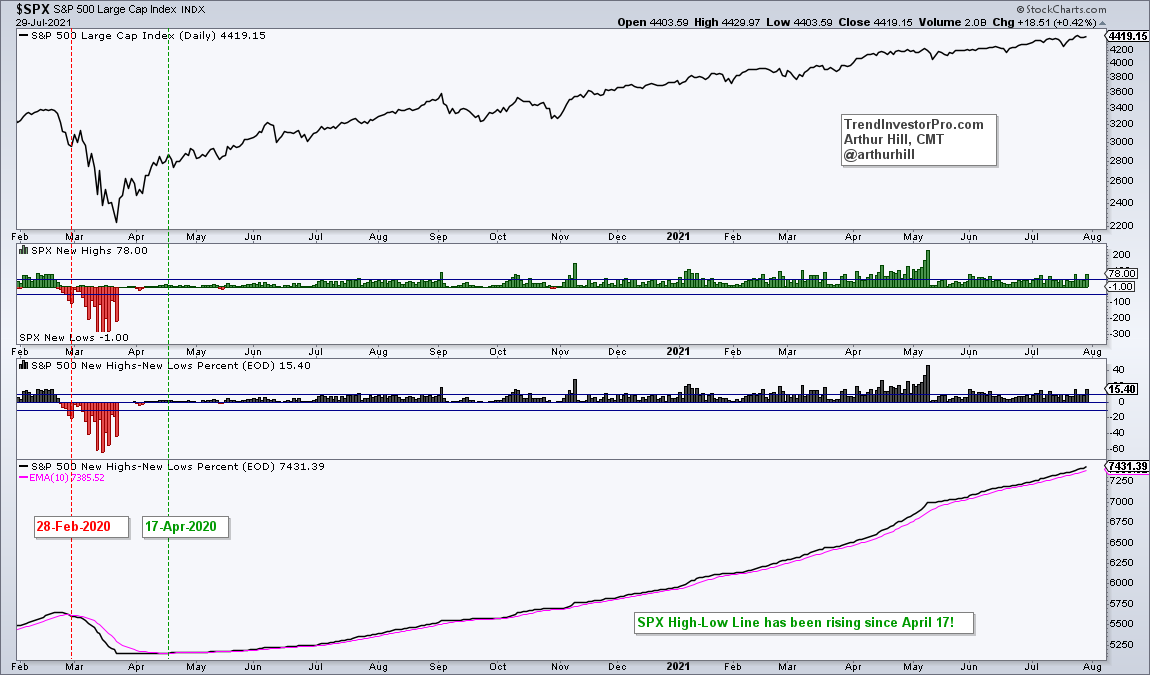
The next indicator is the High-Low Line relative to its 10-day EMA. The chart below shows the S&P 500 in the top window, new highs/lows in the second window and High-Low Percent in the third window. High-Low Percent is new highs less new lows divided by total issues. The bottom window show the High-Low Line, which is a cumulative measure of High-Low Percent. It rises as long as new highs outpace new lows and falls when new lows outpace new highs.
The High-Low Line turned down and broke its 10-day EMA on February 28th, which provided a timely warning for a correction. Of course, the March 2020 decline was more than a correction. The High-Low Line then turned up and crossed above its 10-day EMA on April 17th. The High-Low Line has been above its 10-day EMA ever since (15+ months). It even held during the September-October correction. A break below the 10-day EMA would show an uptick in new lows and point to a correction in the S&P 500.
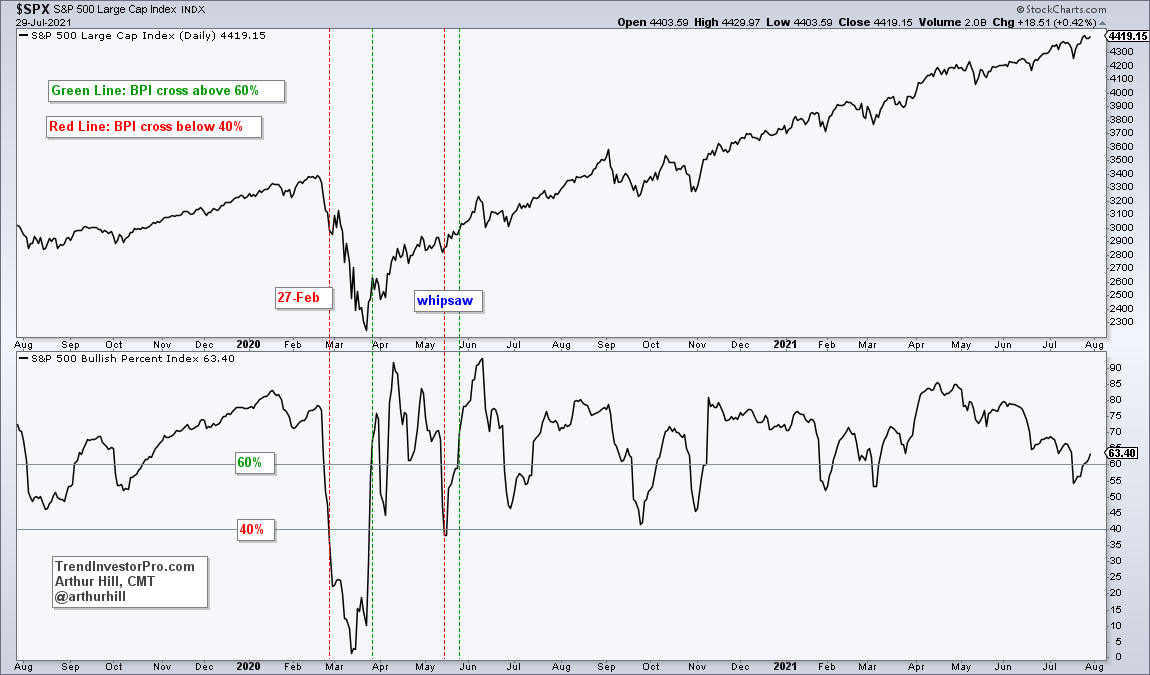
SPX Bullish Percent Index
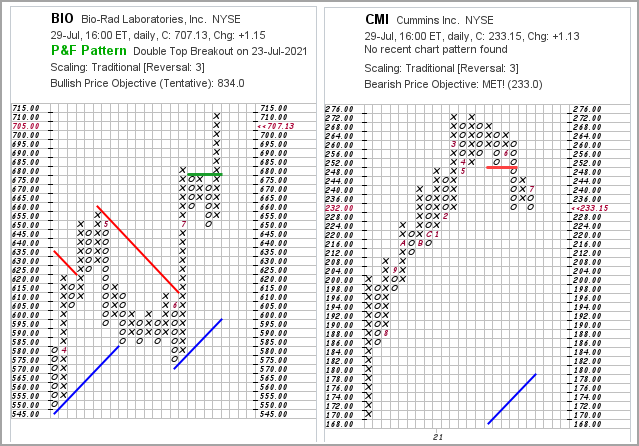
The next indicator is the S&P 500 Bullish Percent Index ($BPSPX). This indicator measures the percentage of S&P 500 stocks with Point & Figure buy signals (double top breakout). This occurs when the X-column exceeds the high of the prior X-column and represents a higher high (see BIO chart below). Note that a stock has either a double top breakout or a double bottom breakdown, which occurs when the O-column breaks the low of the prior O-column (see CMI chart below). Thus, a Bullish Percent Index reading of 63.40% means 63.40% of stocks have P&F double top breakouts and 37.6% have P&F double bottom breakdowns.
As with %SilverCross, the bullish threshold is set at 60% and the bearish threshold at 40%. There were just four signals over the last two years. A timely bearish signal on 27-February-2020 and a timely bullish signal on 26-March-2020. The May bearish signal resulted in a whipsaw because it was quickly reversed. A move below 40% would turn this indicator bearish.
")