Timing Models – Small-caps Poised to Outperform, GLD Divorces TLT, Breadth Models Improve, Yield Spreads Continue to Narrow

Use CRTL+P to Print

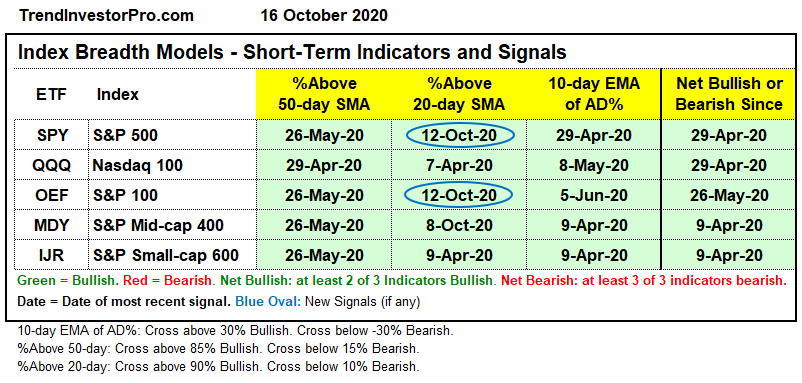
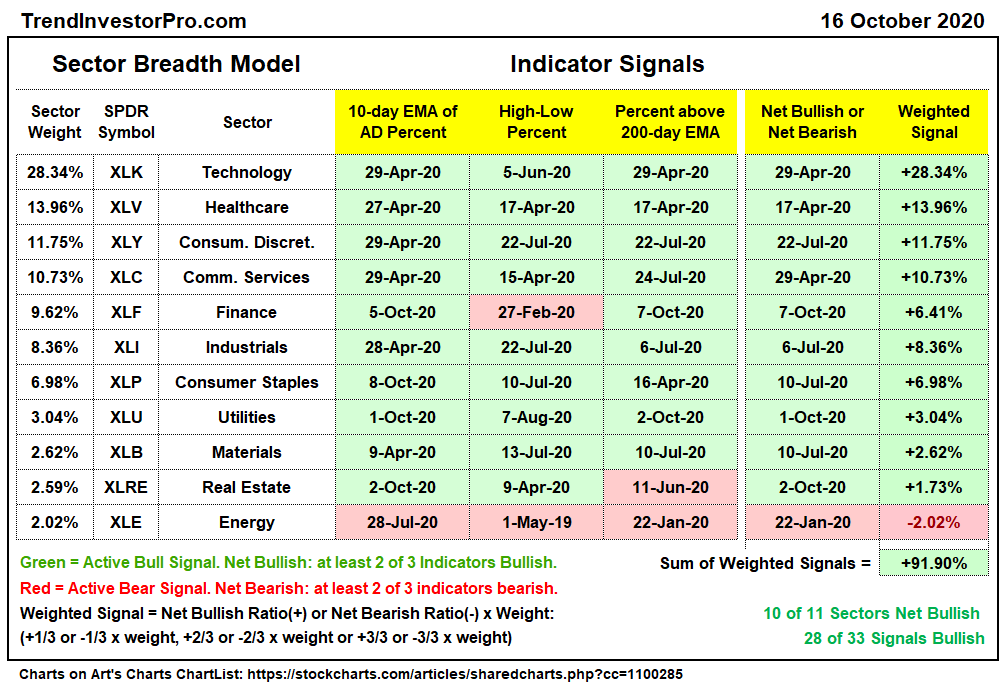
Today we will start with small-caps, industrials and banks, because these three could be turning the corner. The IWM:SPY ratio moved above its 40-week SMA for the first time in 2 years, XLI is above the 200-day and KRE rose from the ashes the last four weeks. GLD may be parting ways with TLT and hooking up with SPY again. The breadth models remain bullish and there were two new signals in the short-term breadth models. The sector breadth model also remains firmly bullish with the newest signals coming in XLF and XLU, which are the feature charts. In a perhaps related move, yield spreads narrowed the last four weeks and this could be wetting the risk appetite. The commentary concludes with the five breadth model charts.

Small-caps Make a Run for It

Last week we saw a broadening of strength with breadth thrusts in several sectors, small-caps and mid-caps. Breadth thrusts continued this week with the S&P 500 and S&P 100 joining the fray. The broadening of participation could bode well for sectors that lagged this year, such as finance and industrials.

First, let’s look at small-caps. The chart below shows the IWM:SPY ratio, which rises when small-caps outperform and falls when small-caps underperform. This ratio tanked from July 2018 to March 2020 as small-cap underperformance went to new lows, and large-cap outperformance to new highs.

There are signs that this ratio could be preparing for a bounce as it surged in April-May and flattened from July to October. Most recently we saw small-caps lead from 25-Sept to 12-Oct as IWM surged above its August-September high. SPY, on the other hand, has yet to clear its early September high. Turning back to the ratio, a break above the red line would show renewed outperformance from small-caps and this would be positive for IWM. Note that this ratio just broke the 40-week SMA this week.

The next chart shows the Industrials SPDR (XLI) consolidating above its 200-day (blue shading) and breaking out of this consolidation last week. The long-term trend is up and a consolidation breakout argues for a continuation of that trend. After a surge from 74 to 82, the ETF edged lower the last few days and a small bull flag formed. A breakout would argue for a continuation higher and a challenge to the February highs.

The bottom window shows the Regional Bank ETF (KRE) with a reversal near the 2/3 retracement line and break above the wedge line. I know that I have not been keen on banks because they are lagging on the six to nine month timeframes, but we need to keep an open mind (see XLF chart, Fed and yields spreads further down). KRE edged lower the last four days and a breakout at 40 could extend the move.

Don't Count SPY and QQQ Out Though

IWM may be poised to outperform, but SPY and QQQ are still leading year-to-date. These two recorded new highs in late August and early September. After falling wedge corrections that retraced almost 2/3 of the June-September advance, these two broke out and followed through on these breakouts. They have yet to exceed their early September highs, but the breakouts are bullish until proven otherwise. A move below 330 in SPY and 270 in QQQ would negate the breakouts and put the correction theme back on the table.

Stocks vs Bonds vs Gold

The Gold SPDR (GLD) may be divorcing itself from the 20+ Yr Treasury Bond ETF (TLT) and hooking up with the S&P 500 SPDR (SPY). GLD and TLT peaked in early August and fell with falling wedge patterns taking shape. TLT fell to its rising 200-day, but GLD held well above this moving average and turned up on 25-Sept (vertical line). This is also the day SPY bottomed and yield spreads began the narrow. It appears that GLD is making an attempt to break out of its falling wedge. TLT turned up the last six days, but remains short of a breakout. SPY also held well above its 200-day and broke out of a falling wedge on 25-Sept. Keep this date in mind because it returns later in this commentary.

The Future of ChartBooks

Chartbooks are great in theory, but challenging in practice. It is easy to publish a chartbook in Optuma because the charts are in one workbook and I simply click the publish button. Charts from StockCharts and Amibroker are a different story. They need to be saved as images, printed as PDF files and then compiled into a chartbook. This takes a lot of time,  time that could be better spent on analysis, videos and such. Basically, I am spending too much time maintaining and publishing ChartBooks. Furthermore, fewer than 20% of subscribers access these ChartBooks. Thus, I am reconsidering ChartBooks going forward. The idea here is to continue with the ETF ChartBook and ETF Ranking Tables on Thursdays and Saturdays, but discontinue other ChartBooks. Feedback would be greatly appreciated (click here for the contact form).

Short-term Models Improve with More Thrusts

The short-term breadth models improved this week as %Above 20-day SMA for the S&P 500 and S&P 100 surged above 90% to trigger bullish breadth thrusts. Yet more signs that participation is broad. These signals follow a bullish sign in MID %Above 20-day SMA last week. With three new signals in the last two weeks, all indicators on the short-term breadth model are bullish. Overall, four of the five indexes have been net bullish since April and the S&P 100 has been net bullish since May.

Long-term Models Still Favor Large-caps

Even though IWM could be poised for a relative breakout, large-caps are still stronger in the long-term breadth models. All five indexes are net bullish. The Nasdaq 100 kicked it off by turning bullish in May, the S&P 500 and S&P 100 followed in July, the S&P MidCap 400 in August and the S&P SmallCap 600 in September. The market rally was slow to broaden, but broaden it has: large-cap techs > large-caps > mid-caps > small-caps. Only two indicators remain bearish: %Above 100-day SMA for $MID and High-Low Percent for $SML.

The breadth models are shown further down. You can learn more about the breadth model and its historical performance in this article and video (here).

Sector Model Remains Firmly Bullish

There is no change in the Sector Breadth Model, which captures the sum of the parts for the S&P 500. The sum of the weighted signals is above +90% (out of 100%). 10 of 11 sectors are net bullish and 28 of 33 indicators are on active bullish signals. This shows broad strength within the S&P 500. Outside of Energy, the only pockets of weakness are XLF High-Low Percent and XLRE %Above 200-day EMA. REITs were once part of the Finance sector so perhaps there is some correlation here.

XLF and XLU Stall

The chart below shows the Finance SPDR (XLF) turning net bullish as the 10-day EMA of Advance-Decline Percent exceeded +30% and the %Above 200-day EMA exceeded 60% (green ovals). High-Low Percent remains with an active bearish signal from late February (red oval). A breakout on the price chart would likely lead to an expansion of new highs and High-Low Percent could then trigger with a move above +10%. XLF is still lagging on the six to nine month timeframes and has yet to exceed its summer highs. After a three week surge to the 200-day, XLF edged lower the last three days with a possible bull flag and a breakout could lead to a bigger triangle breakout.

The Utilities SPDR (XLU) turned net bullish on 2-Oct as the 10-day EMA of Advance-Decline Percent surged above +10% for a breadth thrust and %Above 200-day EMA exceeded 60%. Currently over 85% of utility stocks are above their 200-day EMA and High-Low Percent exceeded 10% this week. On the price chart, XLU broke out of a triangle pattern and exceeded its June high. The ETF stalled the last five days in what could be a short-term bull flag. A breakout would target a move towards 70.

Yield Spreads Narrow and Fed Balance Sheet Expands

Finance-related ETFs may be strengthening because yields spreads narrowed further and the Fed balance sheet continues to expand. The narrowing of yield spreads, which is especially prevalent in the BBB and junk bond spreads, shows more confidence in the debt markets. Investors are demanding less premium over Treasuries. This means investors are more confident that the debt will be repaid (or bought by the Fed!). Sorry, I could not resist that last jab.

The AAA and BBB yield spreads have been narrowing since 25-Sept (green circles). They were already below their pre-crisis highs and showing no signs of stress at the investment grade end of the debt market. With further narrowing, BBB spreads are their narrowest since 5-March.    

We can also see a significant narrowing in the junk bond spreads. Junk bond spreads moved below 5 this week and the CCC spread moved below 11 (green ovals).

The Fed balance sheet also expanded this past week with the biggest increase since late May ($77 billion). Thus, the slow expansion since mid July continues and is perhaps accelerating a little. Overall, the balance sheet is now within $15 trillion of its  mid June peak.

Large-caps Lead Moving Average Crossover Game

Below are the breadth model charts for each index. The 3-indicator short-term model is first, the 5-indicator long-term model is second and the percentage difference between the 5 and 200-day SMAs is third. As far as long-term trends, QQQ has been positive since 14-Apr, OEF since 21-May and SPY since 29-May. MDY and IJR dipped in September and this 5/200 cross turned positive again on 28-Sept and 2-Oct, respectively. Again we see the progression from large-cap techs to large-caps to mid-caps to small-caps. As the last to join in, small-caps and mid-caps remain the most fragile of the five groups.

Thanks for tuning in and happy Friday!

ETF Trends, Patterns and Setups – Key ETFs Fail to Confirm New Highs, Trailing Stops with ATR, Banks Still Lagging

Some discrepancies are starting to build in the stock market. We witnessed a bullish breadth thrust last week because mid-caps and small-caps led from 24-Sept to 12-October. The Russell 2000 ETF exceeded its September high and produced a market leading gain during this time period.

ETF Trends, Patterns and Setups – Key ETFs Fail to Confirm New Highs, Trailing Stops with ATR, Banks Still Lagging Read More »

Timing Models – Small-caps and Finance Sector Perk Up as Breadth Indicators Show Broadening Participation

Stocks surged the last two weeks with a new group of leaders. Mid-caps, small-caps, banks and utilities led the charge. Large-caps and tech stocks lagged, but they still gained and remain bullish overall. The period from late May and early June was the last time we saw small-caps and banks take the lead. After a 15% advance in SPY and 25% surge in IWM, stocks rested from June 8th to July 9th with consolidations.

Timing Models – Small-caps and Finance Sector Perk Up as Breadth Indicators Show Broadening Participation Read More »

ETF Trends, Patterns and Setups – A Two Week Shift, Healthcare ETFs Remain Strong, SOXX and Retail Follow Thru

There appears to be a shift in market dynamics over the last two weeks. Small-caps outperformed large-caps, the Regional Banks outperformed Software, High-Yield Bonds outperformed Treasury Bonds and Utilities divorced themselves from Treasury bonds with a big surge.

ETF Trends, Patterns and Setups – A Two Week Shift, Healthcare ETFs Remain Strong, SOXX and Retail Follow Thru Read More »

Q&A – Trend-Following notes, Broad Market Trend Filters and getting the Jump with the Short-term Breadth Model

Today’s post starts with trend-following and insights from a recent podcast featuring Nick Radge. I then analyze the benefits and drawbacks of using a market trend filter for a broad-based ETF strategy. And finally, I review the short-term breadth model, which was developed in response to the March-April surge.

Q&A – Trend-Following notes, Broad Market Trend Filters and getting the Jump with the Short-term Breadth Model Read More »

Timing Models – ROC Shock Lingers, but Short-term Breakouts Hold

The long-term trend is up for the S&P 500 and Nasdaq 100, but questionable for the S&P SmallCap 600 and S&P MidCap 400. Small-caps and mid-caps are largely off my radar right now. Despite long-term uptrends and bullish evidence for large-caps, I remain in the correction camp for three reasons. First, SPY and QQQ became extremely extended in early September, as measured by

Timing Models – ROC Shock Lingers, but Short-term Breakouts Hold Read More »

ETF Trends, Patterns and Setup – Breakouts from September Corrections, Laggards still Lagging and Bonds Sag

After correcting most of September, many stock-related ETFs caught a bid the last few days and we are seeing short-term breakouts in several areas. The Solar Energy ETF (TAN) is far an away the leader and the only ETF in the core list to hit a new high. Nevertheless, a handful are knocking on the new high door with pennant breakouts in the making (ITB).

ETF Trends, Patterns and Setup – Breakouts from September Corrections, Laggards still Lagging and Bonds Sag Read More »

Timing Models – The Only Game in Town, Double-Edged Swords and Some Bearish Breadth Signals

SPY and QQQ fell in September and are in short-term downtrends, which are considered corrections within a bigger uptrend. The S&P SmallCap 600 SPDR and S&P MidCap 400 SPDR also fell in September, but these declines do not look like mere corrections within a bigger uptrend. MDY, IJR and IWM fell well short of their January-February highs and broke their downward sloping 200-day SMAs. These three look like they are reversing the uptrends that began with the March blast off.

Timing Models – The Only Game in Town, Double-Edged Swords and Some Bearish Breadth Signals Read More »

ETF Trends, Patterns and Setups – Dollar and Bonds Shine, Gold Dulls, Tech ETFs Hold, SPY Continues Lower, Failed Flags

It has been a rough month for everything except the Dollar and Treasury bonds. The chart below shows month-to-date performance for nine ETFs. The Dollar Bullish ETF (UUP) and 20+ Yr Treasury Bond ETF (TLT) are the only gainers this month and both have been positive for the entire month. This is a big difference from August.

ETF Trends, Patterns and Setups – Dollar and Bonds Shine, Gold Dulls, Tech ETFs Hold, SPY Continues Lower, Failed Flags Read More »

Breadth Model Update: %Above 200-day SMA Sags for SPX and OEX and AD% Reflects Broad Downside Participation

This is a midweek update to address Monday’s price action and its effect on the breadth indicators and models. At this stage, there was only one new signal: %Above 200-day for $MID broke below 45%. Nine of the ten breadth models remain bullish, but we saw more deterioration in the breadth indicators on Monday. Selling pressure was the strongest un small-caps and mid-caps over the last five weeks (since August 15th).

Breadth Model Update: %Above 200-day SMA Sags for SPX and OEX and AD% Reflects Broad Downside Participation Read More »

ETF Update: Flag Breaks, Breakaway Gaps, A Few Hold Up, Failed Breakouts and Tepid Bounce in Bonds

This is a midweek update to address Monday’s price action in some of the ETFs in the core chart list. We saw a continuation lower in SPY and QQQ, but some of the tech-related ETFs held up relatively well. ETFs that held up relatively well during broad selling pressure are often the ones that lead on any bounce, even if it is just an oversold bounce. Elsewhere

ETF Update: Flag Breaks, Breakaway Gaps, A Few Hold Up, Failed Breakouts and Tepid Bounce in Bonds Read More »

Timing Models – ROC Shock Lingers, SPY Follows Thru on Outside Week, Breadth Models Remain Bullish

The medium-term indicators and breadth models are still bullish, but the ROC Shock in early September and some waning breadth indicators argue for at least a correction of the March-September advance. I covered the ROC Shock in detail last week and will review the findings. First, keep in mind that the character of the market (SPY) changed in January 2018 as the swings became bigger and 52-week lows were interspersed with 52-week highs. Big swings and volatility are the order of the day for now.

Timing Models – ROC Shock Lingers, SPY Follows Thru on Outside Week, Breadth Models Remain Bullish Read More »

ETF Trends, Patterns and Setups – SPY and QQQ Look Vulnerable, Bond Proxies Catch a Bid, Gold Stalls as Dollar Firms

There’s been a shake up this week. A handful of equity-related ETFs are in the top group, as far as the trend, patterns and setups are concerned. However, I downgraded several groups because it looks like SPY and QQQ are moving further into correction mode. The majority of stock-related ETFs will be under pressure should SPY correct and the majority of tech-related ETFs will be under pressure should QQQ correct.

ETF Trends, Patterns and Setups – SPY and QQQ Look Vulnerable, Bond Proxies Catch a Bid, Gold Stalls as Dollar Firms Read More »

Update for Precious Metals (GDX, GLD, SLV), Healthcare (XLV, IBB, XBI) and Bond Proxies (TLT, XLU, XLRE)

Tech-related ETFs continue to drag their feet and remain in corrective mode. This puts the attention elsewhere and biotechs are picking up the slack. Namely, the Biotech ETF (IBB) and Biotech SPDR (XBI) made bids to end their corrections and resume their bigger uptrends. Elsewhere, precious metals related ETFs bounced within their consolidations and bond proxies popped with XLU and XLRE getting big moves.

Update for Precious Metals (GDX, GLD, SLV), Healthcare (XLV, IBB, XBI) and Bond Proxies (TLT, XLU, XLRE) Read More »

Timing Models – Accelerations, Trend Shocks, Indicators turn Mixed, Downside Targets and Breadth Models

The stock market was overextended in late August and the bulls gave it one more push higher with a small acceleration higher into late September. Technically, an acceleration higher signals an increase in momentum, which can be bullish. However, as with most technical signals, perspective is needed for interpretation. Today we will look at the accelerations that led to a reversal and the outsized decline. What do they portend going forward?

Timing Models – Accelerations, Trend Shocks, Indicators turn Mixed, Downside Targets and Breadth Models Read More »

ETF Grouping and Ranking Report – Outsized Declines, Retracement Targets, Patience During Corrections, Gold and Bonds Balk

Stocks were hit hard from Friday to Tuesday with the S&P 500 SPDR, Nasdaq 100 ETF and others recording outsized declines. Today we start with these outsized declines and show what they entail going forward. Stocks were already extended and these sharp declines signal the start of a corrective period. At this point, I will treat any weakness in SPY and QQQ as a correction within a bigger uptrend.

ETF Grouping and Ranking Report – Outsized Declines, Retracement Targets, Patience During Corrections, Gold and Bonds Balk Read More »

Timing Models – Bears Fire a Shot, SPY Tags and Pulls Back, Volatility Ticks Up and Breadth Model Review

The bears fired a shot across the bow, but one or two days is not enough to reverse a strong uptrend. There were already warnings of a correction or pullback because SPY has been more than 10% above its 200-day since August 12th and QQQ has been 20% above its 200-day since July 6th. Of course, overbought indicators are not very good for timing a correction. In fact, I have yet to find a good indicator for timing a peak/pullback during a strong uptrend.

Timing Models – Bears Fire a Shot, SPY Tags and Pulls Back, Volatility Ticks Up and Breadth Model Review Read More »

ETF Trend/Pattern Grouping – Overextended get More So, Flag Breakouts, Pennants, Falling Wedges and Bollinger Band Squeezes

Overextended its an incredibly nebulous term. Many ETFs were considered overextended last week and simply became even more so as strong buying pressure persisted. This is a classic case of becoming overbought and remaining overbought because the uptrend is strong. These ETFs, which are in the first few groups, are in the trend-monitoring phase.

ETF Trend/Pattern Grouping – Overextended get More So, Flag Breakouts, Pennants, Falling Wedges and Bollinger Band Squeezes Read More »

Timing Models – Overextended, but Breadth and Medium-term Indicators Support Current Upswing

We all know that the S&P 500 is driven by large-caps, especially the big four, which account for over 20% of the index (AAPL, MSFT, AMZN, GOOGL). Furthermore, most of us are aware that breadth measures are not as strong as the S&P 500 and this is reflected in the S&P 500 EW ETF (RSP), which has yet to clear its June high. Breadth, however, is not exactly weak. It is just strong enough to sustain the advance. In other words, the cup is half full, not half empty.

Timing Models – Overextended, but Breadth and Medium-term Indicators Support Current Upswing Read More »

ETF Trend/Pattern Ranking and Grouping – Strong Extensions, Second Winds, Modest Extensions, Corrective Patterns, Laggards and Breakdowns

Stock-related ETFs remained strong and many so-called overbought ETFs became even more overbought as their uptrends extended. Many ETFs are in the trend-monitoring or waiting phase. The early breakouts occurred in July and these ETFs followed through with further gains the last several weeks. Some tech-related ETFs stalled in late July and early August, but caught a second wind with breakouts over the last few weeks.

ETF Trend/Pattern Ranking and Grouping – Strong Extensions, Second Winds, Modest Extensions, Corrective Patterns, Laggards and Breakdowns Read More »

Timing Models – SPY Tags a New High, Medium-term Indicators Favor the Bulls and SPX Breadth Model Remains Bullish

The bulk of the evidence remains bullish for large-caps, large-cap techs and mid-caps, but mixed for small-caps. I am also seeing mixed performance within the S&P 500, especially when looking at the equal-weight sectors. Technology, Healthcare and Consumer Discretionary remain strong, while Finance, Energy and REITs are weak. Finance is the only big sector that shows underlying weakness though.

Timing Models – SPY Tags a New High, Medium-term Indicators Favor the Bulls and SPX Breadth Model Remains Bullish Read More »

Scroll to Top