")
I received some pertinent questions over the weekend and created a post to share the answers. We start with trend-following and insights from a recent podcast featuring Nick Radge. I then analyze the benefits and drawbacks of using a market trend filter for a broad-based ETF strategy. And finally, I review the short-term breadth model, which was developed in response to the March-April surge. Hopefully, I am not chasing my tail with this.
Andrew Swanscott of Better System Trader is back and is first two guests were two of my favorite system traders: Cesar Alvarez of AlvarezQuantTrading and Nick Radge of The Chartist. Cesar is mostly a mean-reversion trader and he talked about market regimes. Nick trades different systems and talked about system diversification, which makes a lot of sense. Nick also expands on trend-following and here are some notes from the episode.
Nick talks about how to approach drawdowns and underperforming periods, which all systems go through. We need to understand the journey of other successful traders to better cope with our own journey. His suggestion is to look at the long-term track records for other trend-followers, such as Dunn Capital management.
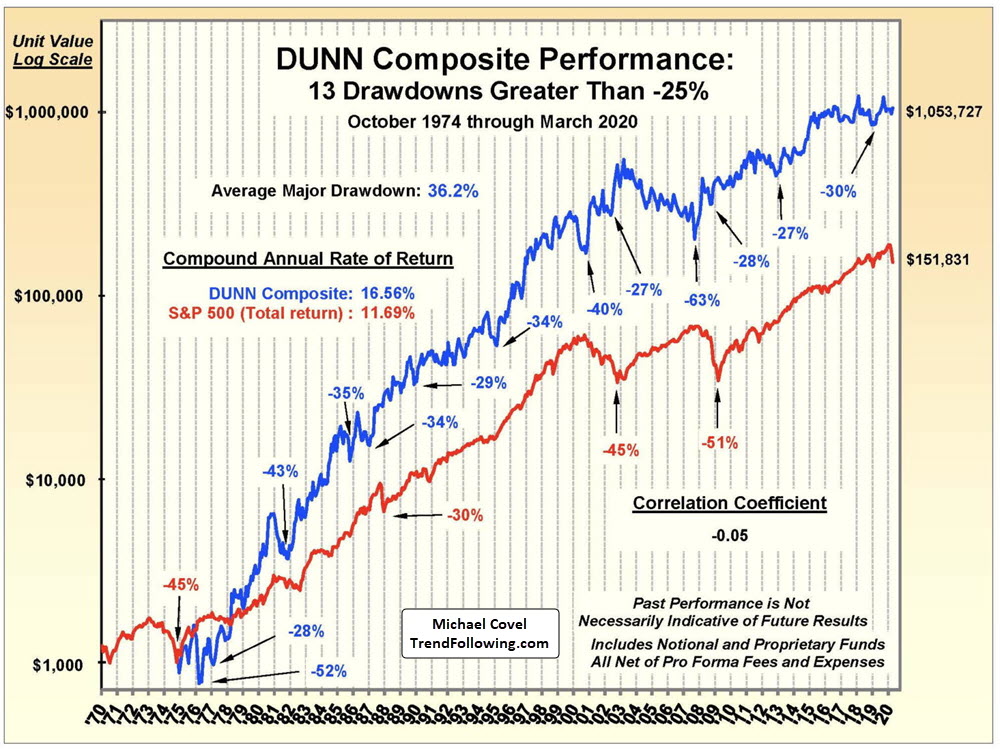
The image above is from Michael Covel of TrendFollowing.com. Here he shows a 50 year path to outperformance, which is littered with drawdowns and bad years. Each vertical line represents a year and there are plenty of “off” years. There was also a long period of underperformance from 2003 until 2007 (63% drawdown).
Nick notes that people want a strategy that works well in all markets all of the time. This is called the holy grail and it does not exist, except in the movies. Here’s my favorite. Nick asserts that you are always chasing your tail when you optimize. In other words, if you make “tweaks” to account for recent price action, you will always be making tweaks and always be playing catch up.
Nick argues that the difference between successful traders and everyone else is the ability to apply a strategy over the long-term. We cannot be jumping from strategy to strategy without giving the strategy time for its edge to play out. It is all about the “next 1000 trades”. One trade will not make or break you.
I would also suggest checking out TopTradersUnplugged. Niels Kaastrup-Larsen put together a great team of systematic traders and investors, including Jerry Parker, Robert Carver and Moritz Seibert. There is a lot of information on his website and a weekly podcast.
With or Without a Market Trend Filter
Speaking of Trend-Following, I received some questions on the StochClose with Profit Target strategy and would like to share the answer. Note that a strategy with a profit target is not a true trend-following strategy. A true trend-following strategy would not exit until the trend reverses, which is one of the reasons trend-following strategies are susceptible to larger drawdowns.
The question regards the use of a market filter with the strategy. A market filter means only trading when the S&P 500 is in bull mode (5-day SMA above 200-day SMA and/or breadth model bullish). The system takes bullish signals when the S&P 500 is bullish and ignores bullish signals when the S&P 500 is bearish. Note that the system does not sell everything when the S&P 500 turns bearish. Instead, it simply sells when individual sell signals trigger.
A broad market trend filter makes sense when trading stocks or only stock-related ETFs. Risk in owning stocks increases substantially when the S&P 500 is below its 200-day SMA. The All Weather ETF List, however, has 40 equity-related ETFs and 10 alternative ETFs. Not trading when the S&P 500 is bearish would mean avoiding alternatives as well. These include the 20+ Yr Treasury Bond ETF (TLT), Dollar Bullish ETF (UUP) and Gold SPDR (GLD).
Stock Alternatives: TIP, GLD, LQD, MBB, TLT, UUP, DBC, IEF, IEI, FXY
Stock-related ETFs: EEM, EFA, FDN, FXI, GDX, HYG, IGV, IHF, IHI, IJR, ITA, ITB, IWM, IYR, IYZ, KBE, KIE, KRE, MDY, PFF, QQQ, RSP, SOXX, SPY, VIG, XBI, XES, XHB, XLB, XLE, XLF, XLI, XLK, XLP, XLU, XLV, XLY, XME, XOP, XRT
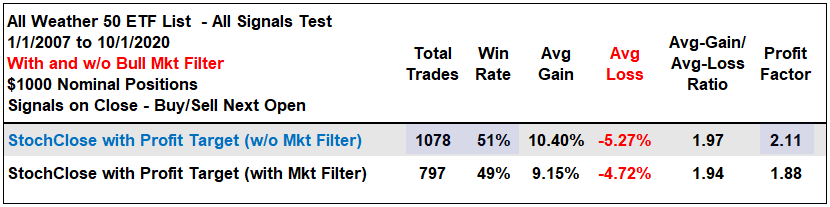
So I ran the numbers with and without a market trend filter – again. First, we have an all signals test from January 2007 until September 2020. Without a market trend filter, the Win Rate was higher (51% vs 49%) and the Profit Factor was higher (2.11 vs 1.88). There were also more trades, which means more time invested.
The next table shows the test at the portfolio level (14 equal weight positions). With the market trend filter, the Win Rate was the same (51%), the Maximum Drawdown was much better (13.9% vs 18.41%) and the Gain/Loss ratio was higher (2.15 vs 1.98). This is probably because the system avoided losses during the financial crisis (2008-2009).

There were, however, some tradeoffs. Trading without a market filter produced a higher Compound Annual Return (8.54% vs 7.17%), a higher exposure (73% vs 69%) and a Profit Factor near 2. The Total Profit Percent was higher (208% vs 192%) because trading without a market filter produced a higher CAR and higher exposure, which means it was invested more.
As with most things in technical analysis and trading, there are always trade-offs. In this case, higher returns come with higher risks.
It is also worth considering the nature of market leadership. The 5-day SMA did not move above the 200-day SMA for SPY until May 29th. The “long-term” breadth model turned bullish for a few days on June 8th and then again on July 20th. Large-cap techs led the move off the March lows and leading ETFs triggered bullish StochClose signals well before the S&P 500 turned bullish. The chart below shows the Software ETF (IGV) with a bullish signal triggering on April 30th.

Leaders often turn bullish before the broader market turns. That's why they are leaders, according to Captain Obvious. Chartists looking to catch the leaders need to consider this if using a market timing filter.
Hindsight is 20/20
With the surge off the March low and the late signals in the long-term breadth model, I took a page from Ned Davis research and developed a short-term breadth model in June. This model is based on breadth thrusts from three indicators. The chart below shows model signals since 2018. Notice that the short-term model (middle) turned bearish (red) in February 2018 and remained bearish until January 2019. It missed the advance from April to September 2019. The long-term breadth model caught this advance, but arrived late to the 2020 advance off the March lows. Can’t win them all.

The short-term model has three indicators: %Above 50-day SMA, %Above 20-day SMA and 10-day EMA of AD%. It is designed to identify a strong thrust in participation in either direction. The idea is that a strong thrust has legs and could continue, as in mid January 2019 and late April 2020. The bull/bear signal thresholds are as follows: %Above 50-day SMA 80/20, %Above 20-day SMA (85/15) and 10-day EMA of AD% (30/-30).

A bullish breadth thrust triggers when two of the three indicators are on active bullish signals. Thus, the %Above 50-day SMA surges above 80%, the %Above 20-day SMA surges above 85% and/or the 10-day SMA of AD% exceeds +30%. It is a big deal when over 80% of stocks are above their 50-day SMA or over 85% move above their 20-day SMA. This shows broad participation that can lead to further gains. Currently, %Above 50-day and the 10-day EMA of AD% are on active bullish signals, and %Above 20-day is on an active bearish signal. This means the model is +1 and bullish.
In hindsight, the short-term breadth model turned bullish on April 29th and would have caught some of the earlier trend signals using StochClose (125,5). It is important to get into the leaders when the broader market environment turns bullish and this model can help with early identification. With market moves getting faster and faster, I will continue to monitor both breadth models for signs of change. Both are bullish right now and the 5-day SMA is above the 200-day SMA for SPY.
You can learn more about the breadth model and its historical performance in this article and video (here).