The bulk of the evidence remains bullish for large-caps, large-cap techs and mid-caps, but mixed for small-caps. I am also seeing mixed performance within the S&P 500, especially when looking at the equal-weight sectors. Technology, Healthcare and Staples remain strong, while Finance, Energy and REITs are weak. Finance is the only big sector that shows underlying weakness though. On the chart below, the red shading shows sectors that are down year-to-date and the green shading highlights the four positive sectors.
SPY finally matched QQQ with a new high. QQQ recorded its first new high on June 5th and SPY followed suit over two months later. The S&P MidCap 400 SPDR and Russell 2000 ETF exceeded their June highs, but remain well below their February highs. In fact, IWM last recorded a 52-week high way back in August 2018, some two years ago. Nevertheless, QQQ is king and SPY is the 800 pound gorilla in the market. Things cannot be that bad when both record new highs.
The chart above shows SPY tagging its February high this week. The red dotted lines show prior peaks and subsequent new highs that were separated by several months and a sizable decline. The blue zones mark a reversal after the new high in September 2018 and a pullback after the new high in May 2019. Technically, 52-week highs are bullish. However, they can give way to a correction after an extended run. The blue zone marks first support for SPY in the 320 area and support for QQQ is set in the 250 area.
The images in this commentary are linked to a StockCharts version when possible.
Programming note: I am taking Friday and Saturday (August 21st and 22nd) off for a last minute family outing before school starts. The normal schedule will resume next week.
Medium-term Indicators Remain Net Bullish
The next chart shows the High-Low Lines in a different format. The histograms reflect the percentage difference between the High-Low Line and its 10-day EMA. The histogram as green when the High-Low Line is above its 10-day EMA (bullish) and red when below. As the chart shows, 3 of 4 histograms have been positive since April 23rd and all four are currently positive.
The Bullish Percent Indexes for the S&P 100 and Nasdaq 100 have been bullish since late March when they moved above 60%, while the S&P 500 BPI has been bullish since late May (green zones). Currently some 81% of S&P 100 stocks and 78% of S&P 500 stocks have P&F buy signals (higher highs). The Nasdaq 100 BPI is lagging at 69%, but well above 50% and bullish.
The S&P 500 moved to a new high over the last few weeks and 20-day High-Low Percent exceeded 40%. Note that SPX exceeded its June high and fewer than 50% of stocks forged 20-day highs (yellow line). Participation is not as strong, but has yet to transition into actual selling pressure (expansion of 20-day lows). A move below -10% would show such an expansion and turn this indicator negative.
Volatility remains low and bullish for stocks. The 5-day SMA of the High-Low Range fell below 1 on July 1st and remained below 1 as SPY moved higher. The 5-day SMA of Normalized ATR(2) moved below 2 on July 2nd and remained below 2 as SPY moved higher. These volatility indicators show low volatility and this is bullish until we see a move above their respective thresholds.
S&P 500 Breadth Model and Trend Remain Bullish
The 5-day SMA for the S&P 500 SPDR has been above the 200-day since May 29th and the S&P 500 breadth model has been bullish since July 23rd. Price is driven by large-caps and big stocks propelled the S&P 500 higher. Breadth is driven by “average” stocks and they are still playing catch up. The 5-day SMA is some 10% above its 200-day SMA and getting extended for the third time since January 2018 (yellow line).
The chart below shows the individual indicators that make up the breadth model. High-Low Percent got above +10% on July 22nd, but has yet to exceed this level again. SPY is near a new high and the total number of new highs is quite underwhelming. Fewer stocks are making new highs than in January-February. Nevertheless, 58% of SPX stocks are above their 200-day SMAs, 67% are above their 150-day SMAs and 83% are above their 100-day SMAs.
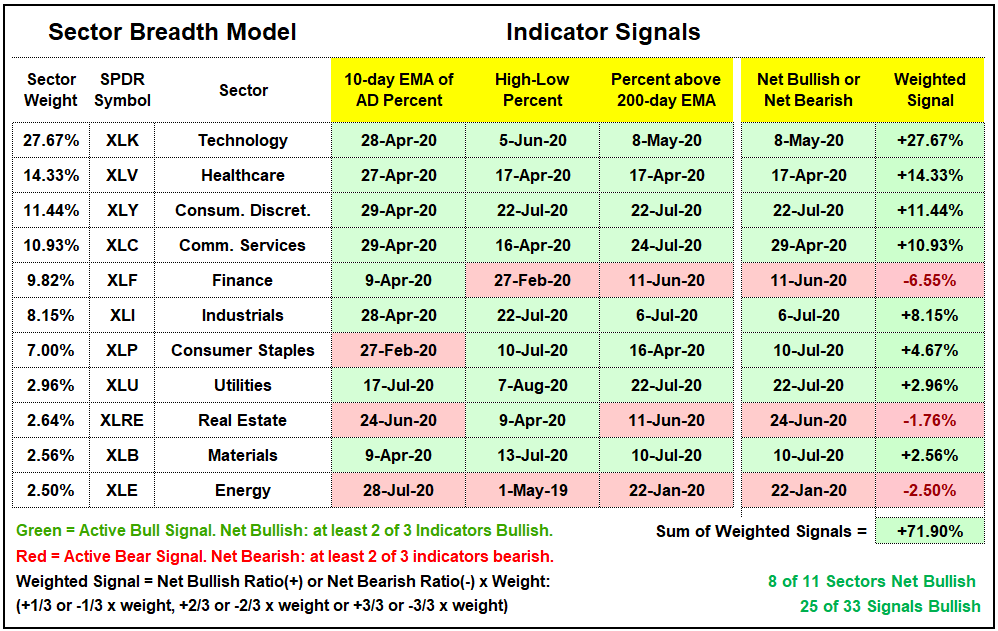
There is no change in the sector breadth model. The four biggest sectors remain bullish with all three indicators on active bullish signals. The fifth biggest sector, Finance, remains net bearish with fewer than 40% of its component stocks above their 200-day EMAs. REITs and Energy remain net bearish as well and these are the three sectors to avoid right now.
QQQ Hits New High
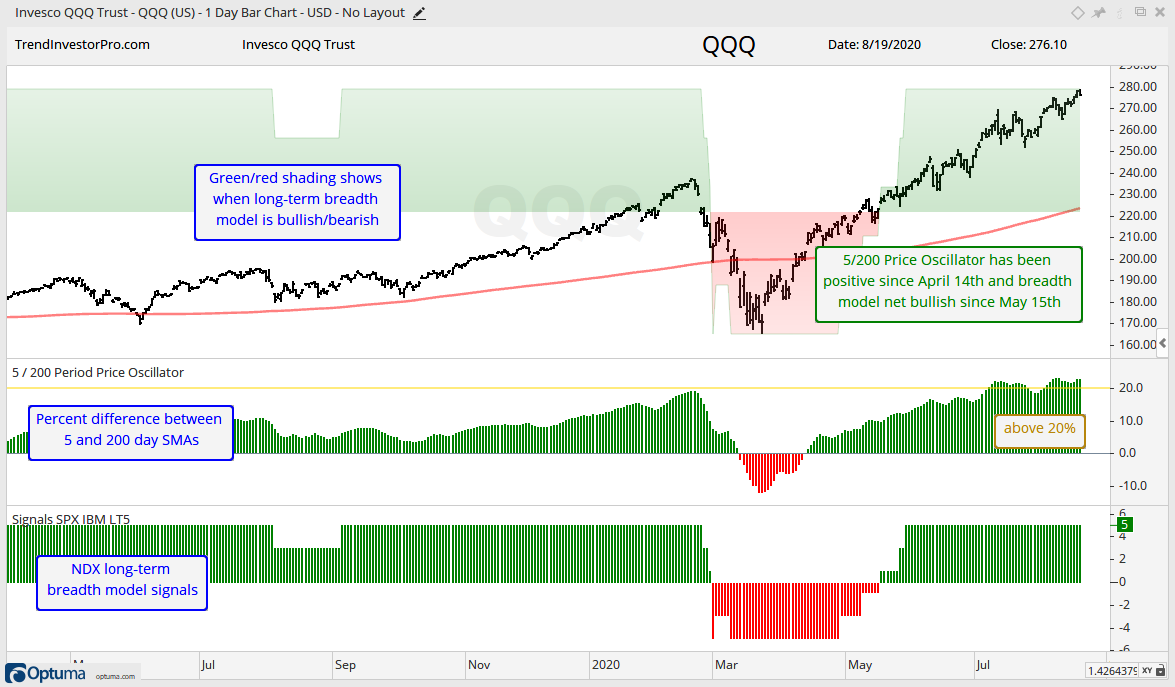
QQQ hit another new high this week and its 5-day SMA is more than 20% above its 200-day SMA. This is double the difference seen in SPY and the most since July 2009. This moving average difference first exceeded 20% on July 9th and QQQ continued to climb the last seven weeks. Thus, we have a classic situation where something becomes overextended and remains overextended. Overextended is like a bearish divergence in an indicator. It is not really a bearish signal. Instead, it serves as an alert to watch carefully. The Nasdaq 100 breadth model remains bullish with all five indicators on active bullish signals.
Mid-caps Bullish and Small-caps Mixed
The S&P MidCap 400 SPDR (MDY) turned bullish on August 10th. Prior to that, the 5-day SMA for MDY moved above the 200-day on July 22nd. This means the bulk of the evidence is bullish for mid-caps. MDY moved above its 200-day and exceeded its June high for a few days, but fell back below this benchmark high. The ETF remains well below its February high and is still lagging SPY. Even though the medium-term trend is up with the June lows mark key support going forward.
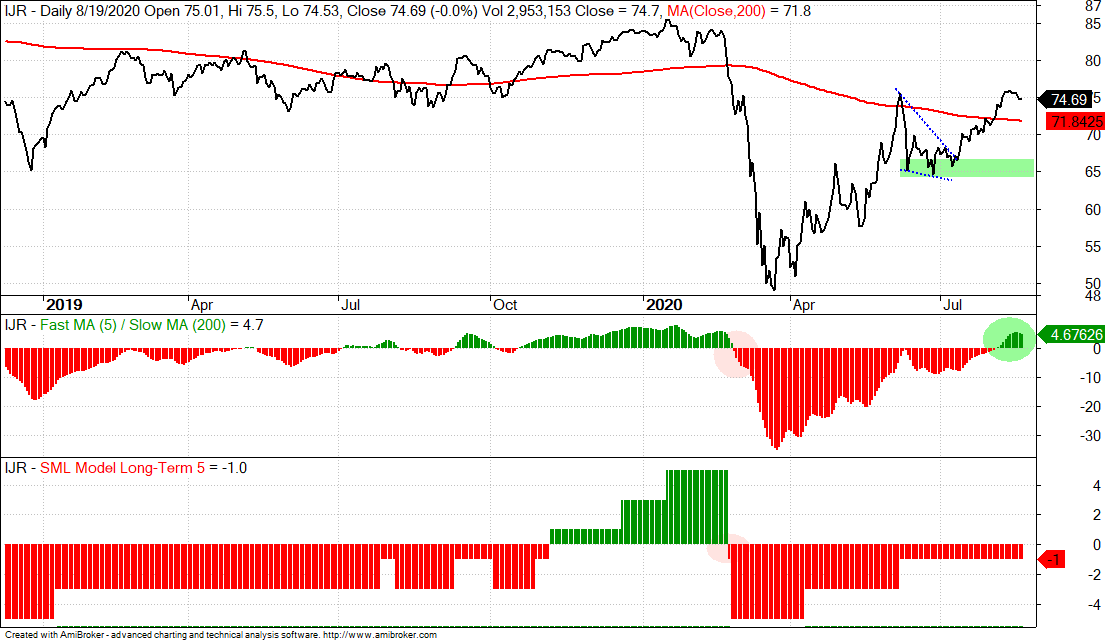
Small-caps remain mixed. The 5-day SMA for IJR is above the 200-day SMA and IJR exceeded its June high for a few fleeting moments. However, the small-cap breadth model remains net bearish. For one, only 47% of small-caps are above their 200-day SMAs. Thus, the majority of stocks (53%) are in long-term downtrends. IJR is participating in the medium-term uptrend with the June lows marking key support.
Fed Balance Sheet, Stimulus and Yield Spreads
The Fed will release its balance sheet numbers later today and Congress is still debating the stimulus. It is “interesting” to speculate on future Fed moves and the size of the next stimulus. However, I am not sure how much it will help us with market timing. The market is a forward looking beast and events are usually priced-in before they actually happen. This is why it is usually best to focus on price action and ignore the rest.
I think the yield spreads probably offer the most insight right now. As long as they continue to narrow and/or remain low, the credit markets are working fine and this is “not negative” for stocks. Debt, of course, is a four letter word. Functioning credit markets take away a negative for stocks, but I am not sure if they introduce a positive. In any case, the AAA spread fell back to pre-crisis levels and then flatten out in the .70 to .80 area the last seven weeks. The BBB spread fell below 2 and remains below 2. I would not become concerned unless the AAA spread moves above 1 and the BBB spread moves above 2.
Junk bond spreads ticked up over the last week or so, but remain at relatively low levels. I would not be concerned with this spread unless it moves above 6. The CCC spreads remain above the pre-crisis highs and the low end of the junk bond market has not fully recovered. Nevertheless, these spreads have yet to widen and suggest a problem in the junk bond market.
Balance sheet growth stalled over the last nine weeks, but we have not seen a major contraction that would be negative for the markets. Notice that SPY moved to a new high even as balance sheet growth stalled. Something else may be driving stocks at this stage. Problem is, we will make the discovery well after the fact. Note that the Fed will update these numbers later today.
")