There is some curious activity in the intermarket arena. Namely, we are seeing continued weakness in Treasury bonds, relative strength in inflation-indexed bonds, weakness in the Dollar and strength in several commodity groups. I do not trade off intermarket relationships, but I do trade specific patterns and there are several commodity related ETFs with bullish breakouts working. Today’s commentary will focus on the DB commodity ETFs: Energy, Base Metals, Agriculture and Precious Metals. Even though the Dollar is not my forte and I am more wrong than right on the greenback, I will also take a stab a the Dollar index.
TLT Sags as TIP Outperforms
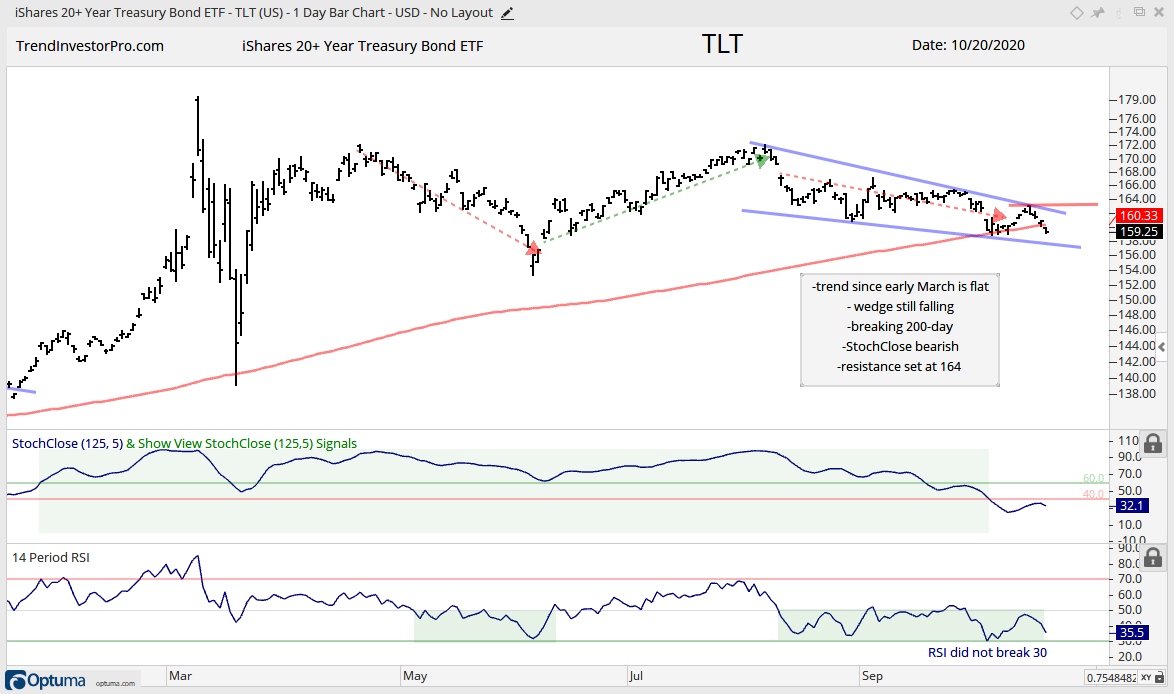
The first chart shows the 20+ Yr Treasury Bond ETF (TLT) with some wild swings at the beginning of the covid crisis (March) and then a trading range since April. There have been three swings since April and the current swing is down. A falling wedge could be forming, but the wedge is still falling and TLT closed below its 200-day SMA on Tuesday. Also notice that StochClose turned bearish with a move below 40 on 6-Oct. TLT is not looking so good right now.
Note that TLT is the main driver for the other bond ETFs (IEF, LQD, AGG). It is a long-duration bond, which means it is extremely sensitive to changes in interest rates, monetary policy, inflation and such. The High-Yield Bond ETF (HYG) is the exception and acts more like a stock because it is sensitive to the economic outlook.
Picking a narrative to justify a price move is a dangerous game. First, narratives assume that we know all the variables at work. Second, narratives assume that we can pick the most important variable (the one that is driving price action). Narratives always sound great, but they are not as important as price action. Keep these narratives on the back burner and focus on price!
Having laid out my narrative disclaimer, weakness in bonds and the Dollar could be because inflation expectations are perking up. We are also seeing commodity ETFs strengthen.
The next chart shows the Inflation-Indexed Bond ETF (TIP) holding well above its 200-day SMA and performing better than TLT. Note that TLT peaked in early August and TIP peaked in early September. TIP is also in a short-term downtrend, but has yet to break its August low and is outperforming TLT. Relative strength in TIP could be a sign that the market is pricing in inflation, which bonds loathe.
Commodity ETFs Go for Continuation Breakouts
The DB Commodity ETF (DBC) and related commodity ETFs are showing strength with bullish StochClose signals and bullish continuation patterns. The first chart shows DBC and the holdings on the chart. Energy is dominant by accounting for around 44% of the ETF. StochClose turned bullish with a move above 60 on 5-Aug (green shading) and price is largely above the 200-day SMA. After a 30% advance off the April low, DBC corrected with a wedge and broke out of this wedge pattern last week.
The red line starting on 8-Oct (breakout date) is the ATR Trailing Stop. Even though this indicator provides us with a systematic approach to stop-losses and trailing stops, we must still subjectively pick the period settings for ATR and the ATR multiplier. This ATR Trailing Stop is three ATR(22) values below the 15-Oct close (13.36 – (3 x .185) = 12.81). The ATR(22) values are based on the value at the time of the highest close. Note that this stop will rise a little on the next bar because Tuesday’s close is above 13.36.
The ATR Trailing Stop is not available at StockCharts, but you can consider using Parabolic SAR as an alternative. Here is an article comparing three trailing stop indicators. This ATR Trailing Stop is available on Optuma
The DB Base Metals ETF (DBB) is also getting into action with copper, aluminum and zinc futures hitting new highs. These can be plotted on TradingView. StochClose turned bullish for DBB on 10-Jul as the ETF advanced from April to August. The correction in September did not form a perfect falling flag or wedge, but the decline is clearly a correction within a bigger uptrend. More important, there is a breakout last week and new high this week. The ATR Trailing Stop is three ATR(22) values below the highest close since the breakout and is currently at 14.93.
The next chart shows the DB Agriculture ETF (DBA) with StochClose turning bullish in late August and the ETF moving above its 200-day. DBA consolidated with a range the last two months and this is viewed as a consolidation within an uptrend (bullish continuation pattern). Within the pattern, we can see a surge in early October, pennant pullback and breakout this week.
The next chart shows the DB Precious Metals ETF (DBP), which looks similar to the Gold SPDR (GLD). This is an interesting alternative to gold because the ETF is 78% gold and 22% silver. The small holding in silver adds a little octane because silver is much more volatile. DBP has yet to break out of a falling channel. Nevertheless, the ETF is above its 200-day and hit a new high in August. Thus, the decline is viewed as a correction within a bigger uptrend. A breakout at 54 would be bullish. A close below 51 would be negative and keep the falling channel alive.
I guess a discussion on commodities would not be complete without the Dollar Index. The long-term trend is down and the Dollar has gone nowhere since early August. The September bounce retraced 50% of the July-August decline and formed a rising channel of sorts. DXY broke the channel line here in October and this signals a continuation lower. Last week I thought the Dollar was firming, but it is more important to keep the bigger trend in mind. Expect bearish resolutions in a downtrend and bullish resolutions in an uptrend. With the bigger trend down, the Dollar is expected to resolve lower.
")