The stock market was overextended in late August and the bulls gave it one more push higher with a small acceleration higher into late September. Technically, an acceleration higher signals an increase in momentum, which can be bullish. However, as with most technical signals, perspective is needed for interpretation. Today we will look at the accelerations that led to a reversal and the outsized decline. What do they portend going forward?
The medium-term indicators are mixed and this points to a corrective period. Keep in mind that corrections can be based on time, price or both. In other words, we could see prices move sideways (time), prices decline (price) or a zigzag lower (both). At this stage, the breadth models and long-term trends are still bullish overall. I will treat a price decline or consolidation, therefore, as a correction within a bullish environment. All bear markets and 20% declines begin with pullbacks and 5% declines. However, not all pullbacks and 5% declines lead to bear markets. Let’s hit the charts.
An Acceleration after Becoming Extended
SPY and QQQ went from overextended situations and upside accelerations to a sudden and outsized decline. We already knew of the overextended situations as SPY was over 15% above its 200-day and QQQ was over 30% above on 2-Sept. It is also worth noting that the advance accelerated when SPY hit a new high on 2-Sep. An accelerating advance off a low is bullish because it reflects a strong thrust of buying pressure that reverses a downtrend. An accelerating advance after an extended advance signals caution because it reflects excess and exhausts the uptrend.
Here’s how we can identify an acceleration. On 2-Sept, the 2-day Rate-of-Change for SPY was the largest (2.4%) since 30-June, a day that marked a breakout and bullish acceleration. The 10-day Rate-of-Change was pretty steady during the advance from late June to late August, but then poked its head above 6% on 2-Sept and hit its highest level since early June. The multi-week highs in ROC(2) and ROC(10) reflected an acceleration after an extended advance and foreshadowed the recent reversal.
Last week I showed retracements based on three price moves: March to September, May to September and June to September. In an effort to simplify and provide consistency on the charts, I am just using the retracements based on the big advance from March to September. Note that the 33% retracement, rising 200-day and June consolidation converge in the 310 area and this is the base case for a correction. A move back to this area would amount to a 12-13% decline from the recent high.
A Shock to the Trend
The decline over the last five days represents a shock to the uptrend and it takes time to recover from such shocks. The chart below shows four items to define this shock and argue for at least a correction. First, the red shading shows when the 5-day Rate-of-Change is more than -5% (outsized decline). Second, the green/red zigzag shows swings greater than 5%. The blue arrows mark 52-week highs and the gold arrows show when SPY fell more than 5% in five days after hitting a new high.
It took ten weeks to stabilized after the shocks in February 2018 and August 2019. A large Symmetrical Triangle formed in early 2018, while a large Ascending Triangle formed into the autumn of 2019. The other two shocks (October 2018 and February 2020) led to bear markets and 52-week lows. The breadth models are currently bullish so the current assessment is for a corrective period that could end in nine to ten weeks. Hmm… is there a big event coming up in less than nine weeks?
Medium-term Indicators Weaken and Turn Mixed
The two slower and less sensitive indicator groups, High-Low Lines and Bullish Percent Indexes, remain bullish. The faster and more sensitive indicator groups, 20-day High-Low Percent and Volatility turned bearish. Overall, the group would be considered neutral, which means I may need to find a fifth indicator to break the tie.
One such candidate could be the percentage of stocks with silver crosses (20-day EMA crossing 50-day EMA). The chart below shows this indicator for the four key indexes: NDX, SPX, MID, SML. Bullish and bearish signal thresholds are set at 60% and 40%. Note that I refrain from using the exact middle (50%) to reduce whipsaws. I added a 20-day EMA to gauge general direction.
All four lines peaked in June with relatively high readings as NDX, SPY and MID exceeded 90% and SML exceeded 80%. Even though each index moved above its June high, the silver cross lines did not exceed their June highs. Again, we are seeing less participation during the summer leg higher. All four lines turned down the last few weeks and moved below their 20-day EMAs. This is negative. The group would turn outright bearish should two of the four move below 40%. Pro Tip: You can change the SC to GC in the symbols to see the golden cross indicators (!SCISPX to !GCISPX).
The High-Low Lines are still rising because the histograms are positive, but less positive than five to six days ago. $MID and $SML have fewer new highs than $SPX and $NDX and are lagging. These would be the first to turn negative, which would require new lows to outpace new highs for a week or two.
The Bullish Percent Indexes remain net bullish because none of them have crossed below 40%. Nasdaq 100 BPI ($BPNDX) dipped to the low 40s, S&P 500 BPI ($BPSPX) dipped to 64% and S&P 100 BPI ($BPOEX) dipped to 68%. Except for the Nasdaq 100, the majority of stocks are still with P&F buy signals (double top breakouts). The trouble starts when two of the three break 40%.
20-day High-Low Percent fell below -10% on 3-Sep to trigger bullish. The indicator has been negative the last four days and this ties the four day stretch in late June.
Volatility is rearing its ugly head as the 5-day SMAs for High-Low Range% and Normalized ATR(2) moved above 2% and reached their highest levels since mid June. Note that SPY fell 6.3% on June 11th and then consolidated for the next two to three weeks. Right now we are seeing a sharp uptick in volatility and volatility is normally associated with price declines or choppy ranges.
Breadth Largely Bullish, but %Above 200-day Underwhelms
Four of the five long-term breadth models are bullish (SPX, NDX, OEX and MID). The S&P SmallCap 600 model is the only one net bearish. Note that you can see all model and indicator charts in the breadth chartbook, which is linked by the green button at the top.
S&P 500: bullish since 23-Jul
Nasdaq 100: bullish since 18-May
S&P 100: bullish since 2-Jul
S&P MidCap 400: bullish since 10-Aug
S&P SmallCap 600: bearish since 25-Feb
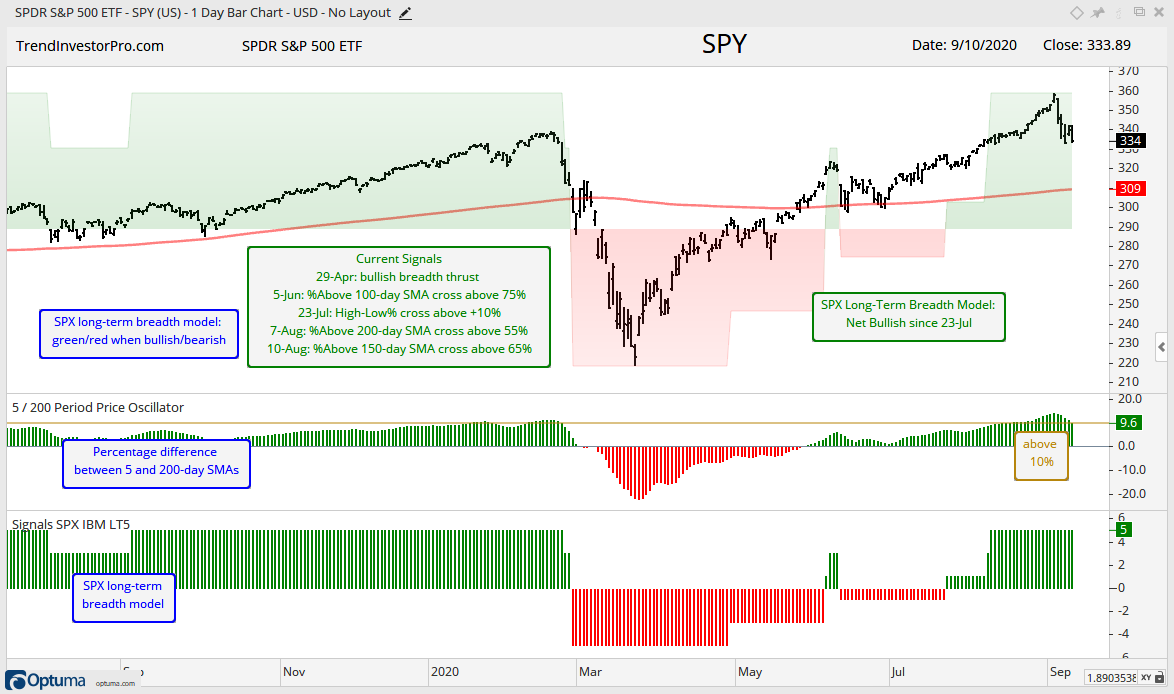
The chart below shows SPY with the long-term breadth model signals (green/red shading). The 5-day SMA was over 10% above the 200-day SMA from 18-Aug to 9-Sep. As noted before, this reflected an overextended condition, but it is not well-suited for actually timing a pullback. SPY advanced another 7% and hit fresh new highs before reversing sharply the last five days. SPY gave this 7% back rather quickly and is back near its 18-Aug levels.
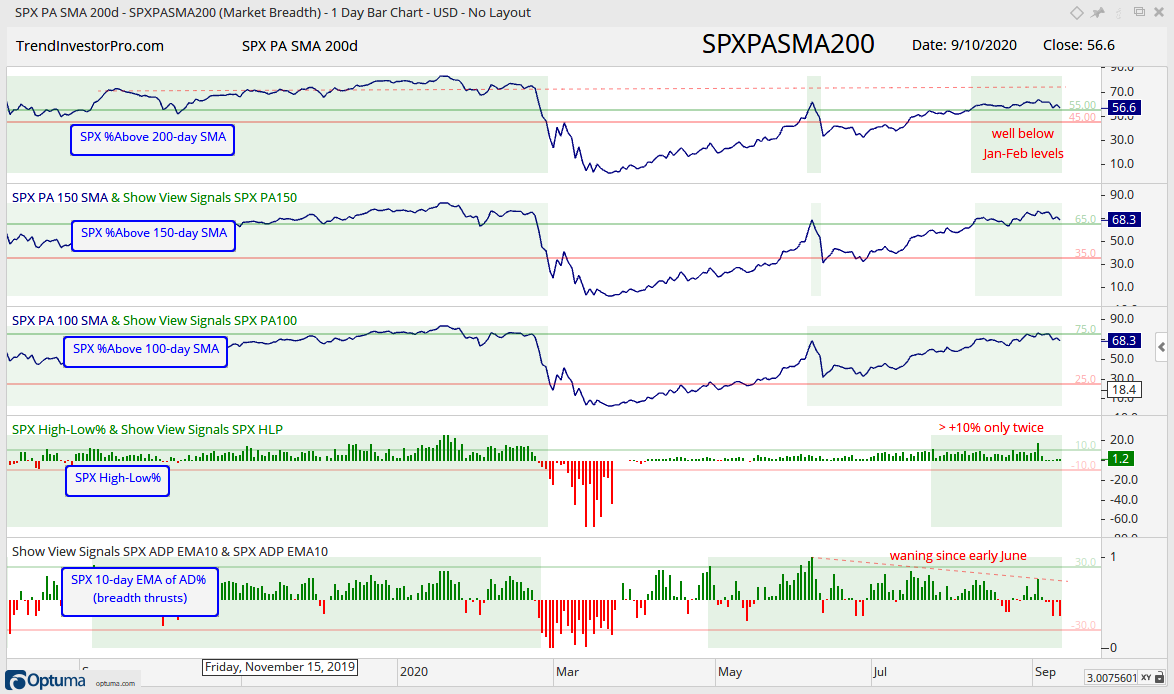
The next chart shows the five indicators for the S&P 500 breadth model. The indicator is shaded green when there is an active bullish signal. There is no shading when there is a bearish signal. All five are shaded green right now, but we can see that %Above 200-day is not as strong as it was in January-February. High-Low Percent is also uninspiring because it exceeded +10% just twice since 21-Jul. Participation is also waning because the 10-day EMA of AD% formed lower highs the last few months. The cup is still half full, but I am not sure of the quality of the water.
Despite new highs in SPX and OEX, the %Above 200-day SMA indicators remained well below their January-February highs here in August-September. S&P 100 and S&P 500 %Above 200-day indicators were above 80% in January-February, but have yet to exceed 70% on this run. $MID got above 70% then, but has yet to exceed 60% now. $SML got to 70% then, but has yet to exceed 55% now. MID %Above 200-day SMA is close to triggering bearish again as it fell to 46%. This shows fewer stocks in long-term uptrends than before. It is not necessarily negative for market-cap weighted indexes like OEX and SPX, but it does reflect a disconnect between the index levels and participation. This is a selective “bull market” that is not lifting all boats.
NDX %Above 20-day Gets Hit
All five short-term breadth models are bullish. I added these short-term breadth models to capture thrust signals, especially when coming off a low. Breadth thrust signals require shorter term breadth indicators, such as the %Above 20-day SMA, %Above 50-day SMA and 10-day EMA of Advance-Decline Percent. These indicators are pretty good at calling bottoms, but the evidence is more mixed for calling tops. Market movements are quite hyper these days so I will keep a close eye on these models as well. Current signals are as follows:
S&P 500: bullish since 23-Jul
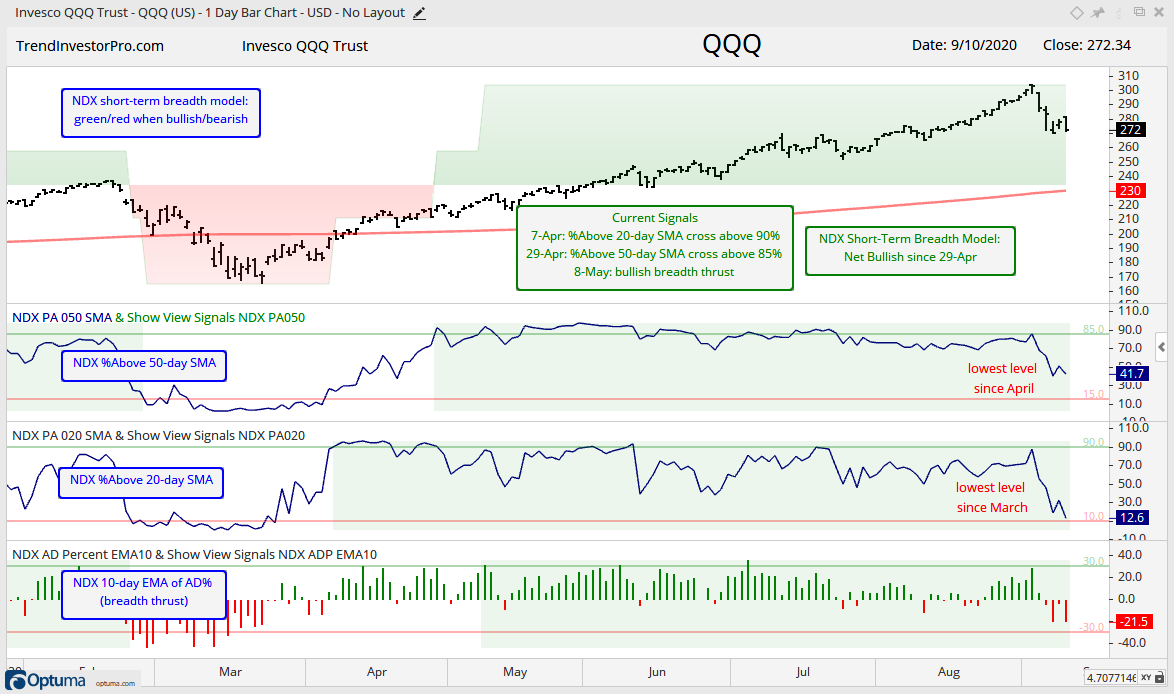
Nasdaq 100: bullish since 29-Apr
S&P 100: bullish since 26-May
S&P MidCap 400: bullish since 9-Apr
S&P SmallCap 600: bullish since 9-Apr
The Nasdaq 100 %Above 20-day SMA dipped to 12%, which is the lowest level since March and the lowest of the five index models. %Above 50-day SMA is at its lowest level since April and the 10-day EMA of Advance-Decline Percent is at its lowest level since March. The red and green lines show the signal thresholds for each indicator.
Overall, I consider these breadth models as trend-following type indicators. They will not predict a top or bottom and they will lag, just like a moving average. Overall, nine of ten models are bullish and the 5/200 day SMA cross is positive for four of the five indexes (SPX, NDX, OEX, MID). The bulk of the evidence is still bullish for the broader market.
Yes, you read that headline correct. Despite a sharp decline over the last five days, there were no new bearish signals in the sector breadth model. All three indicators are bullish for five of the six biggest sectors (XLK, XLC, XLV, XLY, XLI). XLF remains net bearish and is the second weakest sector overall. XLE takes bottom honors. Overall, seven of eleven sectors are net bullish and 23 of 33 indicators are on active bullish signals.
The next chart shows the 10-day EMA of Advance-Decline Percent for the six largest sectors. This is the most sensitive of the three breadth indicators and usually the first to trigger. The green and red ovals show the bullish signals (cross above 30%) and bearish signals (cross below -30%). All six triggered bullish by late April and all six remain bullish. The trend trouble starts when three of the six trigger bearish.
The red line is set at -20% so we can benchmark current downside participation. Currently, XLK is at -19.5% and the lowest of the six, which means this sector experienced the most downside participation (declines as a percent of total issues). Next we have XLF (-18.4%), XLC (-17.66%) and XLV (-15.6%). Note, however, that XLV dipped well below -20% before rebounding.
Yield Spreads and the Fed Balance Sheet
There is no real change in the AAA or BBB bond spreads. Both fell back to their pre-crisis levels and stabilized. The red lines mark my subjective lines in the sand. A move above 1 in the AAA spread and 2 in the BBB spread would show some stress in the credit markets and be negative.
The Junk bond spread fell back below its pre-crisis highs and stabilized the last few months. Stabilization at relatively low levels is ok. An upturn would not be ok. A move above 6 would show stress in the junk bond market and be negative for stocks. Note that junk bonds act more like stocks because they are tied to the economy. Unless, of course, there is an invisible hand buying up junk.
There is not much change in the Fed balance sheet over the last few months (since June). After the massive expansion from March to May, the balance sheet contracted a little from June to mid July and then expanded a little from July to September.
")