Stock-related ETFs remained strong and many so-called overbought ETFs became even more overbought as their uptrends extended. Many ETFs are in the trend-monitoring or waiting phase. The early breakouts occurred in July and these ETFs followed through with further gains the last several weeks. Some tech-related ETFs stalled in late July and early August, but caught a second wind with breakouts over the last few weeks.
ETFs in the middle groups (7 and 8) hit new highs a few weeks ago and then corrected with either consolidation patterns (GLD, GDX) or pullbacks (IBB, XBI). The bond-related ETFs are also in this group. It seems that these defensive/alternative ETFs were in favor before the stock market moved into second or third gear. Even though they are lagging short-term, the pullbacks are deemed corrections within the bigger uptrend.
The bottom groups (11, 12, and 13) are lagging and we are seeing some fresh breakdowns in the energy-related ETFs. Some finance-related ETFs are also showing signs of weakness as their bounces retraced around half of the prior decline and they broke wedge/channel lines recently. The bond-proxies (XLU, XLRE, IYR) are still going nowhere and lagging.
I would encourage you to check out the annotated chartbook, which is linked above. The charts are grouped according to their trend/pattern characteristics. In addition, the commentary is on the charts for easy access and there are plenty of annotations.
The charts below are linked to an equivalent StockCharts chart.
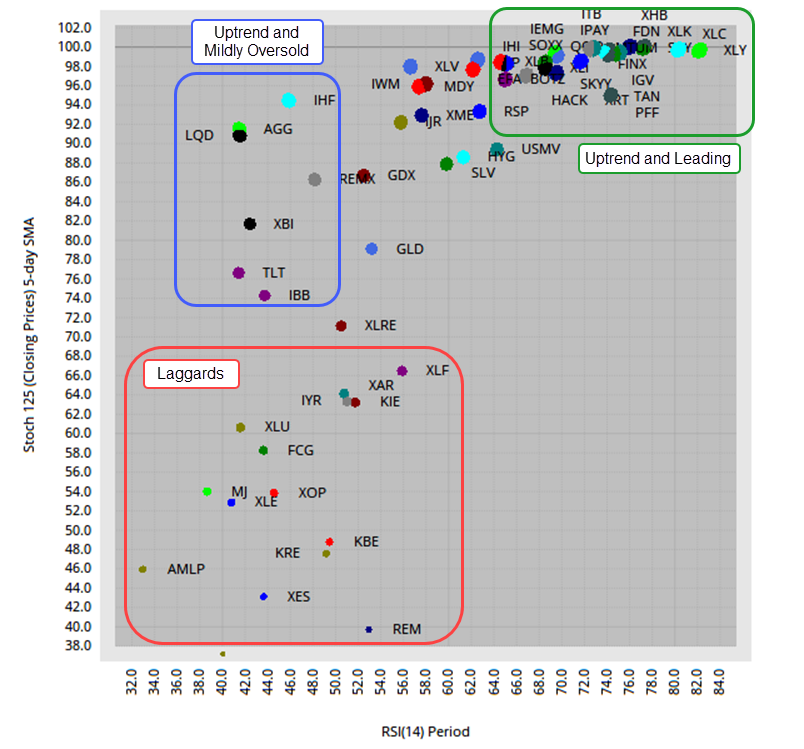
ETF Scatter Plot and Ranking Table
The scatter plot highlights three groups: the correcters, the leaders and the laggards. There is a big cluster in the upper right (green outline) and these are the leaders. They have high StochClose values (>90) and high RSI values (>65). The red outline shows the laggards in the lower left. They have relatively low StochClose values, which means they are lagging and/or in downtrends. They also have relatively low RSI values, which means they fell the last one to two weeks. The blue zone highlights the “interesting” ETFs, which are the so-called “correcters”. These are ETFs that are in uptrends and have relatively low RSI values. This means we are seeing a pullback within an uptrend.
See this article to learn more about the StochClose indicator.
The next image shows the ETF ranking table and a resurgence in the tech-related ETFs. After falling back the last few weeks, the Software ETF (IGV), Internet ETF (FDN) and Cloud Computing ETF (SKYY) surged in the rankings with big moves. Overall, we are seeing strength in Technology (QQQ, XLK, FINX, XLC, SOXX), Consumer Discretionary (XLY, ITB, XHB, XRT) and select Healthcare (XLV, IHI).
1) Early July Breakout, Strong Advance, 52-week Highs:
XLY, ITB, XHB, XRT, TAN
2) Early July Breakout, Steady Advance, 52-week Highs
SOXX, HACK, FINX, BOTZ, XLB
3) Early August Breakout, New 52-week High
QQQ, XLK, XLC, FDN
4) Mid-Late August Breakout, New 52-week High
MTUM, IGV, SKYY
5) Early-Mid July Breakout, First 52-week High
SPY, XLP, IPAY
6) Consolidation Breakout, Near 52-week High
XLV, IHI
7) Increasing Volatility, Consolidation, Near 52-week High
GDX, GLD, SLV
8) Pullback after 52-week High, RSI Mildly Oversold
XBI, IBB, REMX, AGG, TLT, LQD
9) Mid July Breakout, Above June High, No 52-week High
IWM, USMV, XLI, XME, VIG, PFF, HYG, IEMG, EFA
10) Mid July Breakout, Did not Hold above June High
MDY, IJR, IHF, RSP
11) Consolidation Since June, below 200-day
XLE, KBE, KRE, REM, AMLP
12) Mid July Breakout, Below June High, Below 200-day
")