

The total number of new highs in the S&P 500, S&P MidCap 400 and S&P SmallCap 600 continues to underwhelm. Even so, new highs are still outpacing new lows and this is enough to keep the uptrend since late March going. The first chart shows new highs and lows for the three indexes with horizontal lines at the 10% level (e. g. 50 and -50 for the S&P 500).
New 52-week Highs Underwhelm, But Outpace New Lows Read More »

The bulk of the evidence remains bullish for large-caps, large-cap techs and mid-caps, but mixed for small-caps. I am also seeing mixed performance within the S&P 500, especially when looking at the equal-weight sectors. Technology, Healthcare and Consumer Discretionary remain strong, while Finance, Energy and REITs are weak. Finance is the only big sector that shows underlying weakness though.

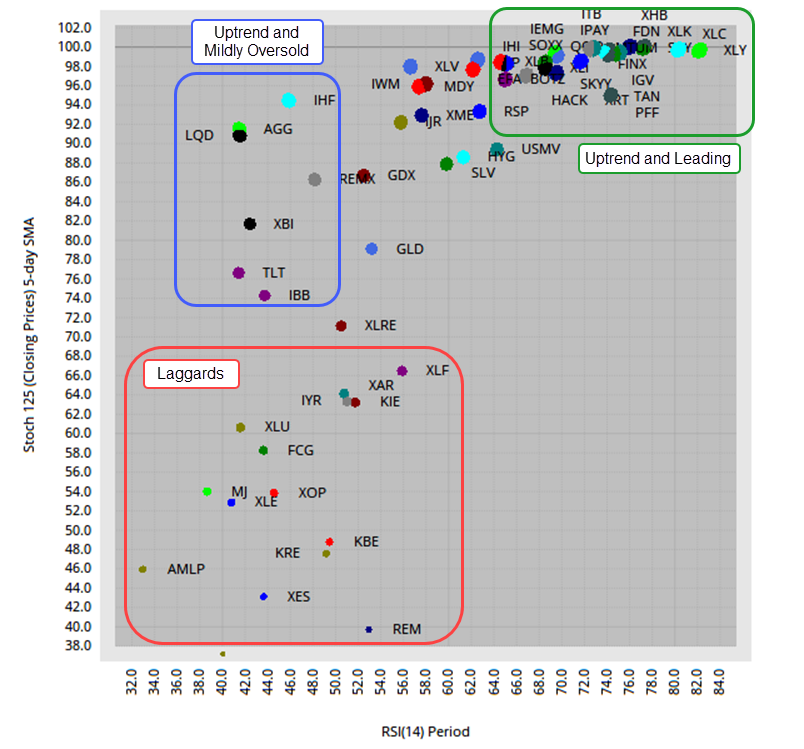
Today’s video will focus on the core ETF charts. We will start with the scatter plot and see that the bond ETFs in the upper left, which means they are oversold and in uptrends. On the ranking tables, ETFs related to Consumer Discretionary, Healthcare and Technology are leading. I continue to follow the Chandelier Exits for several ETFs as their uptrends extend (XLY, ITB, XRT). Elsewhere
Despite the usual pockets of weakness, there is still plenty of strength out there in ETF land. Housing, Retail and Consumer Discretionary ETFs moved to new highs. Tech-related ETFs remain mixed with some hitting new highs and some moving back into their consolidation patterns. Precious metals ETFs got sizable mean-reversion bounces, but it looks like volatility is picking up in this group.

I received some pertinent questions over the weekend and create a post to share the answers. My email answers were not as detailed as in this post, which provides more details and examples. The first question deals with the StochClose ranking and how to use it. This answer will also highlight seven broad trading strategy groups. Second
Even though the current advance is getting quite extended, the broad market environment remains bullish and the medium-term uptrends rule. Tech-related ETFs and stocks drove the market higher from late March to late June. Even though the tech surge slowed, participation broadened over the last six weeks as other groups picked up the slack. The Industrials SPDR (XLI) is the top performing sector since July 1st
There are still a lot of uptrends out there in ETF land, and this includes some key stock-related ETFs. Nevertheless, we are seeing some rotation at work the last few weeks. The tech-related ETFs slowed their advance and some even failed to hold their breakouts. Meanwhile, ETFs related to consumer discretionary continued higher and are leading the pack. However, some of these new leaders are getting extended (XLY, XHB).

The Healthcare SPDR (XLV) is one of the strongest sectors in 2020. Even though it does not sport the biggest gain, XLV recorded a new high in July and some 80% of its components are above their 200-day EMAs. The new high points to a long-term uptrend and upside leadership, while the percentage of stocks above the 200-day EMA points to broad strength within the sector. Sector SPDRs, however, are only as strong as the sum of their parts (component stocks).
Four Stocks Poised to Drive Healthcare Higher Read More »
The chart below shows year-to-date performance for the top 20 stocks in the S&P 500. Overall, the year is mixed with eleven up and nine down. Amazon is up over 70%, Apple is up over 50% and Microsoft is up over 30%. Facebook and Home Depot are dragging their feet with gains greater than 20%. As strong as the stock market seems, strength is clearly concentrated in a few stocks. Moreover, these few stocks are up big, really big.
After some volatility and big moves in March, April and May, trading has turned downright boring the last few weeks. Nevertheless, the majority of breakouts are holding and there are plenty of leaders. Tech, housing, retail, precious metals and Healthcare continue to lead. ETFs related to Finance and Energy continue to lag. Industrials and small-caps perked up this week and extended on their breakouts, which were looking rather feeble just last week.
There are times for setups and signals, and there are times to wait. The waiting game is either waiting for the next setup/signal to materialize or monitoring the current signal in play. At this stage, we are in the monitoring stage for several signals that triggered in the first half of July.
The slow rotation continues in the stock market. Tech and biotech related ETFs lagged over the last five days with declines, while ETFs related to housing, retail, banks and small-caps picked up the slack. Note that SPY is down .53% the last five days and the S&P SmallCap 600 SPDR (IJR) is up 1.94%.
ETF Ranking and Grouping – Slow Rotation, BB Breakouts and Stock Alternatives Read More »
My current focus remains on the medium-term up trends, which began with the surge in late March. The bulls are still in control of these medium-term trends and we saw several short-term breakouts in July. Some breakouts were strong as price exceeded the June high (SPY), while some were feeble as price remains well below the June high (RSP). Strong or feeble, the breakouts are still holding and have yet to be proven otherwise.
Timing Models – Medium-term Uptrends, Short-term Breakouts and QQQ Exuberance Read More »
After a dip in June, stocks and ETFs bounced back in July with several breakouts occurring over the last few weeks. In addition, groups that were lagging from April to June are leading over the last two weeks. It is positive to see some of these laggards play catch up and it is also positive to see the advance broadening.
ETF Ranking and Grouping – Breakouts Hold as Participation Broadens Read More »

There were a number of Bollinger Band squeeze plays over the last two weeks and also a number of breakouts. These breakouts are bullish until proven otherwise, but chartists should also be aware of the head fake. In his book, Bollinger on Bollinger Bands, here’s how John Bollinger puts it: Traders beware! There is a trick to The Squeeze, an odd turning of the wheel that you need to be aware of, the head fake.
A Bollinger Band Breakout or the Dreaded Head Fake? Read More »
The stock market remains mixed, which means it is a stock picker’s market. As the broad breadth measures suggest, this is not a bull market that lifts all boats and makes everyone look smart. This is a relatively narrow bull market with tech, healthcare and communication services leading the way.
Timing Models – Small and Mid Caps Perk Up and Join the Breakout Parade Read More »
The leading ETFs took a breather over the past week and the laggards picked up the slack. The Nasdaq 100 ETF and Technology SPDR are down slightly, while the Regional Bank ETF and Metals & Mining SPDR are up sharply. Even though the rotation into the lagging groups may seem healthy, keep in mind that the Technology sector is still the biggest driving force in the S&P 500.

The cup remains half full for the S&P 500 SPDR, but half empty for the S&P 500 EW ETF. This could change as RSI firms in a potential reversal zone with a Bollinger Band contraction. Bearish candlesticks are not slowing down QQQ and even IWM could be ripe for a breakout.
Candles to Ignore and Bollinger Band Contractions to Watch Read More »
The mixed market is reflected on the ETF charts with tech-related ETFs hitting new highs and underperforming ETFs testing support levels. Will the leaders pull the laggards up or will the laggards drag the leaders down? Or, do we just need to analyze each chart on its own merits? Probably the latter. Several ETFs are at a moment of truth as their medium-term breakdowns collide with short-term support and reversal zones.
The stock market remains mixed overall with pockets of serious strength and pockets of weakness. The Technology and Healthcare sectors continue to lead, while the Finance and Energy sectors lag. QQQ hit a new high and is leading SPY, while large-caps are leading small and mid caps.
Timing Models – Broad Market is Mixed, but Large-caps Maintain Bullish Edge Read More »