Despite the usual pockets of weakness (Energy and Banks), there is still plenty of strength out there in ETF land. Housing, Retail and Consumer Discretionary ETFs moved to new highs. Tech-related ETFs remain mixed with some hitting new highs and some moving back into their consolidation patterns. Precious metals ETFs got sizable mean-reversion bounces, but it looks like volatility is picking up in this group. Bond-related ETFs are setting up for possible mean-reversion bounces with oversold RSI. The two Biotech ETFs popped on Monday and could be poised to end their short corrections. Elsewhere, we are seeing flag/pennant breakouts in XLV, IHI and MTUM.
I would encourage you to check out the annotated chartbook, which is linked above. The charts are grouped according to their trend/pattern characteristics. In addition, the commentary is on the charts for easy access and there are plenty of annotations.
The charts below are linked to an equivalent StockCharts chart.
Programming Note: I have a short break scheduled from Friday to Monday. Whisking the family away to the beach before school starts. Today's report is coming to you a day early and the Market Timing Report will be published tomorrow, as well as a video. Normal scheduling will resume next week.
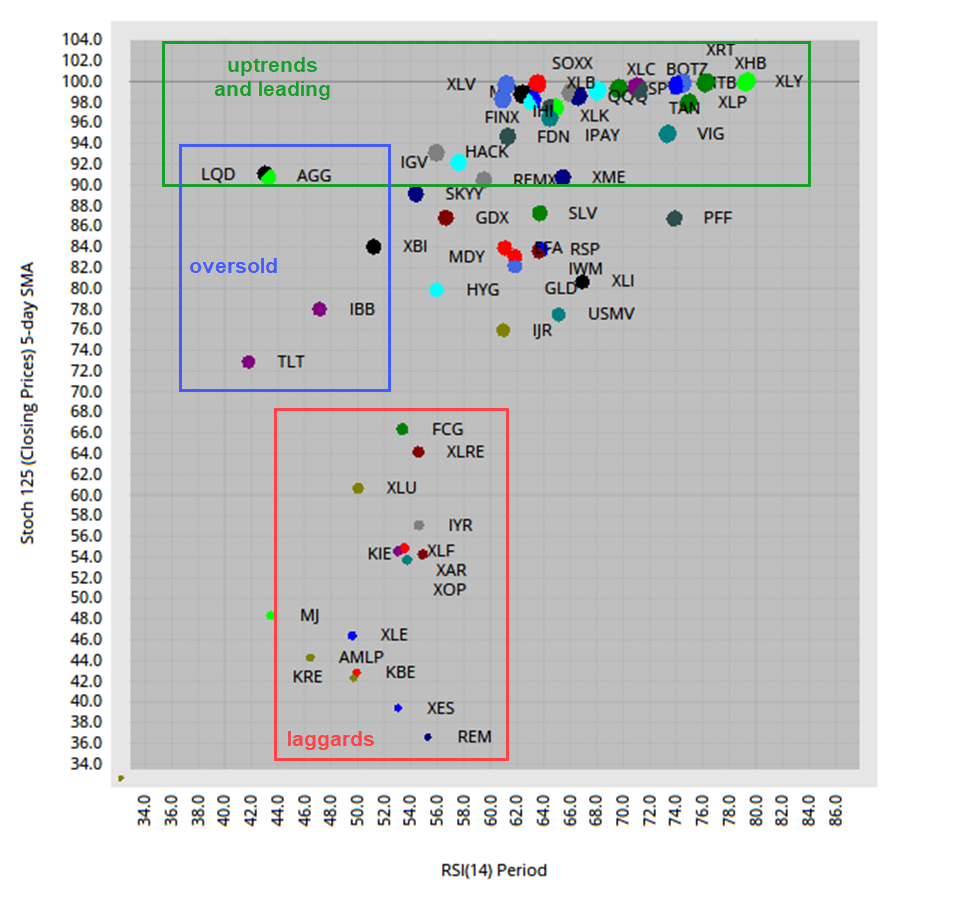
ETF Ranking Table and Scatter Plot
The ETF ranking table shows the top 20 plus three (FDN, HACK, IGV). Even though these three are not part of the top 20, they are still in uptrends because StochRSI is above 90. They fell in the rankings because they stalled when other ETFs continued higher the last four to six weeks. These include XLP, IHF, IPAY and FINX. Overall, ETFs related to consumer discretionary, healthcare and technology are leading. Bond and precious metals ETFs fell in the rankings after hard pullbacks the last two weeks. However, they became prime for mean-reversion bounces.
See this article to learn more about the StochClose indicator.
The scatter plot shows plenty of strong uptrends out there. The y-axis covers StochClose (125,5) and the green outline highlights ETFs with values above 90. The red outline highlights the laggards. Even though some are in uptrends (FCG), they are not leaders and most are in downtrends (XLE, XLF, KRE, KBE, XAR, XES). The x-axis covers RSI(14) and the blue zone highlights ETFs that are oversold (RSI values between 30 and 50). Well, XBI is just above 50. ETFs that are oversold and in long-term uptrends could be primed for mean-reversion bounces.
July Breakout, Strong Extension, Another New High
FINX, BOTZ, SOXX, TAN, XLY, XLB, ITB, XHB, XRT
ETFs in group 1 are leading the pack with fresh new highs. These ETFs broke out of consolidation patterns in early July and followed through with further gains into mid August. It is positive to see the Semiconductor ETF (SOXX) continue to lead with a new high again this week. Notice that RSI has not been below 50 since early April. The advance is getting long in tooth, but there are no signs of weakness. The breakout zone and July lows mark first support in the 270-280 area.
The Consumer Discretionary SPDR (XLY) remains on a tear as the next round of stimulus nears. The ETF broke out of a pennant in early July and never looked back on its way to a 15+ percent advance. RSI was near 75 last week and is near 80 this week as the overextended simply become more overextended. Chartists interested in trailing stops can consider the Chandelier (20,3).
The Home Construction ETF (ITB) and Retail SPDR (XRT) are up even more and hitting new highs. These two charts are shown with the Chandelier (20,2), which is a little tighter. Tighter stops get you out quicker, but increase the chance of whipsaw (getting out too early). Wider stops keep you in the trend longer, but give back more of the gains when they are hit. Technical analysis is one big double-edge sword!
July Breakout, Extension and Near New High
SPY, XLP, IPAY, IHF
Consolidation Breakout and Near New High
QQQ, XLK, XLC, MTUM, XLV, IHI
ETFs in this next group can be split into two subgroups. QQQ, XLC and XLK consolidated in July and broke out in late July or early August. The breakouts held and remain bullish.
The Healthcare SPDR (XLV) and the Medical Devices ETF (IHI) are one to watch now because they are breaking out of rather tight consolidation patterns. XLV hit a new high this week and IHI is very close.
Hard and Short Pullback after Big Run
GDX, GLD, SLV, AGG, TLT, LQD
New High followed by Consolidation or Pullback
SKYY, FDN, HACK, IGV, IBB, XBI
July Breakout and Currently Above June High
IWM, USMV, XLI, XME, VIG, PFF, IEMG
July Breakout and Barely Exceeded June High
MDY, IJR, HYG, EFA
July Breakout, but did not Exceed June High
RSP
Near 200-day with Slooooooow Grind Higher
XLU, XLRE, IYR
July Breakout, below 200-day and did not Exceed June High
")