Market and ETF Report – Two Trends and Two Conditions, Best versus Worst, XLE is the Most Volatile Sector, GOLD has Low Volatility, but….(Premium)

Today’s report to put trend and volatility together so we can identify the best conditions, the worst conditions and the questionable conditions. Most of us know that current conditions are the worst for stocks because we are in a bear market with high volatility. We will chart volatility to show when it is deemed high and then compare volatility using tables for the major index ETFs, sectors and commodity ETFs. Charts for SPY, QQQ, XLE, XLV and GLD are also included.

About the ETF Trends, Patterns and Setups Report

This report contains discretionary chart analysis based on my interpretation of the price charts. This is different from the fully systematic approach in the Trend Composite strategy series. In this ETF Trends, Patterns and Setups report, I am looking for leading uptrends and tradable setups within these uptrends. While I use indicators to help define the trend and identify oversold conditions within uptrends, the assessments are mostly based on price action and the price chart (higher highs, higher lows, patterns in play). Sometimes the chart assessment can be at odds with the indicators.

You can learn more about my chart strategy in this article covering the different timeframes, chart settings, StochClose, RSI and StochRSI.

Trend and Volatility Scenarios

There are basically two trends and two conditions for stock prices: uptrend, downtrend, high volatility and low volatility. We could add trading range and average volatility for more nuance, but I will stick to the first four for now. This means we have four different combinations possible:

  • uptrend with low volatility (best scenario)
  • uptrend with high volatility (risk increasing)
  • downtrend with low volatility (risk decreasing)
  • downtrend with high volatility (worst scenario)

Obviously, the ideal trading environment is an uptrend with low volatility, which we had for almost all of 2021. The current environment is the least ideal: downtrend with high volatility. High volatility often accompanies a downtrend and basically doubles the risk.

SPY Is in a Downtrend with High Volatility

The chart below shows SPY with Bollinger Bands (125,1) on the price chart and three volatility measures. The Bollinger Bands are set 1-Standard Deviation above/below the 125-day SMA. Volatility is increasing when the bands widen and decreasing when the bands narrow. The 22-day SMA of the 1-day Absolute Rate-of-Change tells us the average percentage move over the past month and it has been above 1% since late April (red). The 22-day Annualized Standard Deviation of log price changes represents monthly volatility and has been above 20% since late April (red). Bollinger BandWidth (125,1) represents the percentage difference between the upper and lower Bollinger Bands and it has been rising since February (above the 125-day SMA).

Notice that the volatility measures on the chart above were under control in 2021, except for a brief pop in late December (red bars). Currently, the 22-day average change in SPY is 1.5% and the monthly Standard Deviation is near 30%. These numbers confirm that volatility is high and this means risk is above average. BandWidth is above 12% and at its highest level since October 2020. High volatility also explains why bear market rallies can be so sharp.

Comparing Volatility Values

Volatility measures are relevant to the ETF or stock, but can also be compared. We use the charts to determine when volatility levels are relatively high for each ETF. For example, compare 2021 levels with 2022 levels. We can also compare levels against other ETFs. QQQ inherently has higher volatility than SPY, and the Technology SPDR (XLK) has higher volatility than the Consumer Staples SPDR (XLP). As such, I set the thresholds a little higher for QQQ. The next chart shows QQQ with the 22-day SMA of 1-day Abs ROC above 1.5% for most of the time since February. The monthly annualized standard deviation has been above 30% and BandWidth has been rising since late February. This is also a downtrend with high volatility.

The Trend Composite aggregates signals in five trend indicators: Bollinger Bands (125,1), Keltner Channels (125,2), 5-day Rate-of-Change of 125-day SMA, StochClose (125,5) and CCI-Close (125). The Trend Composite and ten other indicators are part of the TIP Indicator Edge Plugin for StockCharts ACP

Volatility Tables for Major index ETFs and Sectors

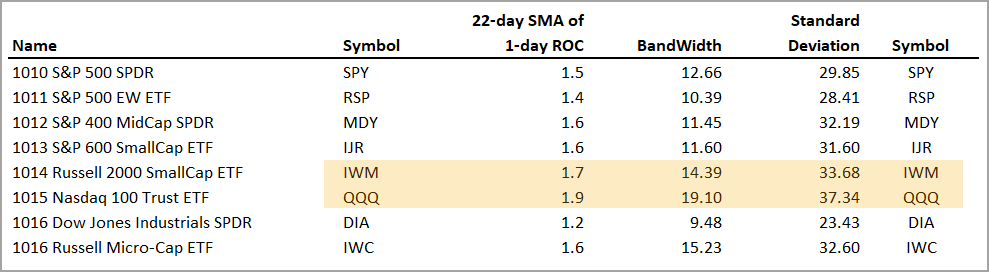
We cannot use volatility indicators to generate bullish and bearish signals. These indicators simply represent conditions and allow traders to put risk into perspective. QQQ is clearly more volatile and riskier than SPY because its volatility measures are generally higher. The table below shows the volatility indicator values for the major index ETFs. QQQ and IWM are the most volatile of the group (yellow shading), while the S&P 500 EW ETF (RSP) and Dow Diamonds  (DIA) are the least volatile. Expect a wilder ride if trading QQQ and IWM.

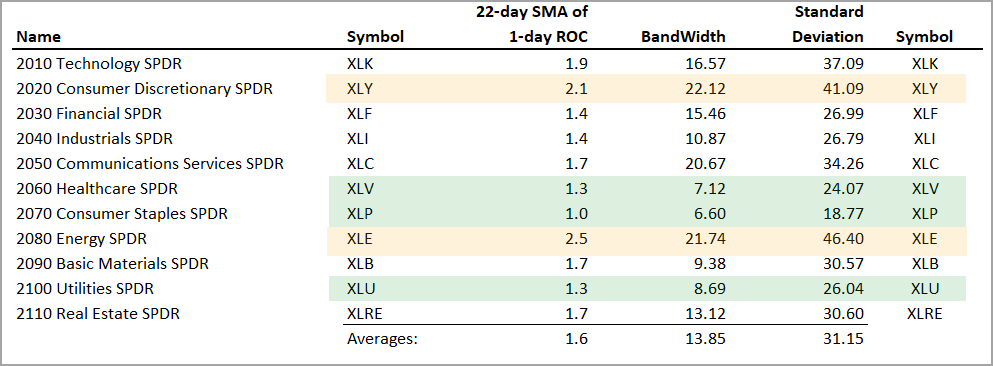
The next table shows the sector SPDRs with the volatility indicators. The Consumer Discretionary SPDR (XLY) and Energy SPDR (XLE) stand out as the most volatile sectors with the Technology SPDR (XLK) not far behind. XLK and XLY are in downtrends, but XLE is in an uptrend. It is also the most volatile sector and this means traders should brace themselves for a wild ride. Note that an uptrend with high volatility means risk is increasing.

You can learn more about exit strategies in this post,
which includes a video and charting options for everyone.

Comparing XLV to XLE

The chart below shows XLV, which is one of the best houses in a bad neighborhood. The bear market is the neighborhood and XLV is a stock-based ETF (one of the houses). This means it is vulnerable because the neighborhood is not what it used to be. XLV is in a downtrend now and volatility has been above average since mid February. Even though its volatility relatively low compared to the other sectors, its volatility levels are much higher now than in 2021. XLV is the one of the better houses in the neighborhood because it is one of the few sectors that got back above its February-May lows.

The next chart shows XLE falling back into the Bollinger Band area with a sharp decline in June. The long-term trend is still up, but volatility is rearing its ugly head as the 22-day SMA of the Absolute 1-day Rate-of-Change nears 2.5%. The red bars show when this indicator is above 2% and most bars are red since early May. The standard deviation is also mostly red with most bars above 40% since early May. XLE is in an uptrend, but it is less than ideal right now. The same applies for the other energy-related ETFs.

Traders wishing to manage volatility can consider position sizing, which is what the Turtle Traders and many trend followers do. Basically, the size of the position is reduced when volatility is above average. XLE volatility is well above the average and traders wishing to lessen risk can consider smaller positions (say 50% of a normal positions).

The Momentum Composite aggregates signals in five momentum-type indicators to identify short-term overbought and oversold conditions. This indicator is part of the TIP Indicator Edge Plugin for StockCharts ACP

Commodity-Based ETFs

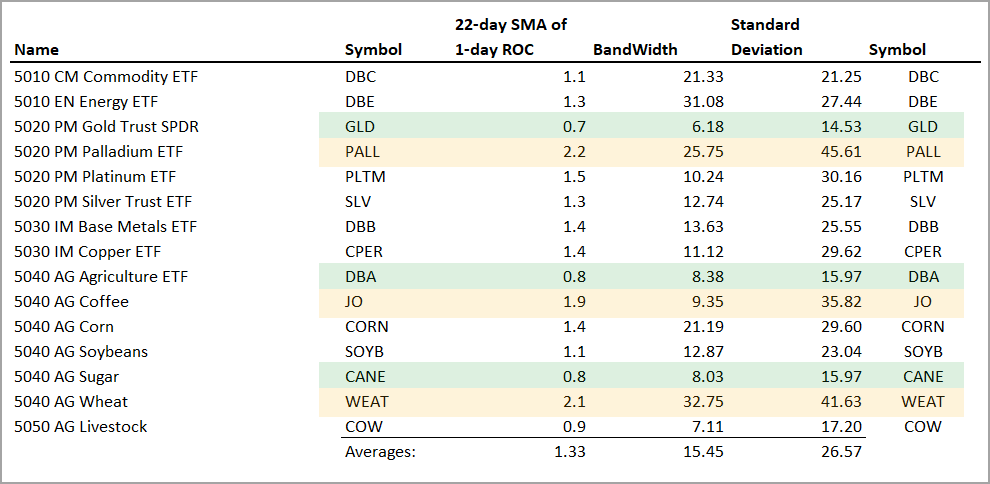
The next table shows the commodity ETFs with the volatility values. The Gold SPDR (GLD), DB Agriculture ETF (DBA) and Sugar ETF (CANE) have the lowest volatility of the group. The Palladium ETF (PALL), Coffee ETF (JO) and Wheat ETF (WEAT) have the highest volatility and the most risk. DBA, CANE, WEAT and JO were featured on Tuesday.

The Gold SPDR (GLD) remains in a downtrend with relatively low volatility. A break above 175 is needed to reverse the falling channel.

Charting Note

I am using the 22-day Annualized Standard Deviation of Log Price changes. This is a mouthful. Many charting sites have the Standard Deviation of closing prices, which is NOT the same. This is a point-based number, not a percentage based number that can be compared against itself over time and against other ETFs. StockCharts uses the close-based Standard Deviation and I could not find this indicator on TradingView (affiliate link here). I was, however, able to plot the 1-day Abs(ROC) and add a 22-day SMA to the indicator.

Previous Commentary and Video

Wednesday Market and ETF Video (here)

Market Regime Update with Breadth Model and Yield Spreads (here)

Topics Covered in Tuesday’s Report (here)

  • Bear Market Bounces and Credit Spreads
  • Big Bounces in High Beta ETFs
  • SPY Enters Resistance-Reversal Zone
  • Oil Bounces off Support-Reversal Zone ($WTIC)
  • Nat Gas Hits Support-Reversal Zone (!NG)
  • Energy SPDR Becomes Oversold at Support (XLE)
  • Pullbacks, Falling Knives and Overshoots (XES)
  • Wheat ETF Plunges to Prior Uptrend (WEAT)
  • Big Three Drag Down the DB Agriculture ETF (DBA)
  • Sugar ETF Enters Support-Reversal Zone (CANE)
  • Coffee ETF Fails to Follow Through (JO)
  • Follow Through on Short-term Breakouts (XBI, ICLN, LIT)

You can learn more about my chart strategy in this article covering the different timeframes, chart settings, StochClose, RSI and StochRSI.

Thanks for tuning in and have a great day!

Market/ETF Video – Widespread Weakness, Oil Holds Up as NatGas Hits Support-Reversal Zone, Dollar Remains Strong, Industrial Metals Sink (Premium)

Weakness is widespread throughout the stock market, and other markets. The Composite Breadth Model is and remains bearish. fewer than 20% of S&P 1500 stocks are above their 200-day SMAs and yield spreads show stress in the credit markets. Almost all stock-based ETFs are in downtrends and most of the alternative ETFs are also in downtrends (bonds, gold, silver, the

Market/ETF Video – Widespread Weakness, Oil Holds Up as NatGas Hits Support-Reversal Zone, Dollar Remains Strong, Industrial Metals Sink (Premium) Read More »

Market and ETF Report – Counter-Trend Bounce in SPY, Oil Hits Reversal Zone, XES Overshoots, Wheat Weights on Agriculture ETF (Premium)

Stocks bounced the last five days, but these bounces are considered counter-trend moves within bigger downtrends. One of these counter-trend moves will result in a trend reversal, but this is not the case yet because the weight of the evidence remains bearish for stocks. The first indicator window below shows

Market and ETF Report – Counter-Trend Bounce in SPY, Oil Hits Reversal Zone, XES Overshoots, Wheat Weights on Agriculture ETF (Premium) Read More »

Market and ETF Report – A Brutal Year and Month, Three ETFs Stand Out, Short-term Island Reversal Takes Hold (Premium)

As noted in Tuesday’s report and in Wednesday’s video, the majority of ETFs in the Master List (274) are in downtrends. There are a few groups holding up, but even energy and agriculture were hit with selling pressure here in June. Mr Market is dazed, confused

Market and ETF Report – A Brutal Year and Month, Three ETFs Stand Out, Short-term Island Reversal Takes Hold (Premium) Read More »

Market/ETF Video – Stocks are Oversold within Strong Downtrends, Downside Participation is High, Ag, Energy and Dollar are Standouts  (Premium)

The major index ETFs and big sector SPDRs extended their downtrends and recorded fresh 52-week lows over the last few days. New lows were also seen in most tech and consumer discretionary ETFs. The Composite Breadth Model reflects the broadness of downside participation and widening yield

Market/ETF Video – Stocks are Oversold within Strong Downtrends, Downside Participation is High, Ag, Energy and Dollar are Standouts  (Premium) Read More »

Market and ETF Report – Bear Market and Oversold, Energy ETF Get Hit, Ag ETFs Hold UP, 3 with Relative Chart Strength (Premium)

There are a lot of downtrends out there and not just stock-based ETFs. The vast majority of stock-based ETFs are in downtrends with Trend Composite values in negative territory. ETFs related to industrial metals, precious metals, bonds and non-Dollar currencies are also in downtrends

Market and ETF Report – Bear Market and Oversold, Energy ETF Get Hit, Ag ETFs Hold UP, 3 with Relative Chart Strength (Premium) Read More »

Market/ETF Video – Bear Market Broadens as %Above 200-day Sinks and New Lows Surge, Energy and Agriculture are Last Groups Standing  (Premium)

The major index ETFs extended their downtrends with a vengeance over the last five trading days. It was a most exceptional period because almost everything declined the last five days – and I do mean everything. 52-week lows expanded

Market/ETF Video – Bear Market Broadens as %Above 200-day Sinks and New Lows Surge, Energy and Agriculture are Last Groups Standing  (Premium) Read More »

Market and ETF Report – Nowhere to Hide, Short-term Oversold in Bear Market, Oil and Ag Still in Uptrends (Premium)

It was a “sell everything” moment the last four days as stocks, bonds, commodities and non-Dollar currencies declined. The Dollar Bullish ETF (UUP) rose 2.82% the last four days and the Corn ETF (CORN) was up .46%. Those are the only two ETFs

Market and ETF Report – Nowhere to Hide, Short-term Oversold in Bear Market, Oil and Ag Still in Uptrends (Premium) Read More »

Market and ETF Report – SPY Near Reversal Zone, XLU Holds Up, XLP Gets Counter-Trend Bounce, Home Construction Shows Relative Strength (Premium)

Small-caps are outperforming large-caps over the last one to two weeks because large-caps stalled and small-caps continued higher. Even so, I am not following the siren song of small-cap relative strength and am more concerned with short-term relative weakness in

Market and ETF Report – SPY Near Reversal Zone, XLU Holds Up, XLP Gets Counter-Trend Bounce, Home Construction Shows Relative Strength (Premium) Read More »

Market/ETF Video – %Above 200-day, New Highs vs Lows, Gold and Copper Hold Breakouts, Materials and Defense ETFs Surge, Ag and Wheat Are Setting Up (Premium)

The major index ETFs are in the midst of a bounce, but this bounce is still considered a bear market bounce. The bigger trends are still down for SPY and QQQ, the Composite Breadth Model is negative and yield spreads are elevated. Despite bullish breadth thrusts in late May, the percentage of stocks above their 200-day SMAs

Market/ETF Video – %Above 200-day, New Highs vs Lows, Gold and Copper Hold Breakouts, Materials and Defense ETFs Surge, Ag and Wheat Are Setting Up (Premium) Read More »

Market and ETF Report – Energy and Ag with Consistent Uptrends, Some Stock-Based ETFs Holding Up Better, Watching Breakouts in Metals ETFs (Premium)

Today’s report will start with the Composite Breadth Model and some words on the Market Regime because this is the dominant force at work for stocks and stock-based ETFs. Some stock-based ETFs are featured in this report because they are either in uptrends on the price chart, have positive Trend Composites or held their January-March lows (did not break down).

Market and ETF Report – Energy and Ag with Consistent Uptrends, Some Stock-Based ETFs Holding Up Better, Watching Breakouts in Metals ETFs (Premium) Read More »

Market and ETF Report – TLT Turns Down Again, Dollar Breaks Out, Gold Firms after Breakout, Platinum Show Relative Strength (Premium)

Today’s report starts with bonds, the Dollar and gold. I am not, however, going to tie moves in one asset to movements in another. There are some relationships at work, but relations and correlations change and sometimes do not work out as expected. Instead, I will simply analyze

Market and ETF Report – TLT Turns Down Again, Dollar Breaks Out, Gold Firms after Breakout, Platinum Show Relative Strength (Premium) Read More »

Market/ETF Video – Bounces within Bigger Downtrends for SPY and Five Big Sectors, Choosing what to Focus on and What to Ignore (Premium)

The major index ETFs got big bounces last week, but these are still oversold bounces within bigger downtrends and within the context of a bear market. Despite some breadth thrusts, the Composite Breadth Model remains bearish and yield spreads remain very elevated. Gold is struggling to hold its breakout as the Dollar and

Market/ETF Video – Bounces within Bigger Downtrends for SPY and Five Big Sectors, Choosing what to Focus on and What to Ignore (Premium) Read More »

Market and ETF Report – Oversold Bounces within Bigger Uptrends, The Real Leaders, Chart Strength by Holding Jan-Feb Lows (Premium)

There was a big oversold bounce with some of the most beaten down ETFs leading the way. The ARK Innovation ETF (ARKK), Clean Energy ETF (PBW), Consumer Discretionary SPDR (XLY), Cloud Computing ETF (SKYY) and Home Construction ETF (ITB) were up over 10% in three days.

Market and ETF Report – Oversold Bounces within Bigger Uptrends, The Real Leaders, Chart Strength by Holding Jan-Feb Lows (Premium) Read More »

Palladium: A Trend Changing Event or Correction Overshoot? – Plus another Commodity ETF with a Wedge Correction (Premium)

There are two commodity ETFs with falling wedge patterns working. One falling wedge resulted in a deep pullback and the other in a shallow pullback. Either way, I view these falling wedges as corrections within uptrends and am watching for breakouts. This article will look at the deep pullback in the

Palladium: A Trend Changing Event or Correction Overshoot? – Plus another Commodity ETF with a Wedge Correction (Premium) Read More »

Market and ETF Report – Working with Benchmark Lows, Setting Levels that Prove Breakouts Wrong, Using the ATR Trailing Stop (Premium)

The market regime is bearish, but SPY and QQQ are still in oversold territory that could give way to a bounce. In addition, we are seeing short-term strength in some of the high-beta ETFs as Treasury yields fell over the last two weeks. Personally, I am not

Market and ETF Report – Working with Benchmark Lows, Setting Levels that Prove Breakouts Wrong, Using the ATR Trailing Stop (Premium) Read More »

Market/ETF Video – Oversold in a Bear Market and Long-term Downtrend, Slim Pickings in Stock-Based ETFs, Metals Come Alive (Premium)

Stocks remain short-term oversold and the major index ETFs are still near their May lows. This could give way to a bounce, but the bear market and long-term downtrends continue to provide stiff headwinds. There

Market/ETF Video – Oversold in a Bear Market and Long-term Downtrend, Slim Pickings in Stock-Based ETFs, Metals Come Alive (Premium) Read More »

Market and ETF Report – Energy and Ag Still Leading, Utilities Hit Moment of truth, Metals-Related ETFs Make a Move (Premium)

The market regime remains bearish because the Composite Breadth Model is negative and yields spreads are showing stress in the credit markets. Note that the BBB spread exceeded its March high over the last few days. Short-term, stocks are still quite oversold after a big decline from mid April to early May. Oversold

Market and ETF Report – Energy and Ag Still Leading, Utilities Hit Moment of truth, Metals-Related ETFs Make a Move (Premium) Read More »

Market and ETF Report – Bearish Outcomes, Trend Composite All Weather Update, Consumer Staples Breakdown (Premium)

Bearish outcomes are more likely in a bear market and this is playing out as even the defensive groups were hit with selling pressure on Wednesday. We are also seeing this play out in certain commodities, such as industrial metals. Industrial metals

Market and ETF Report – Bearish Outcomes, Trend Composite All Weather Update, Consumer Staples Breakdown (Premium) Read More »

Market/ETF Video – Bear Market Bounce, Yield Spreads Surge, Energy and Ag Lead, Safe-Haven Stock Groups Hold Up Best (Premium)

Stocks became extremely oversold last week after strong selling pressure and sharp declines. We are seeing an oversold bounce right now, but this is considered a bear market bounce because the Composite Breadth Model is net bearish and yield spreads show serious stress in the credit markets.

Market/ETF Video – Bear Market Bounce, Yield Spreads Surge, Energy and Ag Lead, Safe-Haven Stock Groups Hold Up Best (Premium) Read More »

Scroll to Top