Bearish outcomes are more likely in a bear market and this is playing out as even the defensive groups were hit with selling pressure on Wednesday. We are also seeing this play out in certain commodities, such as industrial metals. Industrial metals, and perhaps energy too, are more linked to economic growth than agricultural products, which are holding up for now. We covered the commodity-related ETFs on Tuesday. Today’s report will update the Trend Composite Strategy that uses the All-Weather list. We will then look at trend-following signals and cover the breakdowns in ETFs related to Consumer Staples.
Trend-Following: the Ugly, the Bad and the Good
Recent volatility led to more whipsaws and loosing trades here in 2022. This is par for the course because there were some BIG trends from summer 2020 to summer 2021. These big trends generated outsized returns and pushed equity lines to new highs. Everyone was a genius a year ago!
Whipsaws and downtrends in 2022 are pushing equity lines lower (drawdowns). Drawdowns are also part of the process. And they are unavoidable. We never know ahead of time which signal will result in a whipsaw and generate a loss, and which will lead to that big uptrend.
Drawdowns are like shooting slumps for NBA players. Players do not change their shot (strategy) during a slump. They stick with their process, shoot less, pass the ball more and wait for the slump to end. Bear markets are similar. We need to trade less, look for alternatives and reduce exposure when the odds are not in our favor.
Next Reports
Saturday – 21-May: ETF Trend Signal and Ranking Table (here)
Tuesday – 24 May: Market-ETF Report and Signal-Rank Table Update
Wednesday – 25 May: Market-ETF Video and Market Regime Update
Thursday – 25 May: Market-ETF Report and Signal-Rank Table Update
All-Weather Trend Composite Strategy Update
The Premium Page features an eight part series using the Trend Composite as part of a strategy to trade the All-Weather ETF List. This list has 50 ETFs: 36 equity-related ETFs and 14 alternatives (bonds, commodities, currencies). The Composite Breadth Model is used for market timing. The idea is to take bullish signals in all ETFs when the Composite Breadth Model is bullish. When the Composite Breadth Model turns bearish, only take bullish signals in the 14 alternatives because they are not as correlated to the stock market. The basic strategy is to buy the ETFs with the highest StochClose values (ranking) and a positive Trend Composite (uptrend). There are a maximum of 14 equal-weight positions. Positions are closed when the Trend Composite turns negative. There is also an option to add a profit target and exit when there is a 12% profit (see part 8). Here is a link to part one.
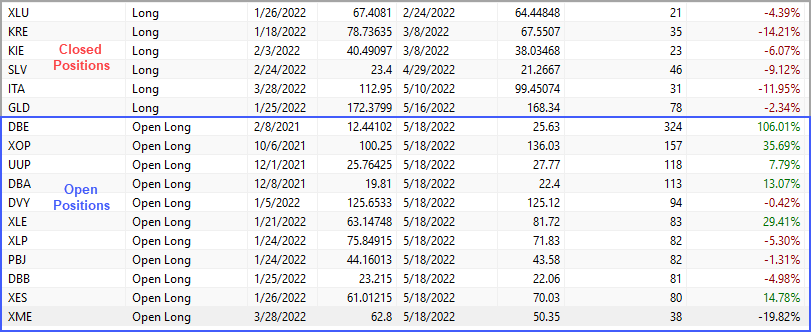
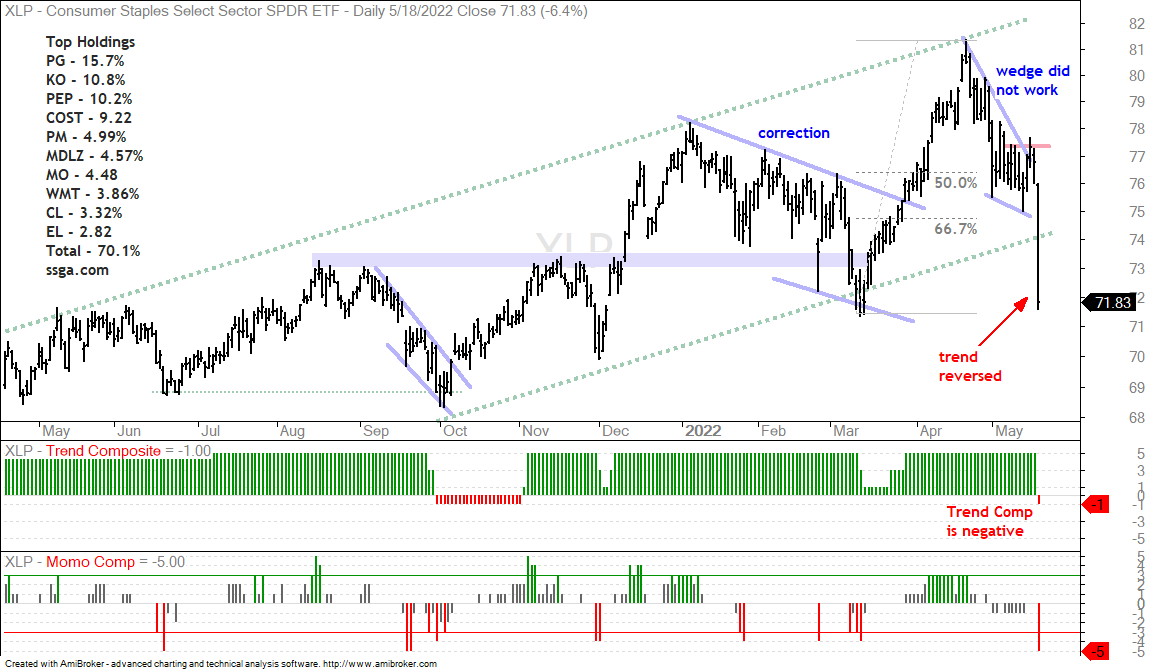
The table below shows some closed trades from 2022 and the 11 open trades currently. The six closed trades at the top were losers and this is why the strategy is down 2.6% year-to-date. This loss will grow because XLP triggered bearish on Wednesday and will be closed on Thursday.
Only 11 of the 50 All-Weather ETFs are in uptrends so these are the only ones in the portfolio. Thus the strategy is only 78% invested. These positions are energy-related, defensive, commodity and currency (UUP). Notice that XOP, DVY, XLE, XLP, PBJ, XES and XME are stock-related and they were added when the Composite Breadth Model was positive. XME was added on March 28th and is currently down 20%, and weighing on performance. Unrealized gains in XOP, XES and XLE are offsetting this loss. 4 of the 11 positions are tied to energy and this is a pretty heavy weighting. This is great as long as oil prices remain strong, but all four would suffer should oil prices turn south.
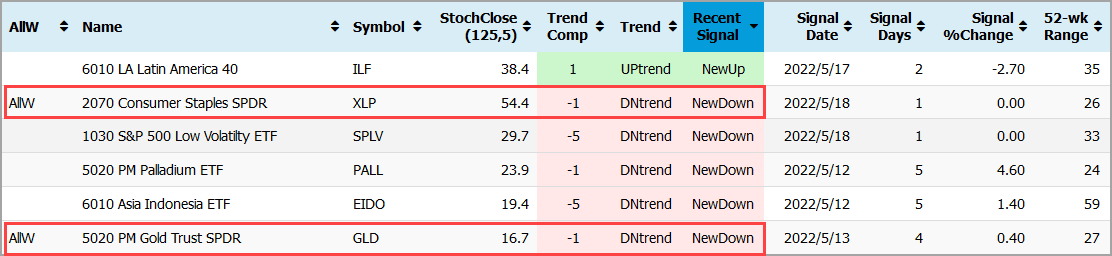
The table shows the recent Trend Composite signals on the Trend Signal and Ranking Table. Click a column heading to sort. The column on the far left shows ETFs that are part of the All-Weather List (AllW). There were downtrend signals in GLD (4 days ago) and XLP (1 day ago).
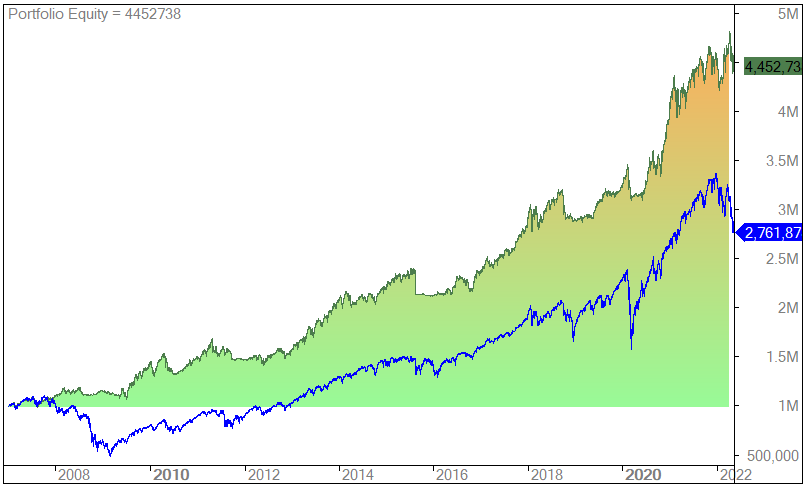
The next chart shows the equity-curve for this strategy (green line). The blue line is buy-and-hold for SPY. The equity curve hit a new high in April and then fell the last six weeks.
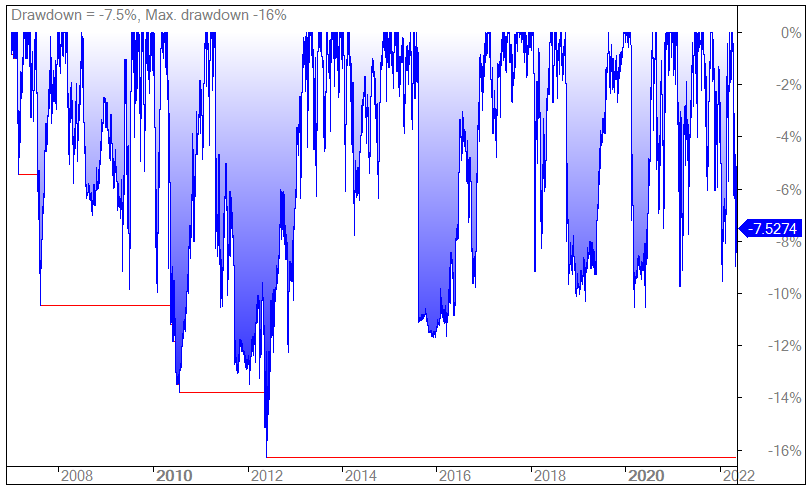
The next chart shows the drawdowns for this strategy. The drawdown dipped below -8% twice this year and is currently at -7.5%, which means current equity is 7.5% below the equity high. Notice that the drawdowns dipped to the 10% area several times over the last 15 years and double digit drawdowns do occur.
Since 2007, the strategy has a 10% Compound Annual Return (CAR) and a Maximum Drawdown (MDD) of 16%. The drawdown may seem tolerable, but many quantitative analysts say the biggest drawdown is in the future. Anything is possible. 55% of trades were winners and 45% were losers. The Average Gain from the winners was 20% and the average loss from the losers was 4.5%.
Past performance does not guarantee future performance!
Trading and investing involves risk and possible loss of money.
About the Rest of This Report
This report contains discretionary chart analysis based on my interpretation of the price charts. This is different from the fully systematic approach in the Trend Composite strategy series. In this ETF Trends, Patterns and Setups report, I am looking for leading uptrends and tradable setups within these uptrends. While I use indicators to help define the trend and identify oversold conditions within uptrends, the assessments are mostly based on price action and the price chart (higher highs, higher lows, patterns in play). Sometimes the chart assessment can be at odds with the indicators.
The Trend is Your Friend - Until it Bends
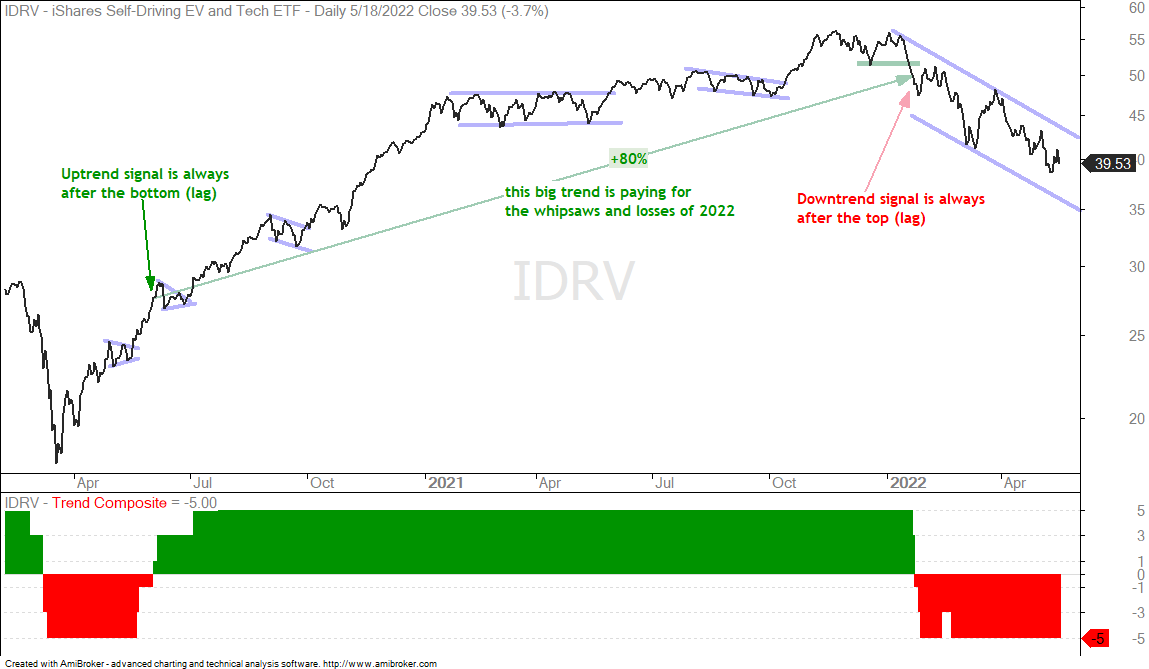
The Trend Composite is pretty typical for a trend-following indicator. There are whipsaws, loosing trades, short trends and a few big trends. It works great on some ETFs and stocks, and “less great” on others. The first chart shows the Self-Driving EV Tech ETF (IDRV) with a massive uptrend that lasted well over a year. There were also at least five bullish continuation patterns along the way for chartists. The trend did the bend in January 2022 as the Trend Composite turned negative and this bearish signal remains in play. These are some pretty clean signals as the trends extended.
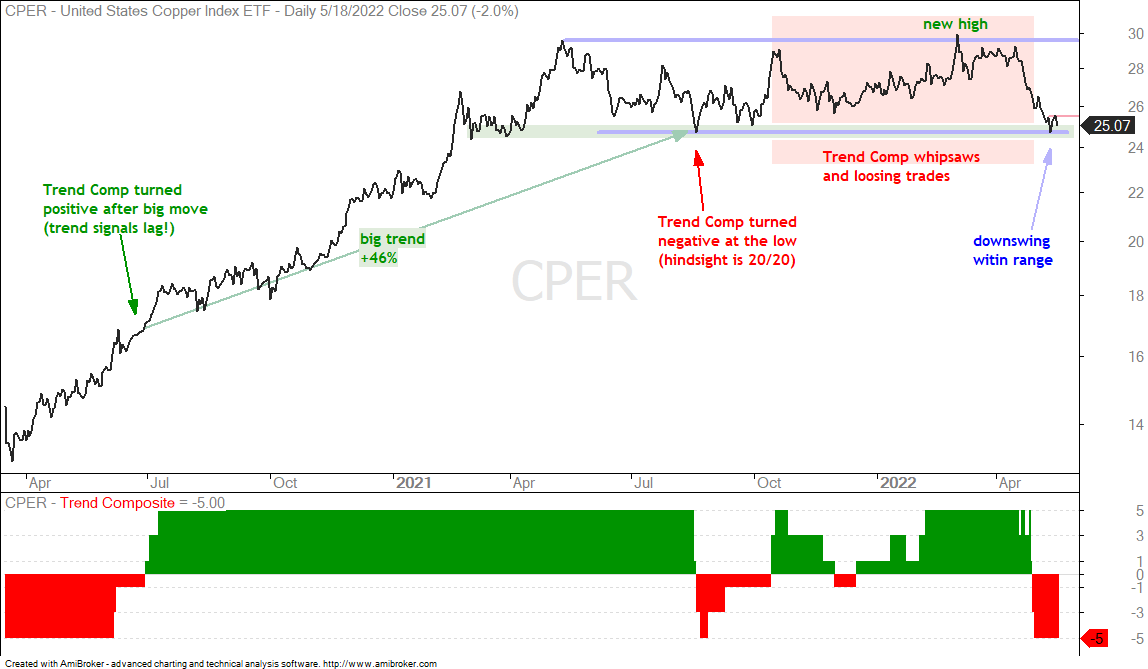
The Copper ETF (CPER) also participated in the big bull market with a big trend from summer 2020 to summer 2021 (+46%). The Trend Composite turned negative right at the mid August low (red arrow) and CPER went on to hit a new high in March 2022. There were, however, some whipsaws and loosing trades from the Trend Composite (red shading). This is because CPER stayed in a trading range and an strong uptrend failed to materialize. As the name implies, trend-following indicators work when big trends develop and don’t during trading ranges.
I highlighted CPER in Wednesday’s video because it was trading at range support. Note that this is subjective chart analysis. Trend Composite signals are systematic in nature because the indicator is either positive or negative. Subjectively, CPER is at support that extends back to spring 2021 (green shading). The swing within the trading range is down (April-May). CPER bounced and fell back to establish short-term resistance with Tuesday’s high. A breakout here would be short-term bullish and reverse the downswing within this range.
Consumer Staples Break Down
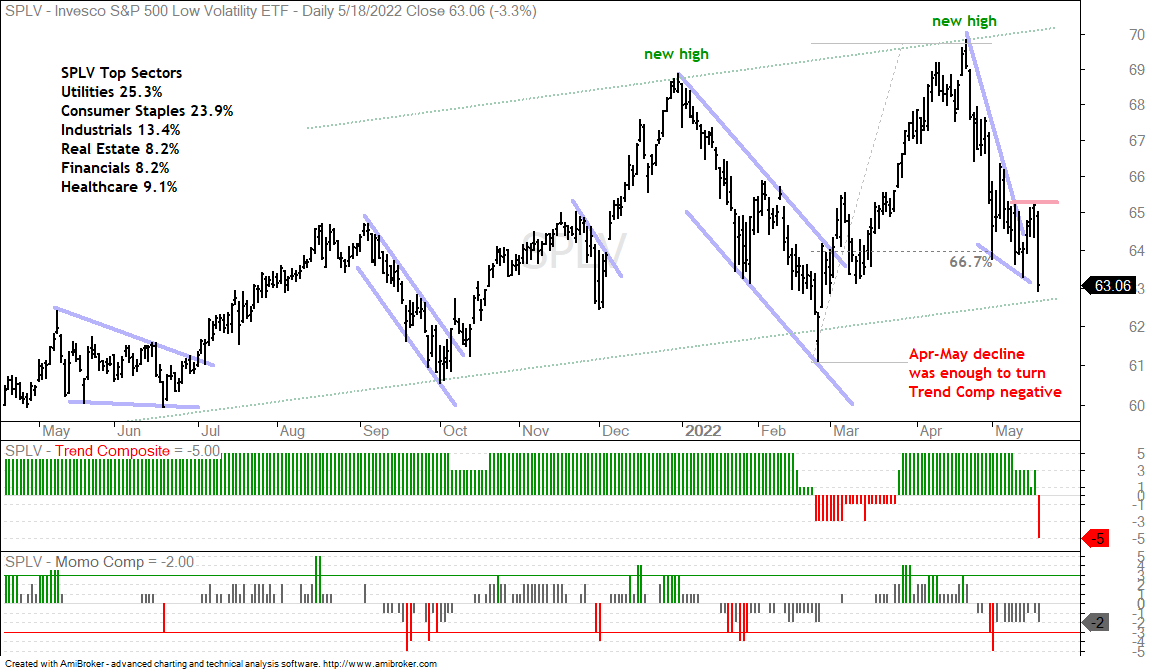
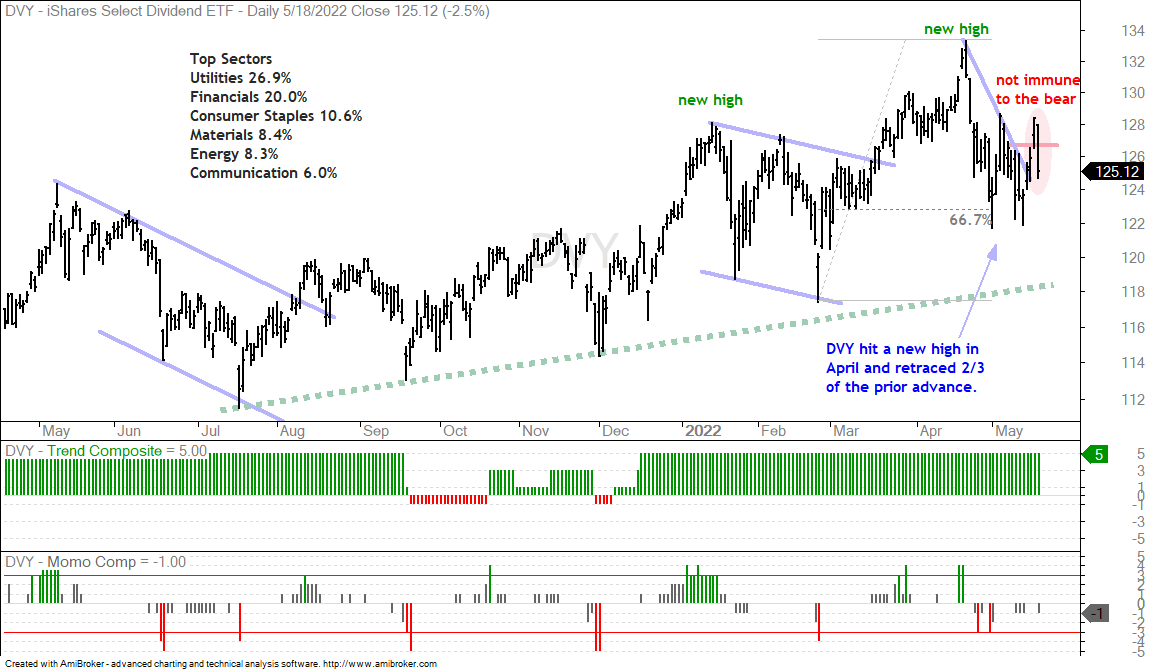
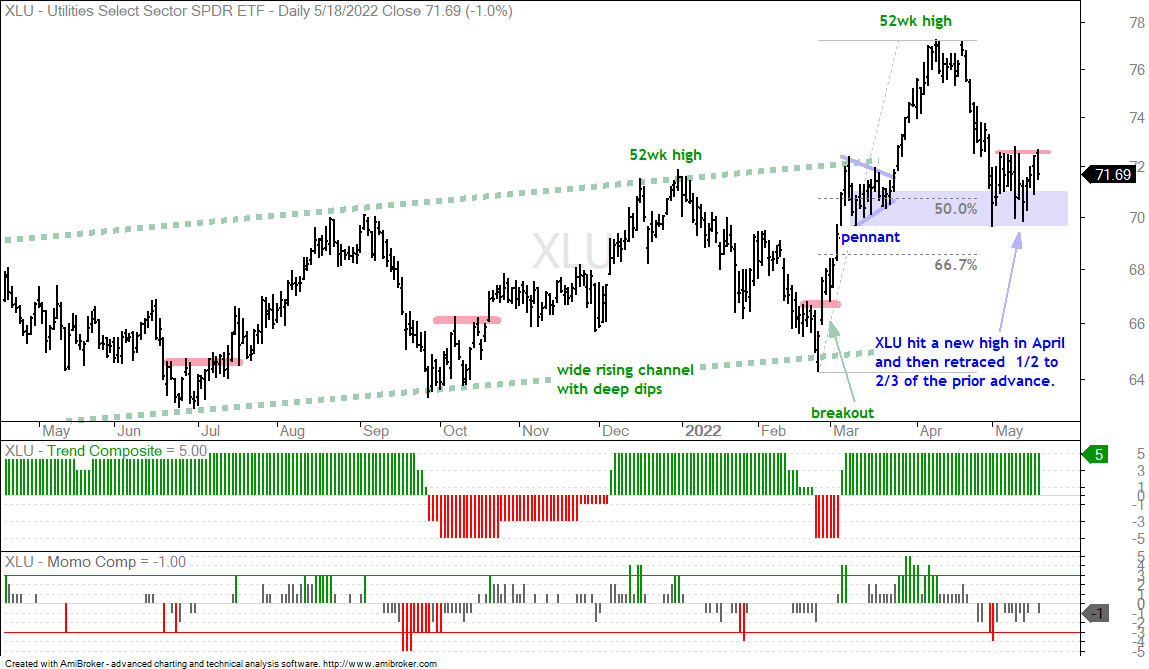
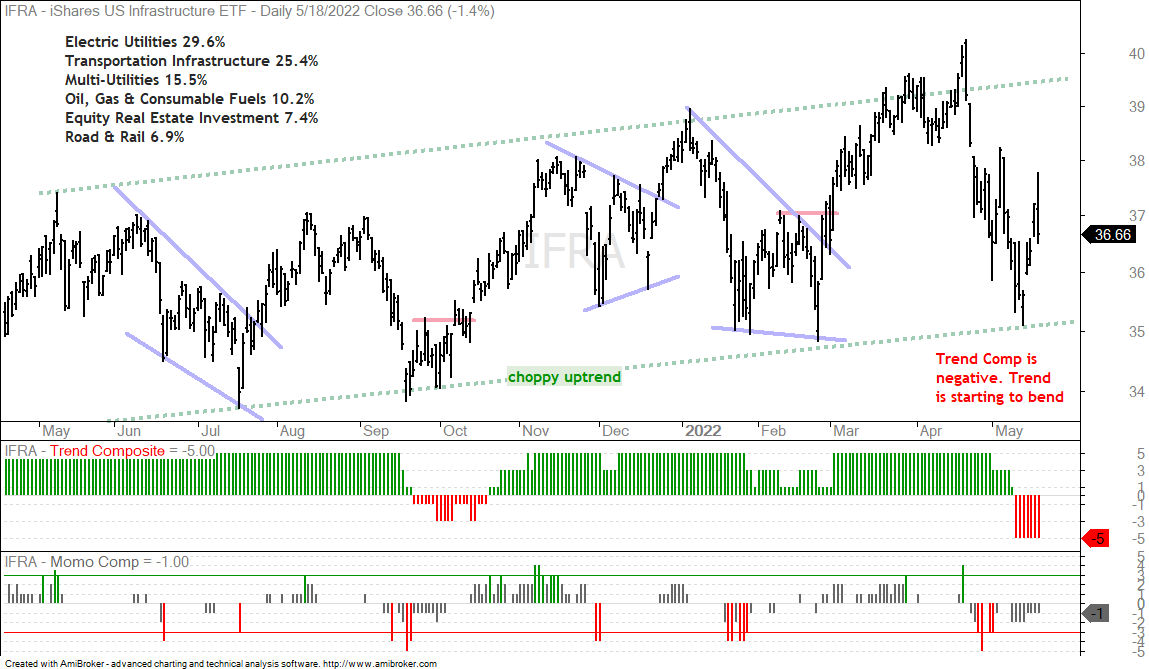
The safe-haven ETFs were holding up better than SPY and the other stock related ETFs. These included the Utilities SPDR (XLU), Consumer Staples SPDR (XLP), Food & Beverage ETF (PBJ), Select Dividend ETF (DVY), Infrastructure ETF (IFRA) and the S&P 500 Low Volatility ETF (SPLV). Consumer staples were hit HARD on Wednesday and ETFs with exposure to this sector were also hit. 10.6% of DVY components come from the Consumer Staples sector, while 23.9% of SPLV components are from this “safe-haven” sector. These two were also hit hard. Rising input prices and high inflation are likely having an effect here.
The first charts show the Consumer Staples SPDR (XLP) and the EW Consumer Staples ETF (RHS) falling over 6% and leading the market lower on Wednesday. XLP is top heavy with Procter & Gamble (15.75%), Coca-Cola (10.85%), Pepsi (10.24%) and Costco (9.23%) accounting for almost 50% of the ETF. I am showing the equal-weight version (RHS) to filter out the market-cap weighting and show how the “average” stock in the sector performed. As you can see from RHS, it was not just a few large-caps dragging down the sector.
The next chart shows SPLV firming near the 67% retracement line, but falling short of a breakout (above red resistance line). The ETF fell over 3% because of its large weighting in Consumer Staples. Even though there is still a wide rising price channel on the chart (green trendlines), this ETF is clearly not immune to the bear market and the Trend Composite turned negative.
The Select Dividend ETF (DVY) remains in an uptrend and is holding up better than the others, but it too was hit with strong selling pressure on Wednesday (-2.5%). The short-term breakout failed and it is unlikely that this ETF will buck the bear market. It may go down less though. Notice that Financials account for 20% (probably mostly REITs).
Utilities Still Holding Up as Infrastructure Bends
Outside of the Energy SPDR (XLE), the Utilities SPDR (XLU) is the last sector standing. XLU hit a new high in April, retraced a little over 50% with a decline to around 70 and firmed the last few weeks. A breakout was in the making, but XLU fell 1% on Wednesday. The bullish setup here is still active because the ETF is holding support from the May lows. However, it is still a stock-related ETF and still vulnerable in a bear market environment.
The Infrastructure ETF (IFRA) is heavily weighted toward utilities (electric 29.6% and multi 15.5%). There is also a heavy weighting in transport infrastructure, whatever that means. I can make the case for a choppy uptrend on the price chart (green trendlines), but the Trend Composite has been negative for over a week and this means the trend is at least bending. Utilities and Energy are keeping IFRA afloat, but the other groups are weighing.
Prior Reports
I talked about the “perfect storm” brewing in the Market Regime update on Wednesday (here). The following topics and ETFs were covered in Tuesday’s report (here) and Wednesday’s video (here):
When Oversold becomes a Sign of Weakness (SPY)
Bounce Targets for SPY and QQQ
Bounce Targets for Three Big Sectors (XLK, XLY, XLF)
Healthcare Holds Up Better than SPY (XLV)
Staples, Utilities and Defensive ETFs Leading (plus PBJ, SPLV)
Materials SPDR Remains Range Bound (XLB)
Aerospace & Defense ETFs Test Support Zones (ITA, PPA)
Agribusiness ETF Takes a Big Hit, but Holds Prior Lows (MOO) Metals & Mining SPDR Remains with a Normal Retracement (XME)
Oil Extends on Breakout as XLE Hits New High (WTIC, XES, FCG)
Agriculture ETFs Catch Fire (DBA, CANE, WEAT)
Metals ETFs Are Way Oversold (GLD, DBB, PALL, PLTM)
")