

Copper, All Things Electric and some Broad Market Thoughts (Premium)

Use CRTL+P to Print

I am always interested in themes that can drive secular trends. These include electronic payments, electric vehicles, clean energy, marijuana and such. These themes involve narratives and I am always careful with narratives. We all love a good story and stories help sell us on an idea. However, not all narratives turn out the way we expect and this is why we have price charts. A bullish narrative and bullish price chart make for a powerful combination. We should start to question the narrative when/if the price chart suggests otherwise.

You can learn more about my chart strategy in this article covering the different timeframes, chart settings, StochClose, RSI and StochRSI.

Copper Demand, Electricity and Sustainability

Jeff Currie of Goldman Sachs talks about copper as the single best conductor for electricity and the increase in demand via sustainable energy (wind turbines, electric vehicles, solar panels and energy storage). Thus, a play on copper is an indirect play on everything electric.

Copper ETF

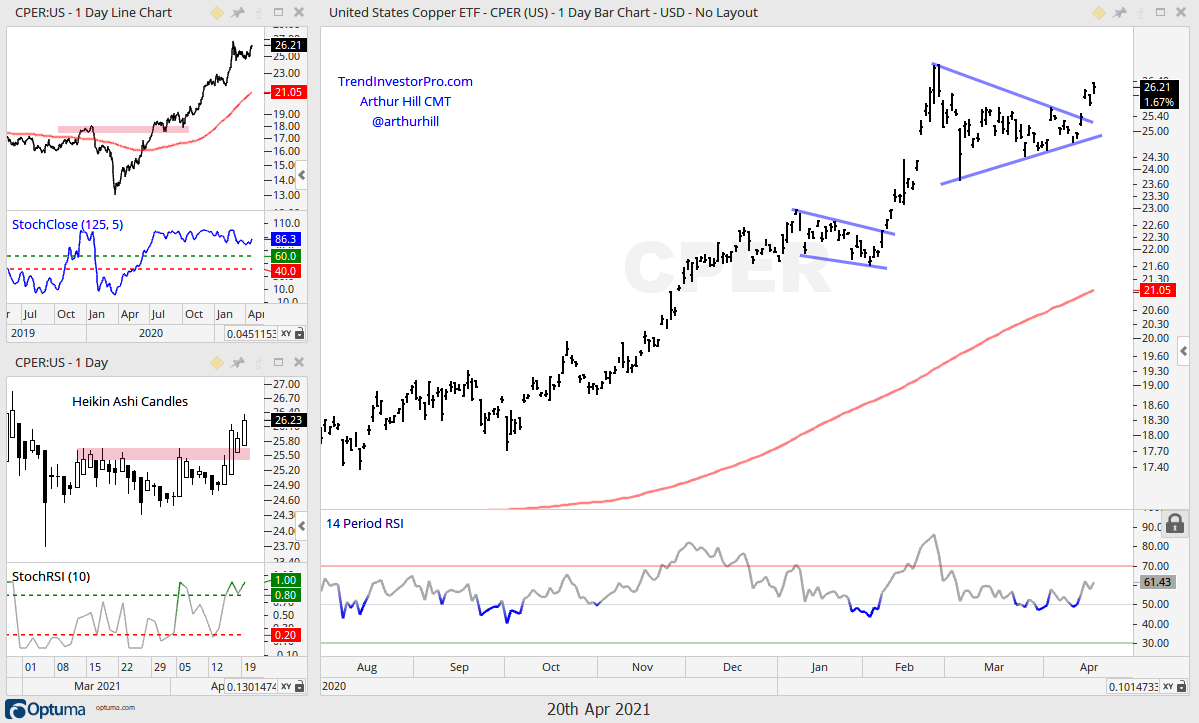
The chart below shows the Copper ETF (CPER) doubling from 13 to 26 in the upper left window. The ETF consolidated from early March to early April with a triangle and broke out of this triangle last Thursday. A triangle within an uptrend is a bullish continuation pattern or rest within the trend. The breakout signals a continuation of this trend and a new high is expected. The lower left window shows the Heikin-Ashi Candles with a resistance breakout.

Three Industrial Metals in One

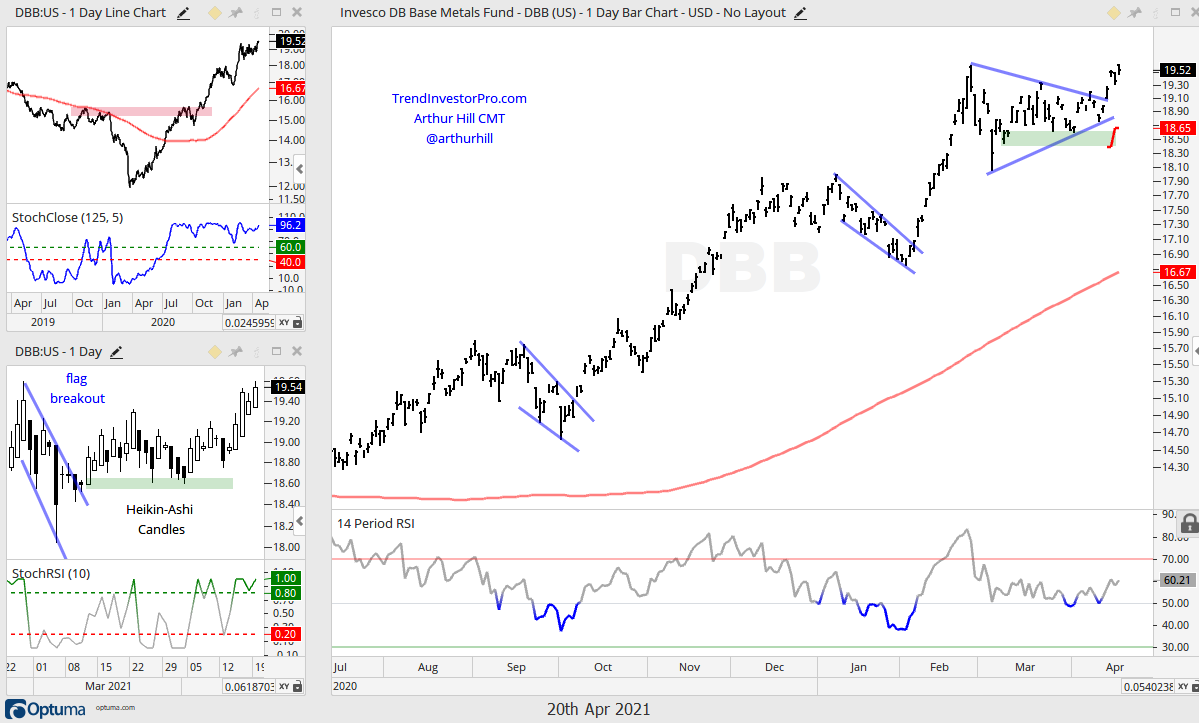
Copper is also part of the DB Base Metals ETF (DBB), which has been featured in the Thursday reports since the flag breakout in early March (lower left).  There is also a triangle breakout on the bar chart with a surge the last four days. The red line shows the ATR Trailing Stop (3 x ATR(22)) set just below the April lows on the breakout. This is for traders playing the triangle breakout. Investors playing the secular uptrend will likely need more wiggle room.

You can learn more about ATR Trailing stops in this post,
which includes a video and charting option for everyone.

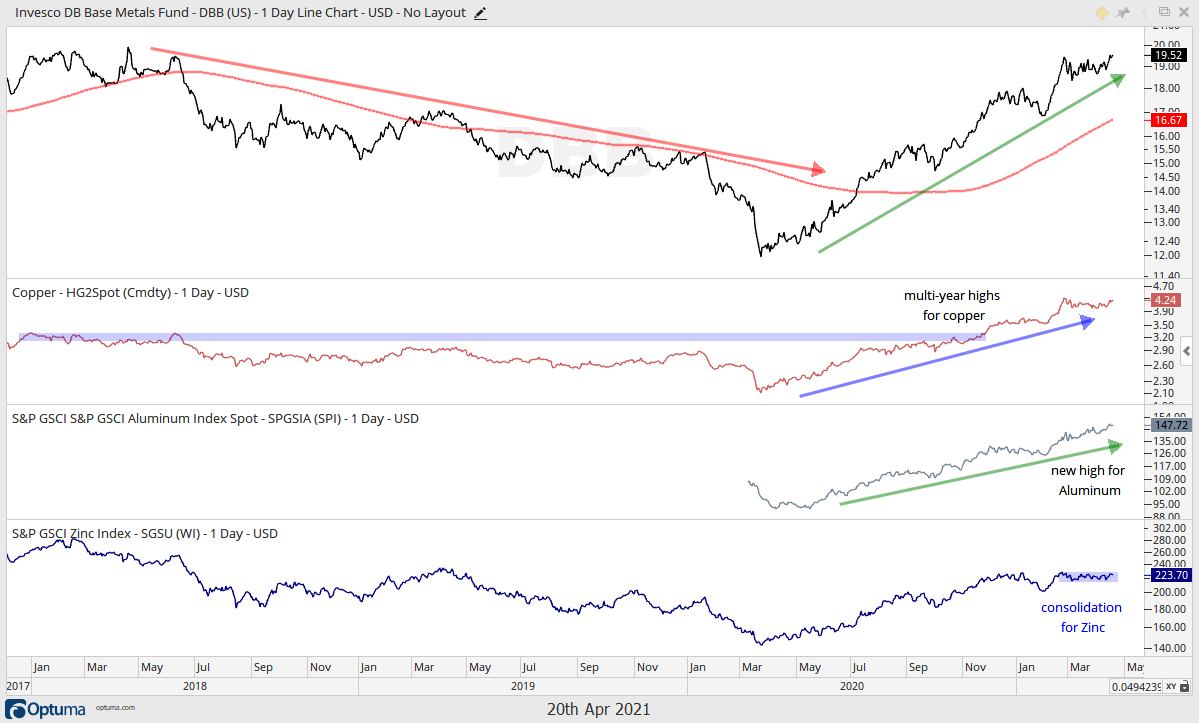
DBB is equal parts copper, aluminum and zinc. The next chart shows spot copper breaking out to multi-year highs in November, hitting a new high in February and consolidating into April. Aluminum has been rising since May and hit a 52-week high here in April. Zinc rose from March to January and then stalled the last few months. This is a bullish continuation pattern and a breakout would signal a continuation of the bigger uptrend.

The Second Year of a Bull Market

Next up we have a concise and informative video from Chris Verrone of Strategas. Here are the topics:

  • years one and two of new bull markets
  • current sentiment readings
  • why this is not 1999
  • leadership from housing
  • leading sectors
  • strength in DAX and CAC

Big 52 and 24 Week Runs for SPY

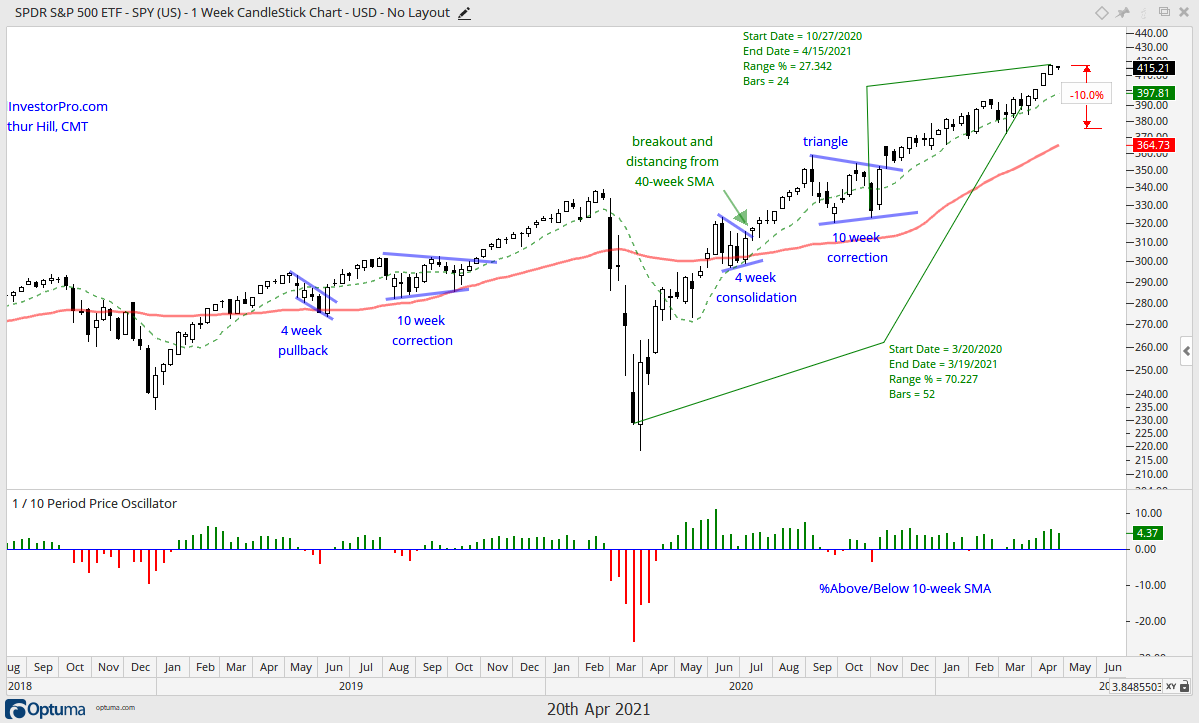
I especially like how Verrone uses the terms unique crisis and ordinary markets. Every crisis is unique, but the market reactions are not. Although, the 74% advance in the first year of this bull run, which is by far the highest on his table, seems extraordinary to me. The chart below shows weekly bars for SPY and a 70% advance from the March 2020 closing low to the March 19th close. SPY is also up 27% since late October (24 weeks) and the longest pullback lasted just two weeks. Talk about smoothing sailing!

Most recently, SPY left its 50-day SMA behind with a four week surge and is getting a little extended. Verrone’s research suggest that the second year of a bull market is a little rockier and the odds of a correction are high. A garden variety 10% correction from the recent high would push SPY below 380. This is not the call right now, but the odds of a decent correction increase as the bull matures and such a pullback would be an opportunity (as long as the Composite Breadth Model remains bullish).

Defensive Sectors Start to Lead

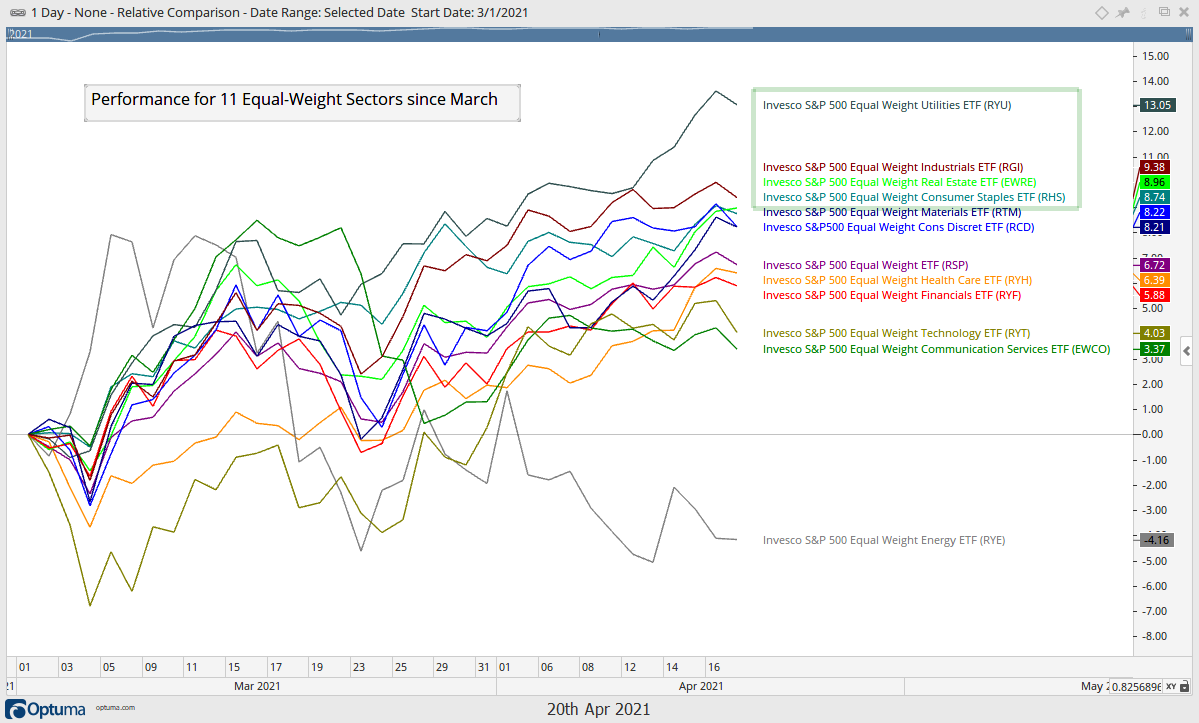
Verrone also notes that the defensive sectors are not leaders, but I would also take some issue with this assessment, with all due respect. The chart below shows that the EW Utilities ETF (RYU), EW REIT ETF (EWRE) and EW Consumer Staples ETF (RHS) are the top performing sectors since March. The EW Industrials ETF (RGI) is also performing well, but there is clearly more interest in the defensive sectors over the last month and a half.

Thanks for tuning in and have a great day!

Timing Models – Large-caps Extend Lead, Small-Caps Lag, Utes and REITs Lead, IWO hits Moment of truth (Premium)

Large-caps and large-cap techs ripped higher the last five-six weeks with SPY and QQQ hitting new highs. The Technology SPDR and Consumer Discretionary SPDR are leading the charge among the sectors with 13+ percent gains. Keep in mind that Amazon accounts for 23.5% of XLY and Tesla accounts for 14.45%. These two are not exactly pure plays in the

Timing Models – Large-caps Extend Lead, Small-Caps Lag, Utes and REITs Lead, IWO hits Moment of truth (Premium) Read More »

ETF Trends, Patterns and Setups – Metals and Ag ETFs Break Out, High-Flyers Languish, RSI Bullish Failure Swings (Premium)

There is plenty of strength within the stock market and also a few pockets of weakness, or lackluster performance. SPY and QQQ hit new highs this week. This shows broad strength within the S&P 500 and large-cap tech stocks. There were new highs in ETFs related to finance, tech, industrials, materials, healthcare, housing, steel, REITs, semiconductors

ETF Trends, Patterns and Setups – Metals and Ag ETFs Break Out, High-Flyers Languish, RSI Bullish Failure Swings (Premium) Read More »

Timing Models – SPY Hits New High as XLY and XLK Lead, IWM Consolidates, Yield Spreads Narrow Even Further (Premium)

The S&P 500 SPDR hit a new high to affirm the bull market and seven sector SPDRs joined the new high parade (XLK, XLY, XLC, XLI, XLB, XLRE, XLP). The Finance SPDR (XLF) and Healthcare SPDR (XLV) are within 2% of 52-week highs. Strength within the S&P 500 is broad and supportive of a bull market. Today’s report will show QQQ close to a new high and IWM struggling, but still bullish. Technology and Consumer Discretionary

Timing Models – SPY Hits New High as XLY and XLK Lead, IWM Consolidates, Yield Spreads Narrow Even Further (Premium) Read More »

ETF Trends, Patterns and Setups – Cyclical ETFs Lead with New Highs, Big Techs Perk Up, High-flyers Remain Subdued (Premium)

There are plenty of strong pockets in the stock market with several cyclically oriented ETFs hitting new highs and large-cap techs coming back to life. This month we are seeing new highs in ETFs related to industrials, materials, housing, semiconductors, transports and steel. We are also seeing some big moves in ETFs dominated by large-cap tech. The Consumer Discretionary SPDR hit a new high and I consider Amazon, its

ETF Trends, Patterns and Setups – Cyclical ETFs Lead with New Highs, Big Techs Perk Up, High-flyers Remain Subdued (Premium) Read More »

Timing Models – SPY Leads, QQQ Perks Up, SPX Leads Composite Breadth Model and Yield Spreads Narrow (Premium)

The S&P 500 SPDR hit a new high to affirm the bull market and three sectors confirmed this new high. The Consumer Staples SPDR, Materials SPDR and Industrials SPDR recorded new highs at some point this week. Even though the other big sectors did not hit new highs this week, they are in uptrends and within three percent of new highs. These include the Technology SPDR

Timing Models – SPY Leads, QQQ Perks Up, SPX Leads Composite Breadth Model and Yield Spreads Narrow (Premium) Read More »

ETF Trends, Patterns and Setups – Mixed Market with Strength in Cyclicals and Non-Cyclicals, Large Cap Techs Perk Up (Premium)

The market continues to be mixed and bullish. Techs and high-flying ETFs led the correction from the February highs to the March lows, but we are now seeing signs of short-term leadership in large-cap techs, namely QQQ and XLK. These two held well above their early March lows and broke out of flag patterns. Other tech-related ETFs and high-flyers are

ETF Trends, Patterns and Setups – Mixed Market with Strength in Cyclicals and Non-Cyclicals, Large Cap Techs Perk Up (Premium) Read More »

Putting Declines into Perspective with the ARK ETFs – CARZ Forms Bullish Continuation Pattern (Premium)

Today’s commentary will focus on three ARK ETFs. Overall, there are eight ARK ETFs that capture cutting-edge technology or innovation in several areas. Six of the eight have been trading for more than three years. The ARK Fintech Innovation ETF (ARKF) started trading in February 2019 and the ARK Space Exploration ETF

Putting Declines into Perspective with the ARK ETFs – CARZ Forms Bullish Continuation Pattern (Premium) Read More »

Timing Models – IWM Joins the Correction Fray, QQQ Firms, Two Bullish Seasonal Patterns

The market regime remains bullish, but we are seeing corrective price action over the last few months. The Nasdaq 100 ETF started it all off with a sharp decline from mid February to early March. IWM got involved this week with its biggest fourth decline greater than 9% since March 2020. SPY has largely avoided the correction fray and remains the strongest of the big three.

Timing Models – IWM Joins the Correction Fray, QQQ Firms, Two Bullish Seasonal Patterns Read More »

ETF Trends, Patterns and Setups – Flag Failures, Risk Aversion, Defensive Sectors Shine, Big Advances lead to Big Corrections(Premium)

The market remains defensive overall. There were flag breakouts in a number of tech and growth ETFs last week and these breakouts are failing this week. Once again, the tech and growth ETFs are leading the way lower. Even though these ETFs are down sharply over the last six weeks, the declines still look like corrections within bigger uptrends. The mid March highs provide the first resistance levels to watch going forward.

ETF Trends, Patterns and Setups – Flag Failures, Risk Aversion, Defensive Sectors Shine, Big Advances lead to Big Corrections(Premium) Read More »

Growth ETFs, Heikin-Ashi and Asian ETFs Setting Up – IHI, FXI, ASHR, KWEB, CQQQ, EWY, EWJ, EWZ (Premium)

This commentary was originally posted on Wednesday, March 17th, in PDF format. Today I am replacing the PDF with chart images on a web page. Some of the text has been adjusted, but the commentary/charts are largely the same as on Wednesday. These charts cover the massive moves in tech-growth ETFs over the past year, the interest rate debate, Chinese ETFs firming in reversal zones and the Brazil ETFs surging off the 200-day.

Growth ETFs, Heikin-Ashi and Asian ETFs Setting Up – IHI, FXI, ASHR, KWEB, CQQQ, EWY, EWJ, EWZ (Premium) Read More »

Timing Models – Triple Shock Thursday, the Secular Downtrend in Oil, Tech Sector Continues to Lag (Premium)

We finally got a bit of a shake up this week as oil fell sharply on Thursday. We also saw big declines in the Nasdaq 100 ETF and Russell 2000 ETF. It was basically triple shock Thursday with small-caps, large-techs and oil getting hit hard. Tech and growth related ETFs were also hit hard as money moved out of the high-beta end of the market.

Timing Models – Triple Shock Thursday, the Secular Downtrend in Oil, Tech Sector Continues to Lag (Premium) Read More »

ETF Trends, Patterns and Setups – Flags and Flag Breakouts Dominate the Landscape (Premium)

There are lots of flag breakouts here in March. Some triggered in early March, some last week, some this week and some are still working, which means price is still near the breakout zone. There were short flag/pennants that lasted a week or so (KRE), shallow flags (IJR), falling flags that lasted three weeks (SPY) and sharper falling flags that lasted four weeks (QQQ, IBB).

ETF Trends, Patterns and Setups – Flags and Flag Breakouts Dominate the Landscape (Premium) Read More »

Timing Models – Going for Short-term Breakouts, Split Market with Enough Strength, Composite Breadth Model (Premium)

SPY and IWM recorded new highs this week and continue to lead the broader market. Even though QQQ and XLK are underperforming this year, the old school sectors held strong and propped up SPY. After short pullbacks into early March, stocks caught a bid this week and we are seeing flag breakouts in

Timing Models – Going for Short-term Breakouts, Split Market with Enough Strength, Composite Breadth Model (Premium) Read More »

ETF Trends, Patterns and Setups – Energy, Banks and Industrials Lead, Tech ETFs Try to Find Footing after Normal Retracements (Premium)

There are a lot of pullbacks to deal with today. Some pullbacks are shallow, some are deep and some are in between. Often, the bigger the advance, the deeper the pullback or retracement. Despite some big percentage declines, most of the pullbacks are normal in retracement terms (33 to

ETF Trends, Patterns and Setups – Energy, Banks and Industrials Lead, Tech ETFs Try to Find Footing after Normal Retracements (Premium) Read More »

Timing Models – QQQ Leads Short-term Pullback, but Long-term Evidence Remains Bullish (Premium)

The long-term evidence remains bullish, but the major index ETFs have moved into corrective mode of varying degrees. The S&P 500 SPDR and Russell 2000 ETF are in the midst of shallow pullbacks, while the Nasdaq 100 ETF is leading the way lower with a sharp pullback. Downside participation was so strong in the Nasdaq 100 that the Breadth Thrust

Timing Models – QQQ Leads Short-term Pullback, but Long-term Evidence Remains Bullish (Premium) Read More »

ETF Trends, Patterns and Setups – Finance, Industrials and Energy Hold up as Tech, Healthcare and High-Flyers Correct (Premium)

Even though ETFs related to small-caps, mid-caps, industrials, finance and energy are performing well and not part of the correction process, a big portion of the core ETF list are in some sort of pullback or correction over the last few weeks. 48 of the 119 ETFs in the core list are down over the last 22 trading days (since January 29th) and 22 are down more than 5%.

ETF Trends, Patterns and Setups – Finance, Industrials and Energy Hold up as Tech, Healthcare and High-Flyers Correct (Premium) Read More »

Timing Models – QQQ Reverses Short-term Uptrend, 3 Big Sectors Weigh, Medium-term Participation Wanes within SPX (Premium)

The long-term evidence (primary trend) is bullish, but we are seeing some short-term weakness (secondary trend). This is especially true in the Nasdaq 100 and Technology sector. SPY is holding up better because the Finance, Industrials and Communication Services are picking up the slack. The table below summarizes the broad market environment using the

Timing Models – QQQ Reverses Short-term Uptrend, 3 Big Sectors Weigh, Medium-term Participation Wanes within SPX (Premium) Read More »

ETF Trends, Patterns and Setups – Cyclical ETFs Lead, Tech ETFs Pullback, High-Flyers Correct Hard (Premium)

February is turning into a big month for cyclically oriented ETFs. These include: Copper Miners ETF, Metals & Mining SPDR, DB Base Metals ETF, Oil & Gas Equipment & Services ETF, Oil & Gas Exploration & Production ETF, Airline ETF, Transports ETF, Industrials SPDR, Regional Bank ETF, S&P SmallCap 600 SPDR, S&P MidCap 400 SPDR and Semiconductor ETF. The lists below shows ETFs with big gains over the last 17 trading days (February).

ETF Trends, Patterns and Setups – Cyclical ETFs Lead, Tech ETFs Pullback, High-Flyers Correct Hard (Premium) Read More »

Timing Models – Commodities Lead in 2021, SPY Extends Uptrend, Extended Conditions Extend, Fed Balance Sheet Pops (Premium)

Stocks and commodities are leading in 2021 (risk on). Small-caps took a breather this week, but the Russell 2000 ETF (IWM) is still the second best performer among 14 intermarket ETFs. The DB Energy ETF (DBE) is the top performer with an 18.9% gain and the DB Base Metals ETF (DBB) gets third place with a 7.5% gain. QQQ is holding its own with a 6% gain and the

Timing Models – Commodities Lead in 2021, SPY Extends Uptrend, Extended Conditions Extend, Fed Balance Sheet Pops (Premium) Read More »

Scroll to Top