There is plenty of strength within the stock market and also a few pockets of weakness, or lackluster performance. SPY and QQQ hit new highs this week. This shows broad strength within the S&P 500 and large-cap tech stocks. There were new highs in ETFs related to finance, tech, industrials, materials, healthcare, housing, steel, REITs, semiconductors and defense. There is a lot of old school strength out there.
Some of the prior high-flyers are continuing to lag. A few large-cap tech related ETFs joined the April surge with breaks above their mid March highs (IGV, FDN, SKYY). However, small-cap tech and small-cap high beta remain below their mid March highs. This group includes the Nasdaq 100 Next Gen ETF (QQQJ), the Russell 2000 Growth ETF (IWO), the clean energy ETFs and the ARK ETFs. Watch for breakouts in these to signal a return of the risk appetite.
Relative weakness in these higher beta names shows less risk appetite in the stock market. I would not call this bearish because other areas of the market are picking up the slack. Relative weakness in these names just shows more selectivity. Investors and traders are getting more choosy.
You can learn more about my chart strategy in this article covering the different timeframes, chart settings, StochClose, RSI and StochRSI.
Steady Uptrend, New High, Leading, Extended
SPY, XLC, SLX
The S&P 500 SPDR sets the stage for the broader market and this large-cap driven benchmark hit a new high this week. There is no denying the overall trend, which has been up, up and away since the early November breakout. SPY is up over 25% since late October and up around 10% since early March. These are some big moves. SPY is both medium-term and short-term extended. In an interesting twist, RSI exceeded 70 for the first time since late August early September.
Overbought and overextended conditions are like valuations and sentiment: they do not matter until they matter. In other words, price can become overbought and remain overbought. Sentiment can become excessively bullish and the market can still move higher. Overbought conditions are not bearish. They just suggest that the odds of a consolidation or corrective period are above average. This is the time to consider profit targets or perhaps tightening trailing stops.
The red line (middle) shows the ATR Trailing Stop, which is 2 ATR(22) values below the highest close since the March 10th breakout. The current value (403.8) is around 1.5% below the last close (411.45). Like much of technical analysis and discretionary trading, setting stops is a bit art and a bit science. The ATR Trailing Stop provides the science, which is an objective manner to manage a trade. The art is in the settings. The gray line is 1 ATR(22) value below the highest close and the black line is 3 ATR(22) values below the highest close. Personally, I like to tighten a stop when price becomes extended to lock in gains.
You can learn more about ATR Trailing stops in this post, which includes a video and charting option for everyone.
Mid February Breakout, Follow Thru, New High
XLI
The Industrials SPDR (XLI) continues to work its way higher since the mid February breakout and there are no new setups. The ETF hit a new high this week and is part of the leaderboard. The red line shows the ATR Trailing Stop (2 x ATR(22)) and the black line shows a slightly wider stop (3 x ATR(22)).
Early-Mid March Breakout, Follow Thru, New High
ITB, XLB, XLP, PBJ, XLV, IHF
ETFs in this group also broke out of consolidations, but their breakouts were a little later than the breakout in XLI. The first chart shows the Healthcare SPDR (XLV) with a falling channel that retraced 50% and a breakout in mid March. XLV followed through on the breakout and hit a new high this week. The candlestick chart shows flag and pennant breakouts along the way. The Healthcare Providers ETF (IHF) and Medical Devices ETF (IHI) are also strong and helping the sector, while IBB continues to battle support and attempt a reversal.
The Home Construction ETF (ITB) also broke out at the beginning of March and is up over 20% from its early March low. ITB is also getting extended, but continues to hold its ATR Trailing Stops. The grey line is 1 ATR(22) value below the highest close and the red line is 2 ATR(22) values below.
The Materials SPDR (XLB) broke out of a triangle in early March, fell back to the breakout zone with a throwback and bounced to new highs here in April. This pullback to the breakout zone is known as a throwback. Broken resistance turns support and a throwback to the breakout offers a second chance to partake. RSI was also mildly oversold on the throwback. XLB is also in the trend-monitoring phase. Note that XLB is dominated by the big chemical stocks (69%) and is more of an industry group than a sector.
Correction, mid March Breakout, Surge to New Highs
QQQ, XLK, XLY, SOXX
QQQ is leading the advance off the early March lows with a 13% gain (based on Tuesday’s close). There are no setups on this chart right now and we are in the trend-monitoring phase. This is the time to manage the position, plan your trade and trade your plan. QQQ is also quite extended and ripe for a rest. A bearish engulfing pattern formed on the candlestick chart (lower left). Short-term bearish patterns in uptrends are considered noise, not setups or signals. I am only interested in short-term bullish patterns, setups and signals when the bigger trend is up. Learning what to ignore is a big part of the process. And believe me, there is a lot of noise out there that should be ignored. This chart also shows two versions of the ATR Trailing Stop (red is 2 ATR(22) values below the highest close since the breakout and gray is 1 ATR(22) value below.
The Semiconductor ETF (SOXX) surged to a new high on April 5th and then edged lower the last seven days. On the candlestick chart, this pattern looks like a high and tight flag, which is a short-term bullish continuation pattern. A breakout at 450 would end the flag and signal a continuation higher. This is a very short-term pattern.
You can learn more the StochClose indicator and strategies in this post.
Late March Breakout, Strong Follow Thru
IHI
The Medical Devices ETF (IHI) broke out in late March, which was a little later than the group above, but made up for the late breakout with a strong surge. Again, there is nothing to do here because IHI is in the trend-monitoring phase. IHI is also getting a bit extended and ripe for a rest.
Early April Breakout, New High
PHO
The Water Resources ETF (PHO) hit a new high in mid January and then formed an Ascending Triangle into early April. This was always viewed a bullish continuation pattern because it was a consolidation within a bigger uptrend. The breakout signals an end to the consolidation and a resumption of the bigger uptrend. The breakout zone turns first support to watch should we see a throwback.
Several banks reported earnings this week and the results have been quite positive. This information is known and already baked into the price. Nevertheless, the Finance SPDR (XLF) recorded a new high this week and remains in a strong uptrend, and a leader. Note, however, that traditional banks account for 39% of XLF and Berkshire (BRK.A) is the largest holding (13%). Thus, XLF is not a pure play on banks. The chart below shows XLF with a dip in mid March and then a push to new highs here in April. There is no setup here. Just a strong and steady uptrend.
The next charts show the Bank SPDR (KBE) and Regional Bank ETF (KRE), which are dominated by traditional banks. They are not as strong as XLF, but in clear uptrends and trying to bounce after sharp pullbacks from their mid March highs. The bar charts show bounces after retracing 50% of the February-March advance. The blue arrows show RSI bouncing from the oversold zone. Thus, the pullbacks look normal and the bigger uptrends could be resuming.
The candlestick charts (lower left) show bullish engulfing patterns in late March and tepid follow through the last few weeks. This tepid follow through is a concern, but not yet a negative. The green zones mark support and a break below last week’s lows would be negative. Even though this would not be enough to reverse the long-term uptrends, it would suggest that further correction is needed to fully digest the massive gains from late September to mid March (> 100%).
Lagging since mid February, Short-term Moment of truth
IJR, IWM
The next chart shows the Russell 2000 ETF (IWM) consolidating after a 60% advance. A consolidation is normal after such a big move. The consolidation lows mark a “support” level, but I do not think a support break would be bearish. Why? Because the bigger trend would still be up. Instead, a support break would likely pave the way for the next bullish setup (pullback within an uptrend).
The candlestick chart shows a bounce, pennant and breakout. Despite closing off the highs on Wednesday, the breakout is still there and still short-term bullish. The lows in the 219-220 area mark the first level to watch for a failure. IWM is still underperforming since mid February so we should be careful here. A break below the pennant lows (close below 219) would be negative and could lead to a test of the March lows, of even a break below these lows.
Modest Correction, Early-Mid April Breakout
$COPPER, COPX, DBB, DBA
The next chart shows Spot Copper ($COPPER), the Copper Miners ETF (COPX), the DB Base Metals ETF (DBB) and the DB Agriculture ETF (DBA). The first three are clearly related and DBA is part of the commodity group. DBB is equal parts (one third) copper, aluminum and zinc. First, copper and DBB are breaking out of triangle patterns and in the midst of Bollinger Band squeezes. Second, COPX and DBA corrected with falling wedge/channel patterns and broke out in early April. The red lines show the ATR Trailing Stops for reference.
Consolidation, Mid April Triangle Breakout
IPAY, CARZ
The Mobile Payments ETF (IPAY) reversed its downswing within a bigger triangle two weeks ago and broke above the triangle trendline last Friday. The triangle represents a consolidation within a bigger uptrend and the breakout signals a continuation higher. Even though this is clearly a bullish setup, one may need to give the ETF some wiggle room. In other words, IPAY could dip back into the pattern and still be within a bigger uptrend.
Deep Correction, Broke mid March High, Short-term Extended
IGV, FDN, SKYY, CLOU CIBR, HERO, FAN
Now we get to ETFs that experienced sharp corrections from mid February to early March. The mid March highs are “benchmark” highs that we can use to compare performance. ETFs that exceeded their mid March highs are leading, while ETFs that did not are lagging. ETFs in this first group are leading on the rebound because they broke above their mid March highs. They are, however, still short of 52-week highs and lagging ETFs that hit new highs this month.
IGV, FDN, SKYY, CIBR and HERO are up between six and ten percent the last two weeks (10-day ROC). IGV is the leader of this group with the largest gain. The breakout is bullish, but the ETF is getting a bit extended short-term. The breakout zone around 350-354 turns first support to watch should we get a throwback.
The next chart shows the Video Game eSports ETF (HERO) with a flag like breakout on March 31st and a move above the mid March highs. The breakout zone around 32 turns first support to watch should we get a small throwback.
Deep Correction, Bounce, Below mid March High
HACK, QQQJ
The two ETFs in this next group (HACK, QQQJ) bounced over the last two weeks, but did not exceed their mid March highs. The next chart shows the Nasdaq 100 Next Gen ETF (QQQJ), which consists of the next largest 100 stocks in the Nasdaq (101 to 200). The ETF surged some 40% and then retraced around half of this advance with a decline to 30. A triangle unfolded and this is considered a bullish continuation pattern. It is a rest to digest the prior gains. The pause that refreshes. QQQJ broke out of the triangle on Tuesday and then fell back on Wednesday. A look at the candlestick chart shows a bull flag and breakout attempt. Despite a bearish engulfing on Wednesday, the odds still favor a breakout. I will watch the flag lows for the first clues of a failure (close below 32.2).
Deep Correction, Weak Bounce, Well below mid March High
ICLN, PBW, TAN
The three clean-energy ETFs in this group experienced some of the weakest bounces in early April. In fact, all three are actually negative over the last ten days and underperforming. The chart below shows PBW falling some 35% and then consolidating with a triangle. A triangle after a sharp decline is a bearish continuation pattern and a break would signal further weakness. I would not short PBW simply because we are in a bull market and the ETF is still above the rising 200-day. Nevertheless, it is one of the weakest stock-related ETFs in my universe right now. Also notice that RSI has not been above 50 since mid February. To reverse this decline, PBW needs to break above the early April high and RSI needs to break 50.
All ARKs in the Same Boat
ARKK, ARKQ, ARKW, ARKG, ARKF, ARKX, PRNT, IZRL
Brian Shannon CMT of AlphaTrends.net and @alphatrends is a great follow on twitter. Yesterday he tweeted:
I see a lot of people trying to pick up many of the prior leaders. As a general rule, the odds are against your longs when the 20 & 50 Day SMAs are declining
Someone added further in the tweet that “every new bull run brings new leaders”.
The basic idea is not to fight the last war because things change. As with pretty much everything in technical analysis, there are some truths here, some contradictions and some gray areas. We need an open mind and cannot expect the groups that led the first leg to lead the next leg. In general, the lockdown trade led the market from April to August and the reopening trade led from November to March. We are now seeing some of the large-cap tech groups revive with QQQ, XLK and SOXX hitting new highs. Thus, old leaders are again the new leaders. However, we are still seeing relative weakness and lackluster price action from some of the prior high flyers.
All ARK ETFs remain below their mid March highs and continue to languish. I still think they are in uptrends because they are above their rising 200-day SMAs. I also think that big advances deserve proportionate corrections and corrections are “normal” as long as they retrace one half to two thirds of the prior advance. The chart below shows the ARK Autonomous Tech Robotics ETF (ARKQ) retracing around half of the Sept-Feb advance and then trading sideways. The ETF surged in late March and early April, and then consolidated with a pennant (see candlestick chart). A pennant breakout is in the making and the pennant lows mark first support to watch for a failure.
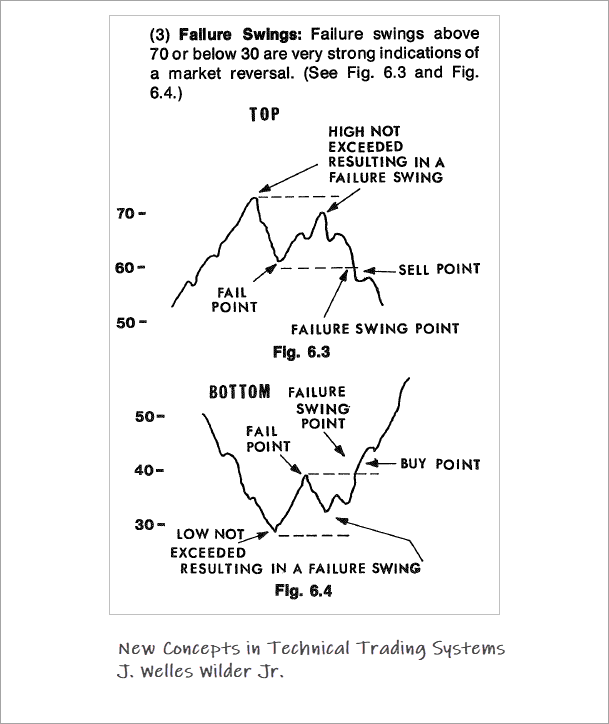
RSI Bullish Failure Swing
IBB, GLD
The Biotech ETF (IBB) and Gold SPDR (GLD) do not often get a spot together, but I am putting them here because they have RSI bullish failure swings working. The image below comes from Wilder’s book, New Concepts in Technical Trading Systems. A bullish failure swing in RSI forms with a low below 30, a bounce, a pullback that holds above 30 and a subsequent move above the intermittent high (buy point).
I have not tested this pattern and do not know its reliability. The higher low and breakout in RSI signal a change in momentum (from bearish to bullish). The idea is that this change will foreshadow a breakout on the price chart. The first chart shows GLD with a confirmed bullish failure swing because RSI broke above the intermittent high. The second chart shows IBB with a bullish failure swing working and a break above the mid March high (in RSI) would be bullish.
Correction Extending
MJ, YOLO
The Alternative Harvest ETF (MJ) and Pure Cannabis ETF (YOLO) both fell further the last eight days and continue to lag. The chart below shows MJ with a spike (red zone) and further weakness since this spike. The overall trend is up and I still consider the decline since mid February as a correction within that uptrend. Estimating retracement zones is difficult because of the spike and I elected to ignore it. Most of my focus is on the bounce in early March and the pullback since mid March, which is shown in the candlestick chart. A falling wedge retraced 2/3 of this advance and a break above early April high would reverse this decline.
")