The S&P 500 SPDR hit a new high to affirm the bull market and seven sector SPDRs joined the new high parade (XLK, XLY, XLC, XLI, XLB, XLRE, XLP). The Finance SPDR (XLF) and Healthcare SPDR (XLV) are within 2% of 52-week highs. Strength within the S&P 500 is broad and supportive of a bull market. Today’s report will show QQQ close to a new high and IWM struggling, but still bullish. Technology and Consumer Discretionary are leading the sector SPDRs (again), while Software, Semis and Housing are leading the industry group ETFs.
Report Summary
SPY: long-term uptrend and short-term uptrend (leading).
QQQ: long-term uptrend and short-term uptrend.
IWM: long-term uptrend and short-term uptrend (lagging).
S&P 500: 5-day SMA crossed above 200-day on May 29th (uptrend).
Composite Breadth Model: bullish since May 29th (bull market).
XLK and XLY Retake the Lead
Leading and Lagging Industry Group ETFs since March 8th
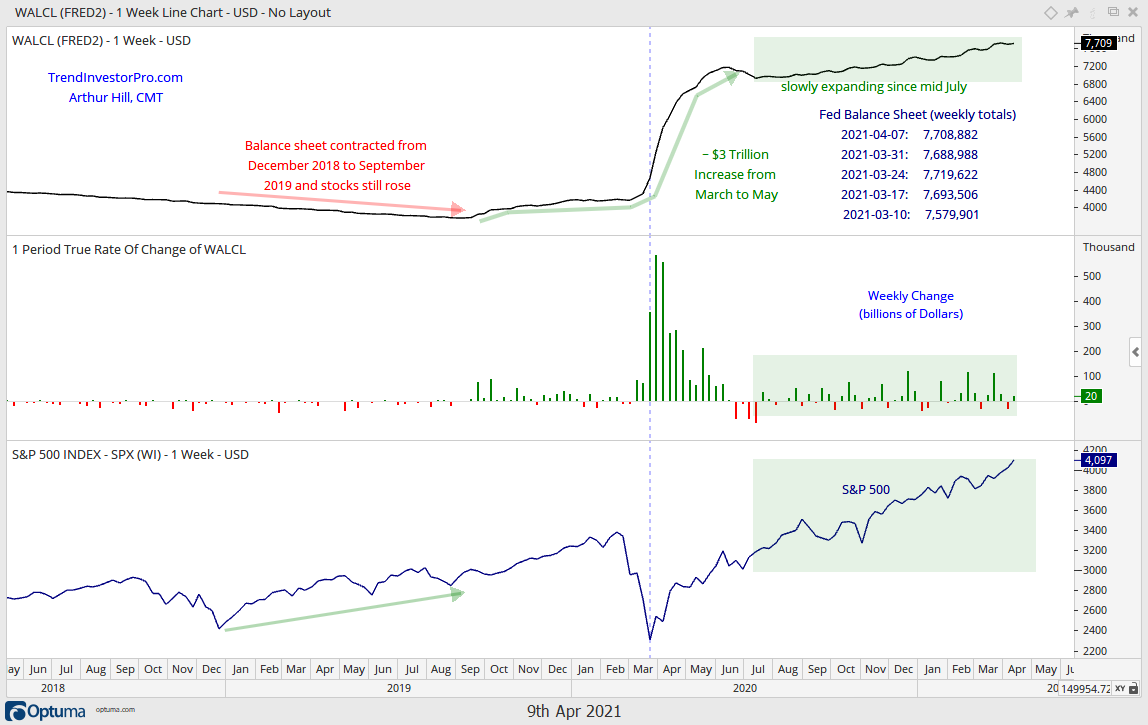
The Fed Balance sheet expanded by a small amount this week.
Yield spreads narrowed to multi-year lows again this week.
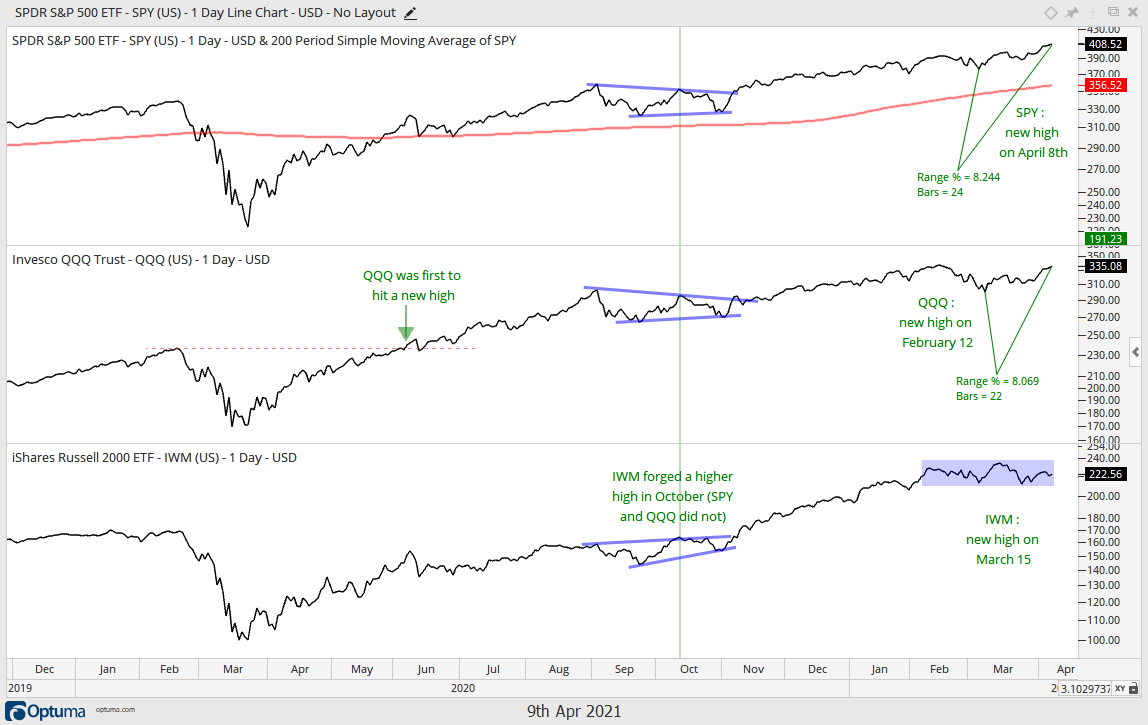
Another New High in SPY
The S&P 500 SPDR (SPY) hit another new high this week, and that’s about all we need to know. New highs occur in uptrends, new highs show continuing strength and new highs show leadership. SPY is getting extended short-term because it is up 8.24% in 24 days. That is a big annualized move. QQQ recorded a new high on February 12th and is very close to this high after an 8% gain in 22 days. Note that QQQ bottomed two days after SPY. Even though IWM is struggling over the last two months, it remains in an uptrend overall and the sideways price action (blue shading) is viewed as a consolidation within the bigger uptrend.
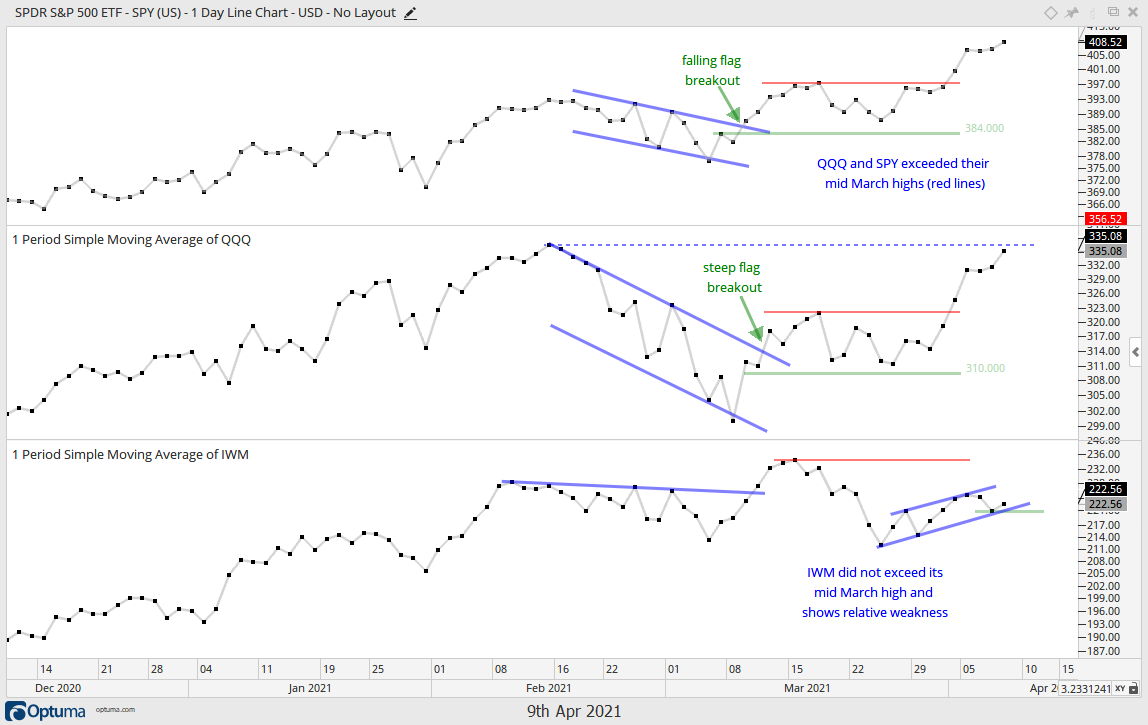
QQQ Close to New High
Short-term, the flag breakouts from March 9-11 remain in play for SPY and QQQ. SPY is leading because it recorded new highs in mid March and again here in April. The red lines mark the mid March highs, which are benchmark highs used to compare performance. SPY and QQQ exceeded these highs, but IWM did not and small-caps show relative weakness. I do not consider this bearish. It just means SPY and QQQ are the leaders and they deserve more attention. The blue dashed line shows the mid March high for QQQ and the ETF is within spitting distance of this high.
Composite Breadth Model: Bull Market
The Composite Breadth Model defines the market regime and remains in bull market mode with all five inputs bullish.
Declines and consolidations are considered corrections within the bigger uptrend as long as the Composite Breadth Model is net bullish. Note that this model is designed to absorb corrections and not turn bearish until the weight of the evidence is bearish.
The model and indicator charts can be found on the Market Regime page. These include the S&P 500 Thrust Model, S&P 1500 Thrust Model, S&P 500 Trend Model and S&P 1500 Trend Model.
You can learn more about the methodology and historical performance for these breadth models in this article.
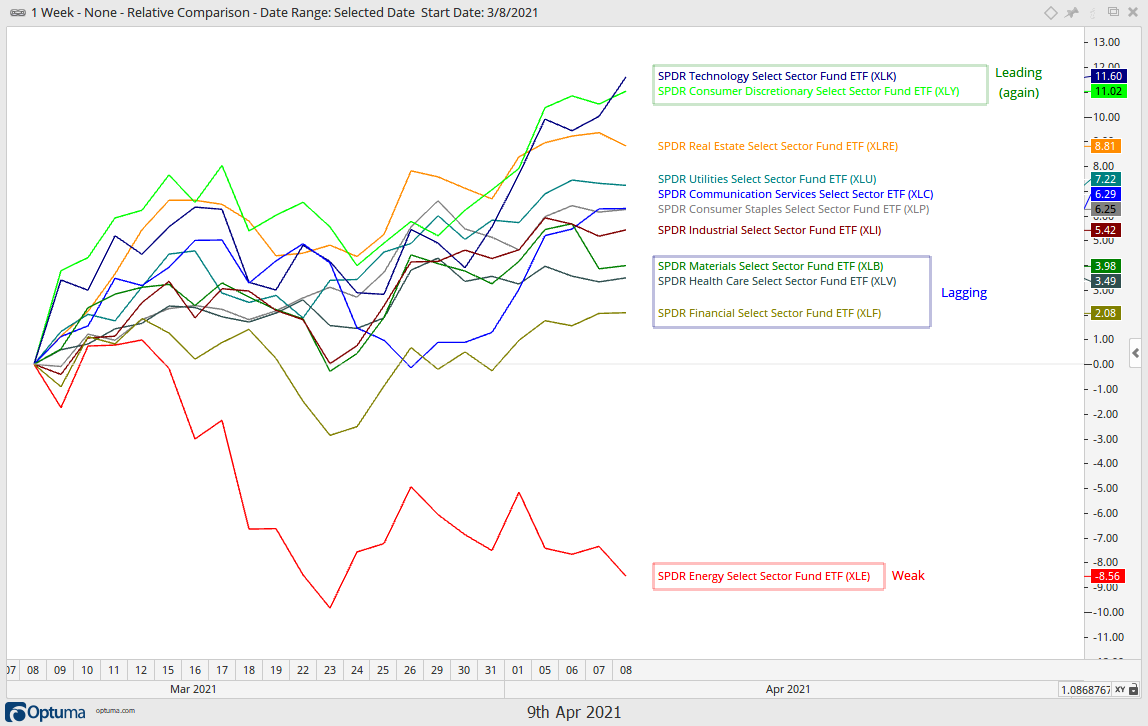
Meet the New Boss, Same as the Old Boss
Yep, it was time to crank out a quote from The Who, put the headphones on and listen to Won’t Get Fooled Again. The Technology SPDR (XLK) was leading in early February, lagging in early March after a double digit decline and leading again over the past month. XLK is up 11.60% since March 8th and the best performing sector SPDR over the past month. XLY, which is 23% Amazon and 14% Tesla, was also lagging a month ago and also hit a 52-week high this week (green outline). Elsewhere, REITs, Utilities and Staples are also performing well this past month. The Finance SPDR (XLF) is the lagging sector among the gainers with the smallest gain (2.08%). The Energy SPDR (XLE) is the weakest sector with an 8.5% decline since March 8th.
So what’s the lesson here? Pullbacks within uptrends are our friends. Pullbacks provide opportunities to partake in said uptrends with a better reward:risk ratio. There were setups galore in mid March (bull flags, falling wedges) and the seasonal patterns turned bullish at the end of March (turn of month and April). Big moves and new highs are good for commentary that reinforces the bullish thesis, but these are not setups per se. Setups and signals are where the action is and that action has passed as far as traders are concerned. Trend-followers and momentum players are simply riding the wave.
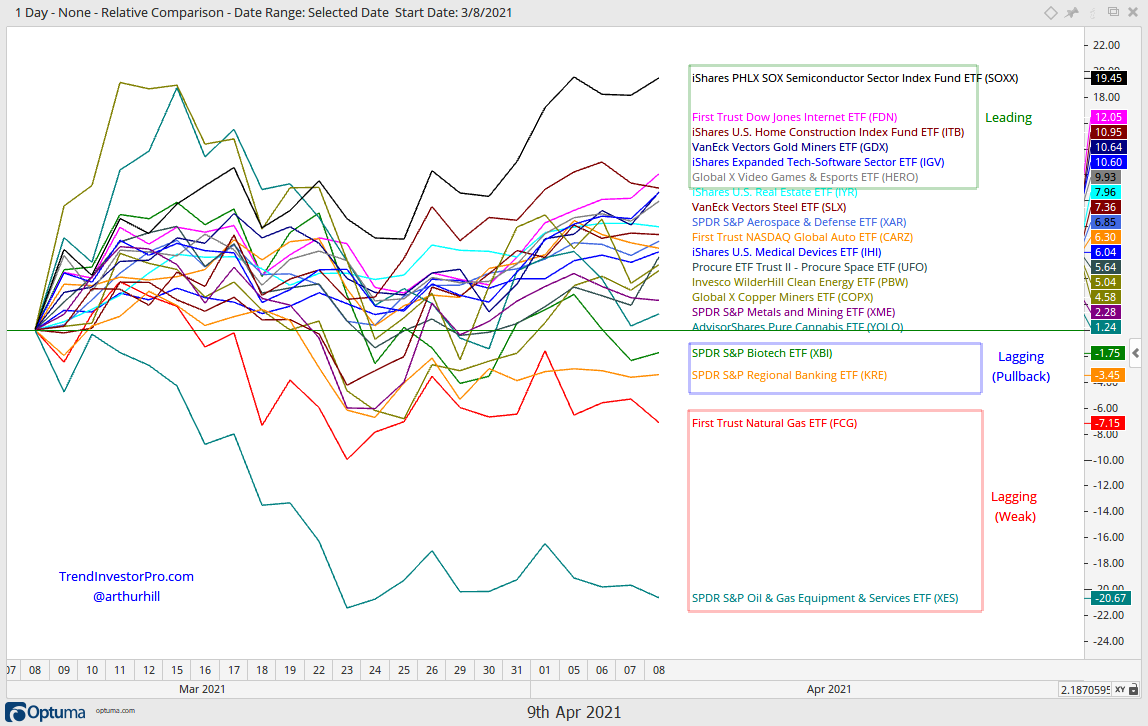
The next chart shows performance for twenty industry group ETFs since March 8th. I picked March 8th because this is when SPY bottomed and this is a benchmark low from which we can measure performance. At the top, we can see the Semiconductor ETF (SOXX), the Internet ETF (FDN), the Home Construction ETF (ITB), the Gold Miners ETF (GDX), the Software ETF (IGV) and the Video Game eSports ETF (HERO). On the downside, the Biotech SPDR (XBI), Regional Bank ETF (KRE), Natural Gas ETF (FCG) and Oil & Gas Equipment & Services ETF (XES) are down. I am not a fan of energy-related ETFs right now, but the pullbacks in KRE and XBI could provide opportunities. Check the charts.
Here is the symbol list: IGV, SOXX, FDN, ITB, IBUY, KRE, IYR, XAR, XBI, IHI, XES, FCG, COPX, SLX, GDX, PHO, HERO, CARZ, YOLO, UFO
Yield Spreads and Fed Balance Sheet
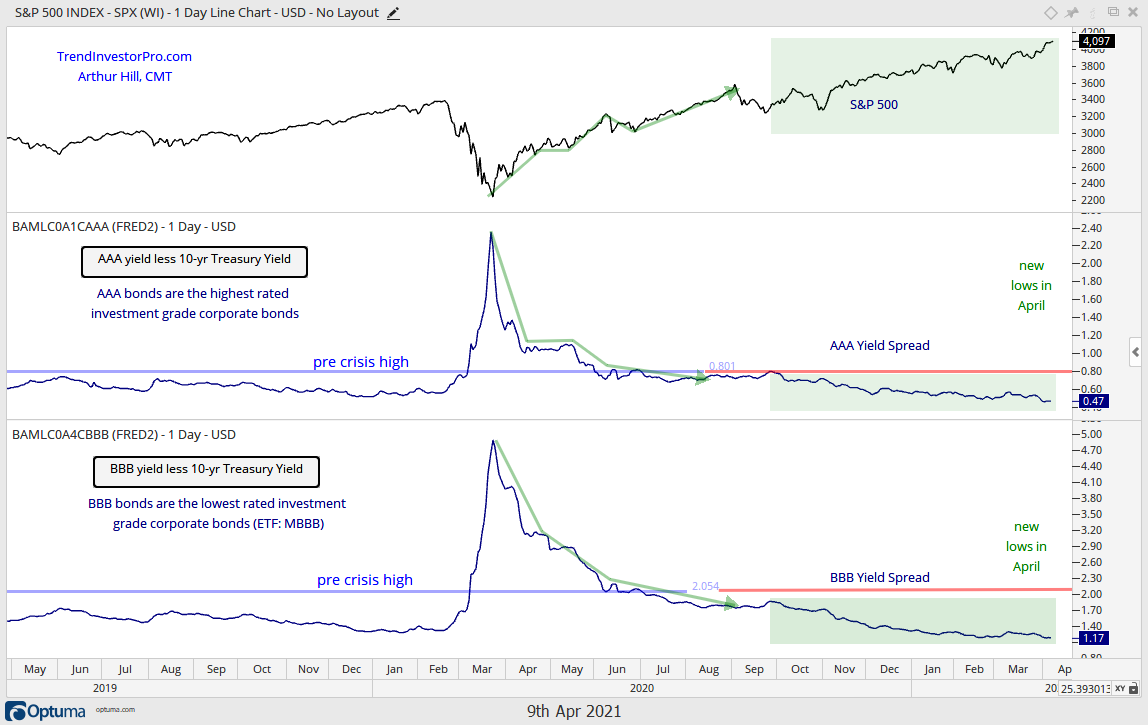
Yields spreads narrowed across the board and hit new lows in April. The AAA yield spreads are at their lowest levels in over 10 years and show no signs of stress in high-end investment grade bonds. The BBB yield spread also narrowed further and hit a multi-year low. This shows confidence in low-end investment grade bonds.
The BBB yield spread is the difference between the yield on BBB corporate bonds and US Treasury bonds. BBB bonds are the lowest rated investment grade bonds. A narrowing spread (falling) shows increasing confidence in the credit markets, while a widening spread (rising) shows increasing stress.
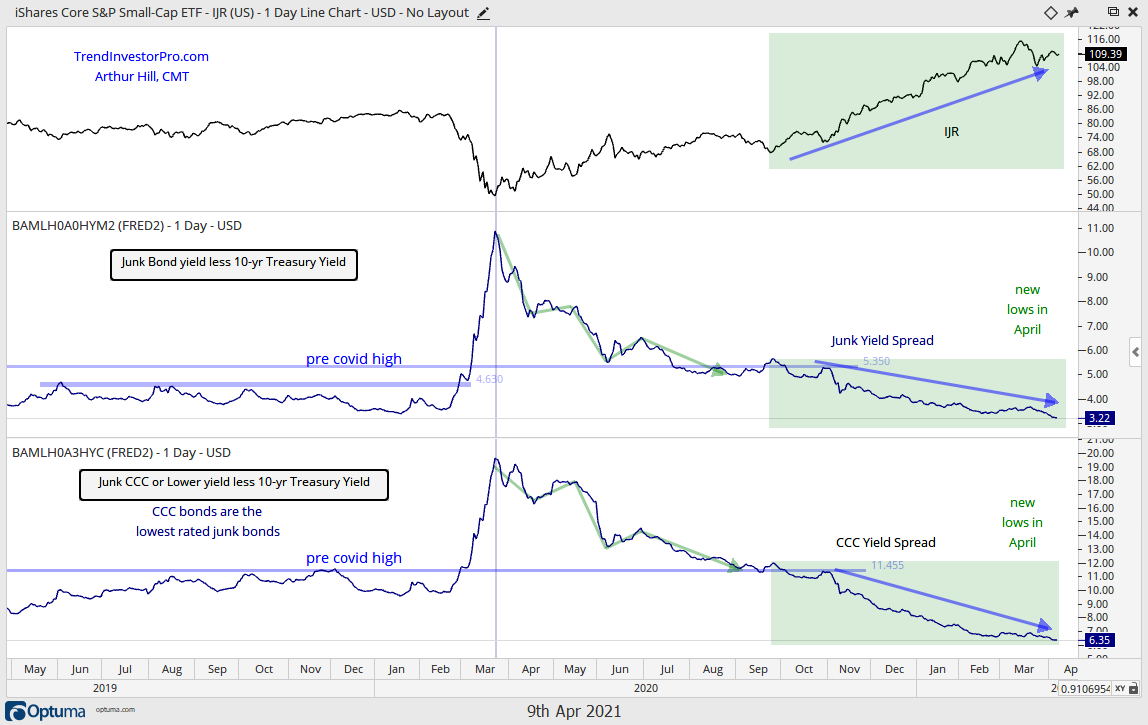
Junk and CCC bond spreads narrowed further this week and hit multi-year lows. Junk bond spreads are at their narrowest (lowest level) since October 2018, while CCC spreads are at their narrowest since July 2014. There are no signs of stress in the lowest grade bonds and this is net positive for stocks.
The CCC spread is the yield difference between CCC corporate bonds and US Treasuries. CCC bonds are the lowest rated junk bonds (riskiest). A narrowing spread (falling) shows increasing confidence in low quality bonds, while a widening spread (rising) shows increasing stress.
The Fed’s balance sheet contracted by $20 billion this week. Overall, the balance sheet has been expanding since mid July and remains near an all time high.
")