Copper, All Things Electric and some Broad Market Thoughts (Premium)
Posted By
Arthur Hill, CMT
On
In
Archive |
No Comments
I am always interested in themes that can drive secular trends. These include electronic payments, electric vehicles, clean energy, marijuana and such. These themes involve narratives and I am always careful with narratives. We all love a good story and stories help sell us on an idea. However, not all narratives turn out the way we expect and this is why we have price charts. A bullish narrative and bullish price chart make for a powerful combination. We should start to question the narrative when/if the price chart suggests otherwise.
You can learn more about my chart strategy in this article[1] covering the different timeframes, chart settings, StochClose, RSI and StochRSI.
Copper Demand, Electricity and Sustainability
Jeff Currie of Goldman Sachs talks about copper as the single best conductor for electricity and the increase in demand via sustainable energy (wind turbines, electric vehicles, solar panels and energy storage). Thus, a play on copper is an indirect play on everything electric.
Copper ETF
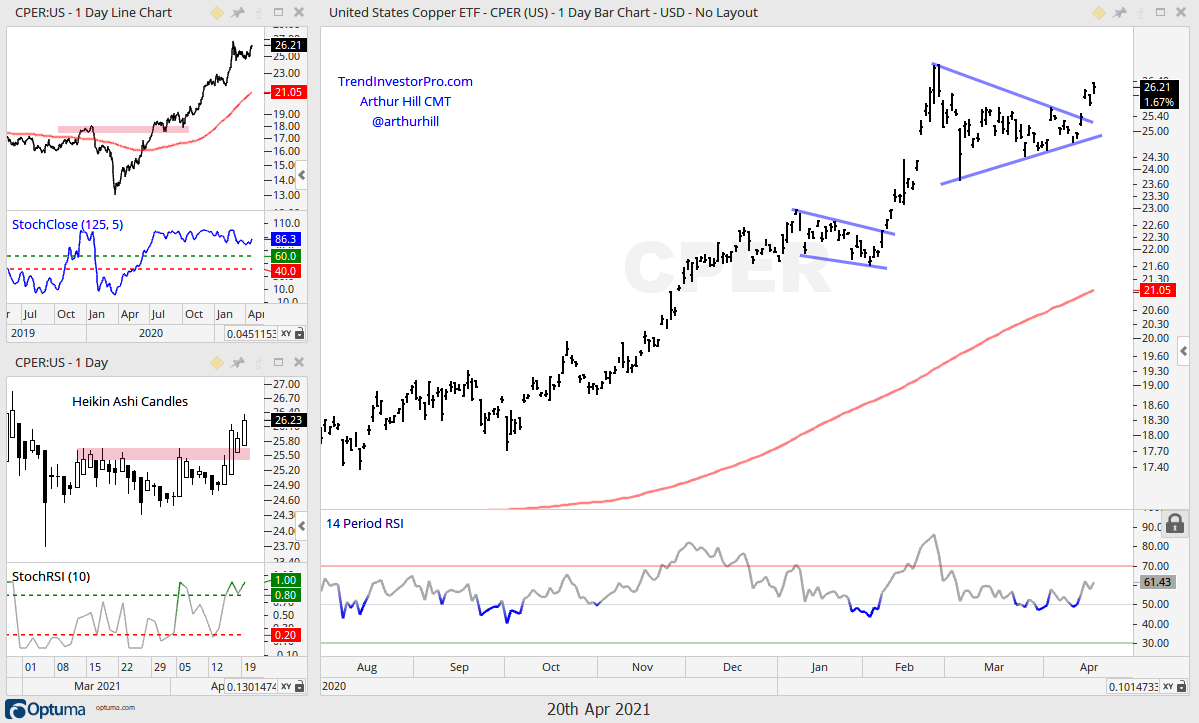
The chart below shows the Copper ETF (CPER) doubling from 13 to 26 in the upper left window. The ETF consolidated from early March to early April with a triangle and broke out of this triangle last Thursday. A triangle within an uptrend is a bullish continuation pattern or rest within the trend. The breakout signals a continuation of this trend and a new high is expected. The lower left window shows the Heikin-Ashi Candles with a resistance breakout.
Three Industrial Metals in One
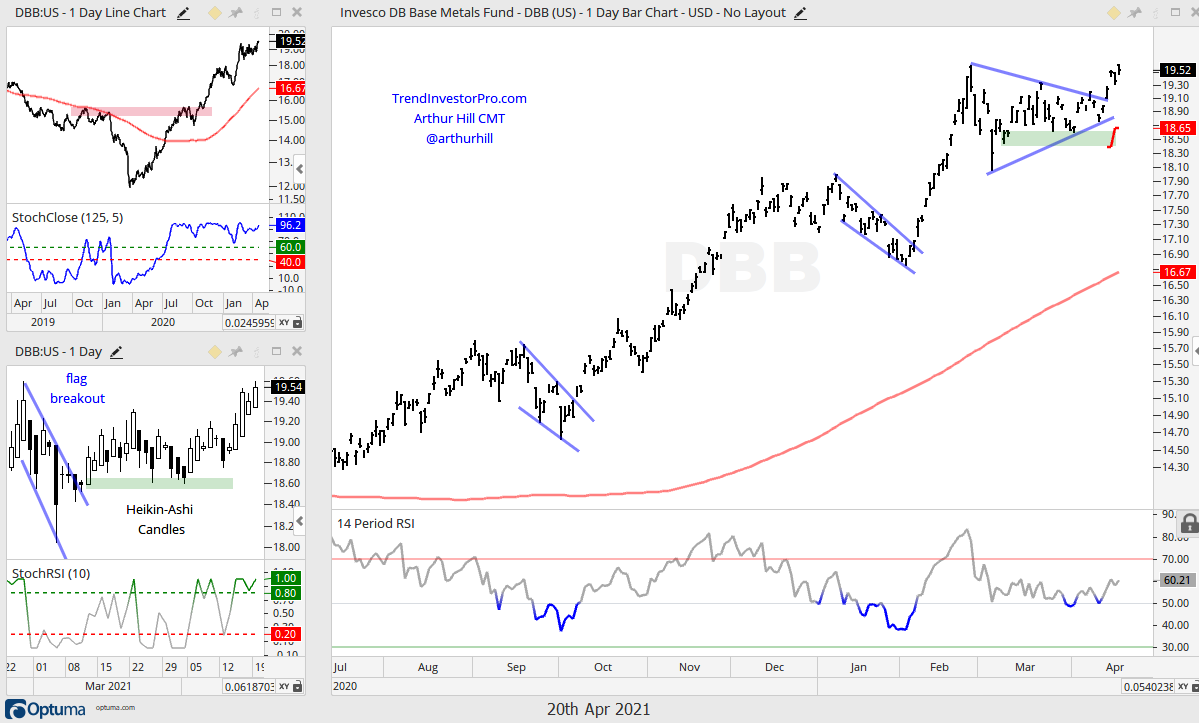
Copper is also part of the DB Base Metals ETF (DBB), which has been featured in the Thursday reports since the flag breakout in early March (lower left). There is also a triangle breakout on the bar chart with a surge the last four days. The red line shows the ATR Trailing Stop (3 x ATR(22)) set just below the April lows on the breakout. This is for traders playing the triangle breakout. Investors playing the secular uptrend will likely need more wiggle room.
You can learn more about ATR Trailing stops in this post[2], which includes a video and charting option for everyone.
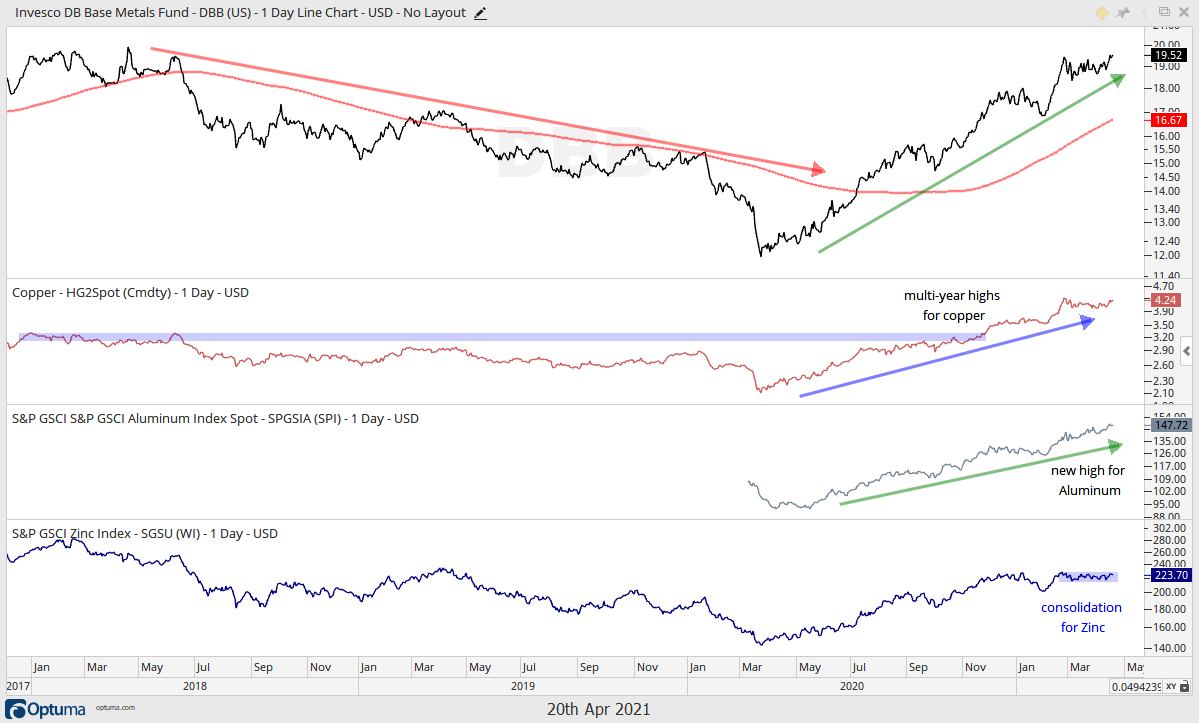
DBB is equal parts copper, aluminum and zinc. The next chart shows spot copper breaking out to multi-year highs in November, hitting a new high in February and consolidating into April. Aluminum has been rising since May and hit a 52-week high here in April. Zinc rose from March to January and then stalled the last few months. This is a bullish continuation pattern and a breakout would signal a continuation of the bigger uptrend.
The Second Year of a Bull Market
Next up we have a concise and informative video from Chris Verrone of Strategas. Here are the topics:
years one and two of new bull markets
current sentiment readings
why this is not 1999
leadership from housing
leading sectors
strength in DAX and CAC
Big 52 and 24 Week Runs for SPY
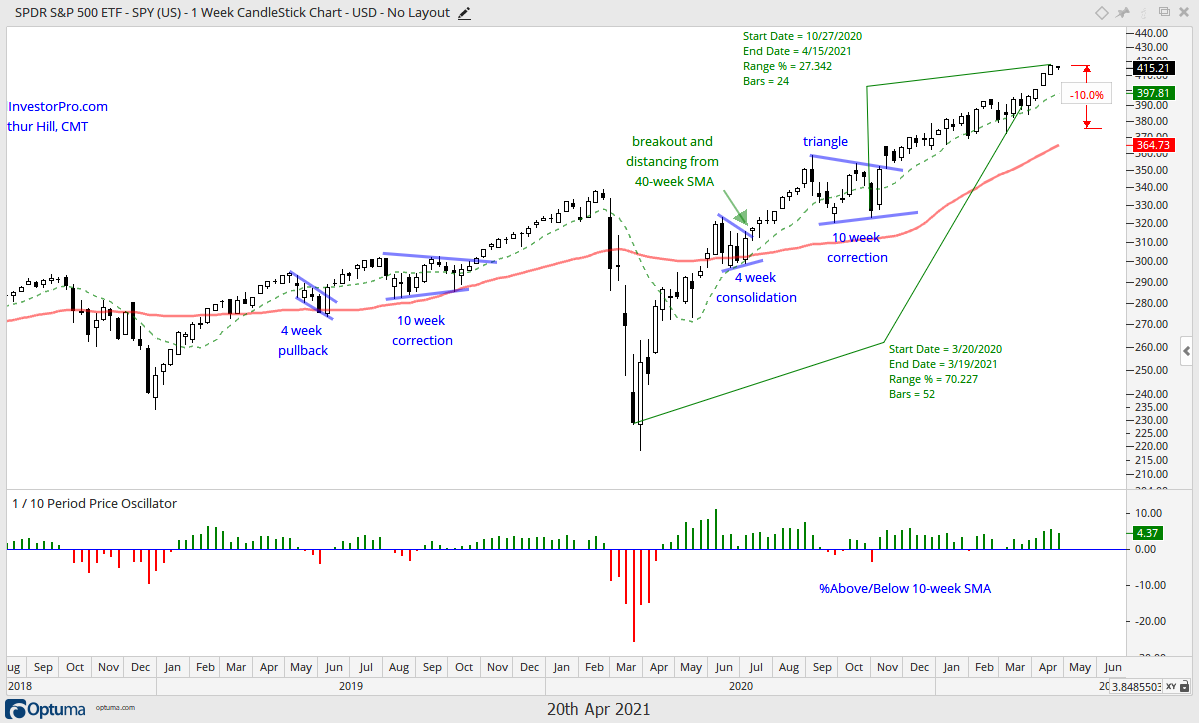
I especially like how Verrone uses the terms unique crisis and ordinary markets. Every crisis is unique, but the market reactions are not. Although, the 74% advance in the first year of this bull run, which is by far the highest on his table, seems extraordinary to me. The chart below shows weekly bars for SPY and a 70% advance from the March 2020 closing low to the March 19th close. SPY is also up 27% since late October (24 weeks) and the longest pullback lasted just two weeks. Talk about smoothing sailing!
Most recently, SPY left its 50-day SMA behind with a four week surge and is getting a little extended. Verrone’s research suggest that the second year of a bull market is a little rockier and the odds of a correction are high. A garden variety 10% correction from the recent high would push SPY below 380. This is not the call right now, but the odds of a decent correction increase as the bull matures and such a pullback would be an opportunity (as long as the Composite Breadth Model remains bullish).
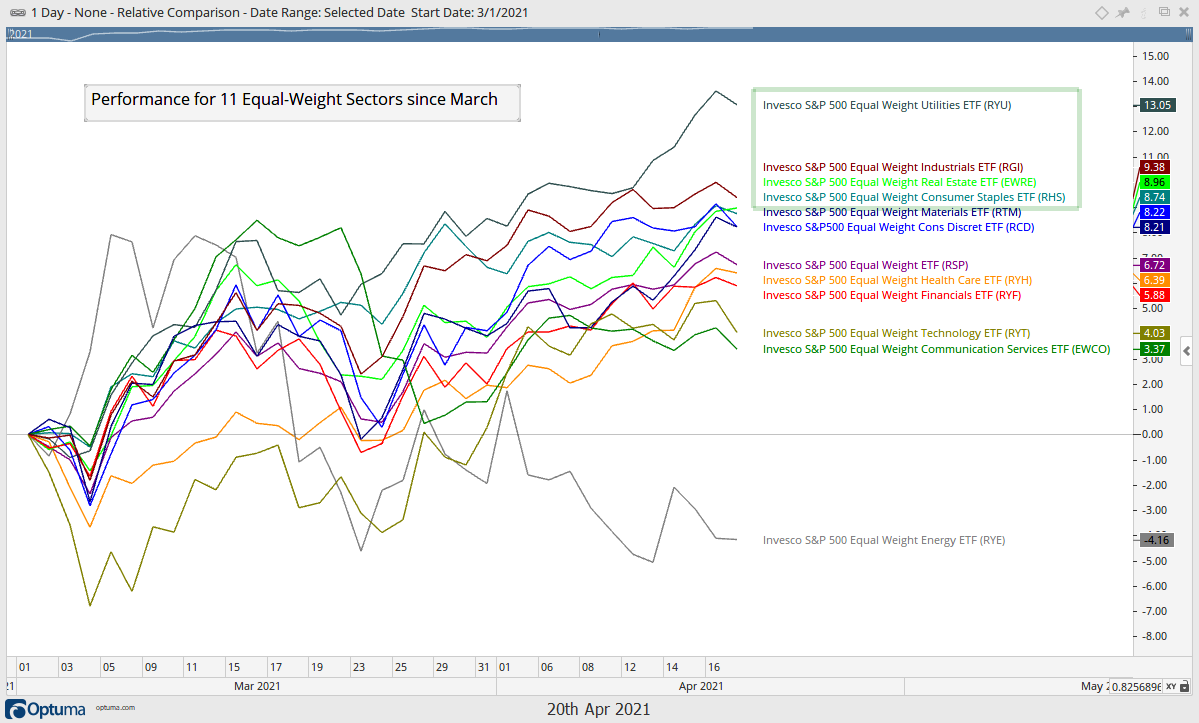
Defensive Sectors Start to Lead
Verrone also notes that the defensive sectors are not leaders, but I would also take some issue with this assessment, with all due respect. The chart below shows that the EW Utilities ETF (RYU), EW REIT ETF (EWRE) and EW Consumer Staples ETF (RHS) are the top performing sectors since March. The EW Industrials ETF (RGI) is also performing well, but there is clearly more interest in the defensive sectors over the last month and a half.