Chart Trader Weekly Report – Broad Market Analysis, Leading Groups (ETFs), Chart Setups and Trading Ideas (Premium)

Use CRTL+P to Print

Video and Report Headlines

  • Composite Breadth Model Remains Bullish
  • Over 70% of S&P 500 Stocks in Uptrends
  • BBB Spread Remains Near Lows (narrows)
  • Sharp Rise in 10-yr Yield Could be Headwind for Stocks
  • SPY Holds above Rim Breakout
  • QQQ, MAGS, XLK and SMH Remain with Triangle Breakouts
  • Bullish, but Extended: Cyber, Software, Fintech and Cloud
  • Zscaler Corrects with Massive Wedge
  • XLV and IBB Fail to Hold Short-term Breakouts
  • Copper Pulls Back within Uptrend
  • DB Base Metals ETF Consolidates after Surge
  • Freeport Returns to the Breakout Zone
  • Palladium Goes for Big Breakout
  • GLD Remains Strong and Extended
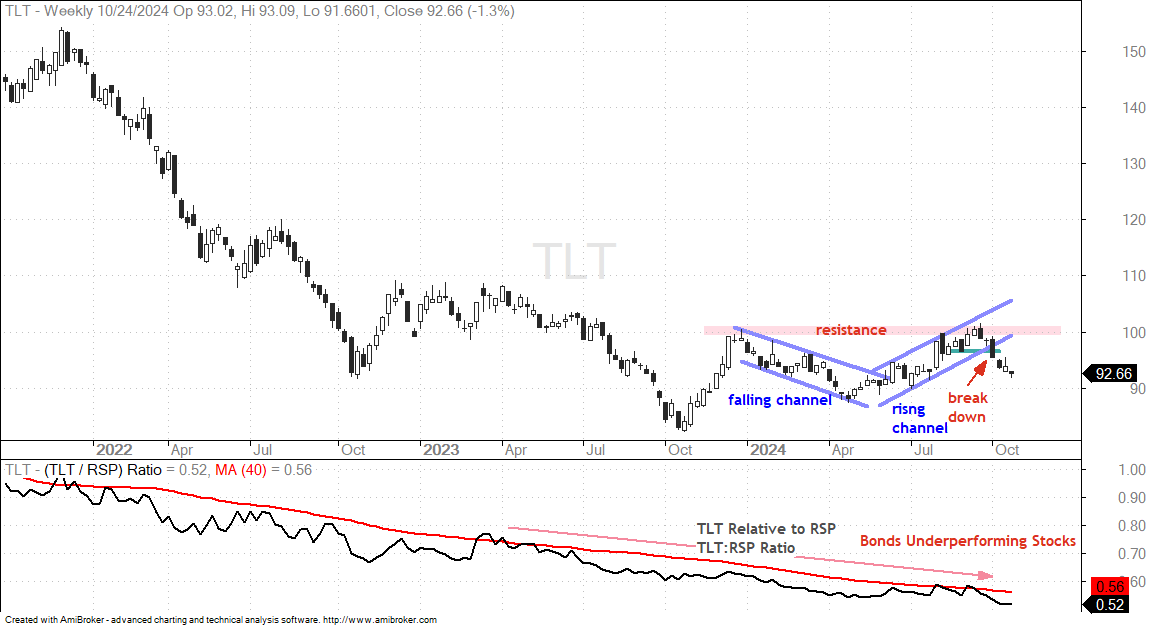
  • TLT in Downtrend after Channel Break
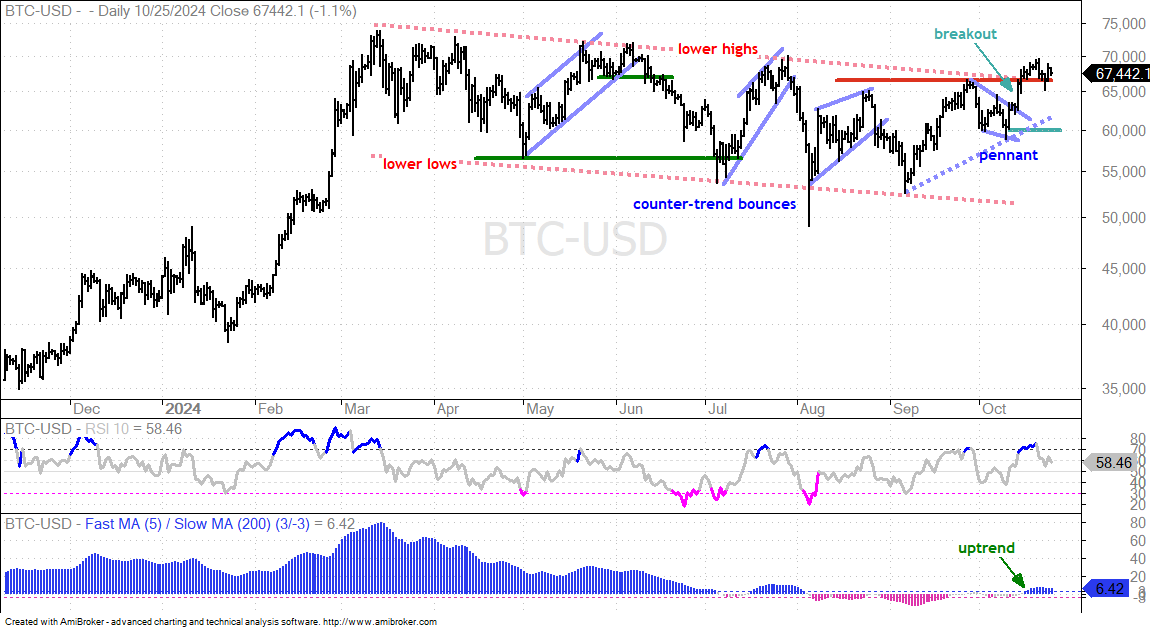
  • Bitcoin Holds its Breakout

The next Weekly Report will be posted on Friday morning, November 1st.

The weight of the evidence remains bullish for stocks. The Composite Breadth Model is at +5, the vast majority of stocks are above their 200-day SMAs and yield spreads remain narrow. Short-term, we could see some headwinds and volatility because the 10-yr Treasury Yield surged and the election looms. We will cover the surge in the 10yr Yield, but take a pass on the election.

Today’s report features a stock in the cybersecurity group (Zscaler) and a copper miner (Freeport McMoRan). The Cybersecurity ETF (CIBR) remains one of the strongest tech ETFs and the Copper ETF (CPER) is setting up short-term. Copper and base metals are also in long-term uptrends.  

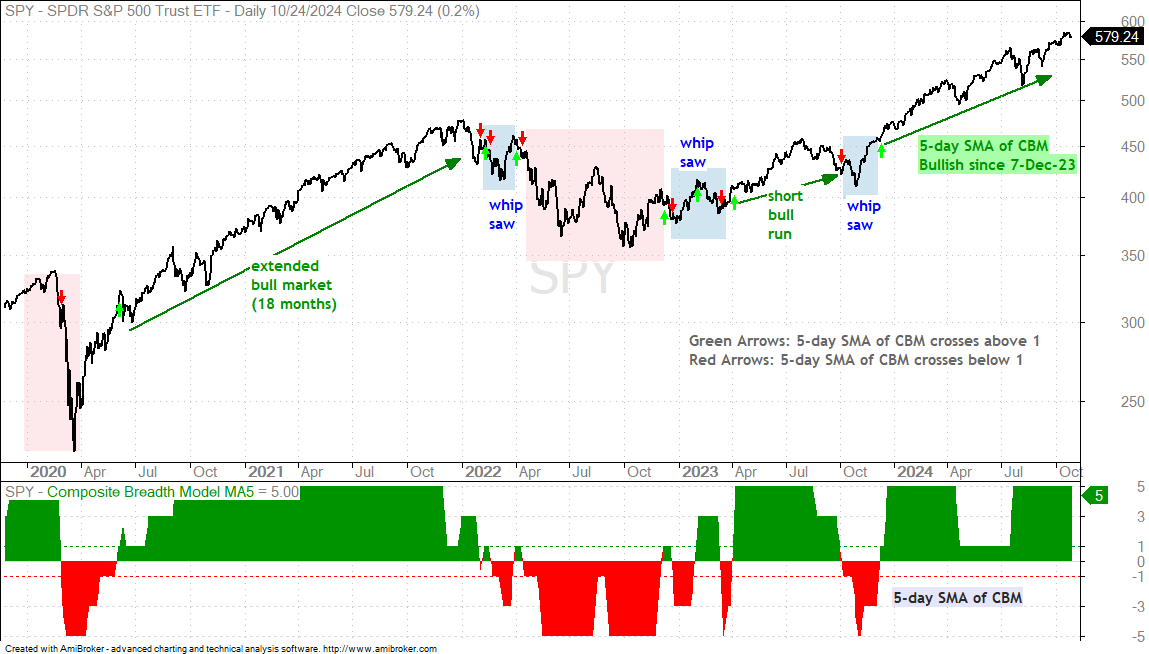
Composite Breadth Model is Bullish

The chart below shows SPY with the 5-day SMA of the Composite Breadth Model at +5. This model turned bullish on December 7th and remains bullish. A positive CBM signals a favorable environment for stocks (bull market). Even within a bull market, we can still see pullbacks, corrections, volatility, rotations and trading ranges.

The Composite Breadth Model aggregates signals in over a dozen breadth indicators from the S&P 500 and S&P 1500. This means it covers large-caps, mid-caps, small-caps, NYSE stocks and Nasdaq stocks. It ranges from +5 to -5. A bull market is present when the 5-day SMA of the CBM is at +1 or higher. A bear market is present when below +1.

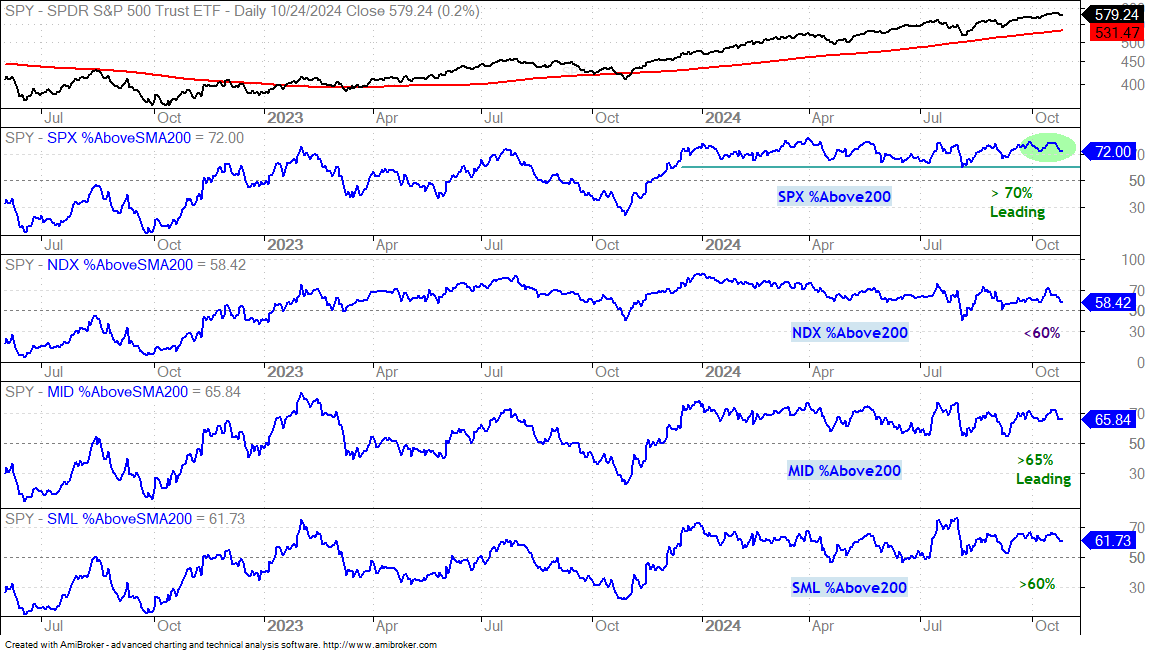
Over 70% of S&P 500 Stocks in Uptrends

The S&P 500 continues to lead with the most uptrends (72%). Well over two thirds of the stocks in the most important market benchmark are in uptrends and this supports the bull market thesis. Nasdaq 100 stocks are dragging their feet a little because less than 60% are in long-term uptrends. Even so, all 7 of the MAG7 are above their 200-day SMAs and this supports an uptrend in QQQ. Elsewhere, over 60% of small-cap and mid-cap stocks are above their 200-day SMAs and this is also bull market territory.

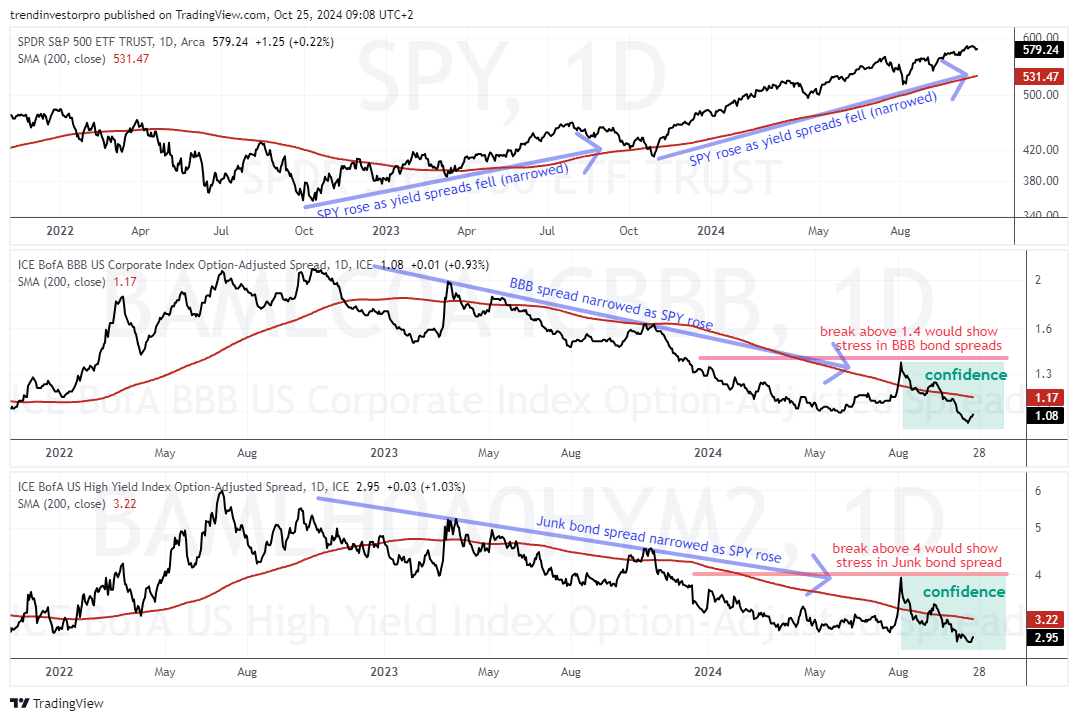
BBB Spread Remains Near Lows (narrow)

The next chart shows SPY, the BBB spread and the Junk bond spread with their 200-day SMAs. The BBB and Junk bond spreads fell to new lows in October and remain near these lows. This means the spreads narrowed and this shows confidence in the corporate bond market, which is bullish for stocks.  

These spreads show the difference between a corporate bond yield (BBB) and the equivalent US Treasury bond yield. BBB bonds are the lowest rated investment grade bonds. US Treasuries are the ultimate safe-haven bonds. The spread between these two widens (rises) when stress builds in the corporate bond market. This is negative for stocks. The spread narrows (falls) when stress levels are low or subsiding. This is positive for stocks.

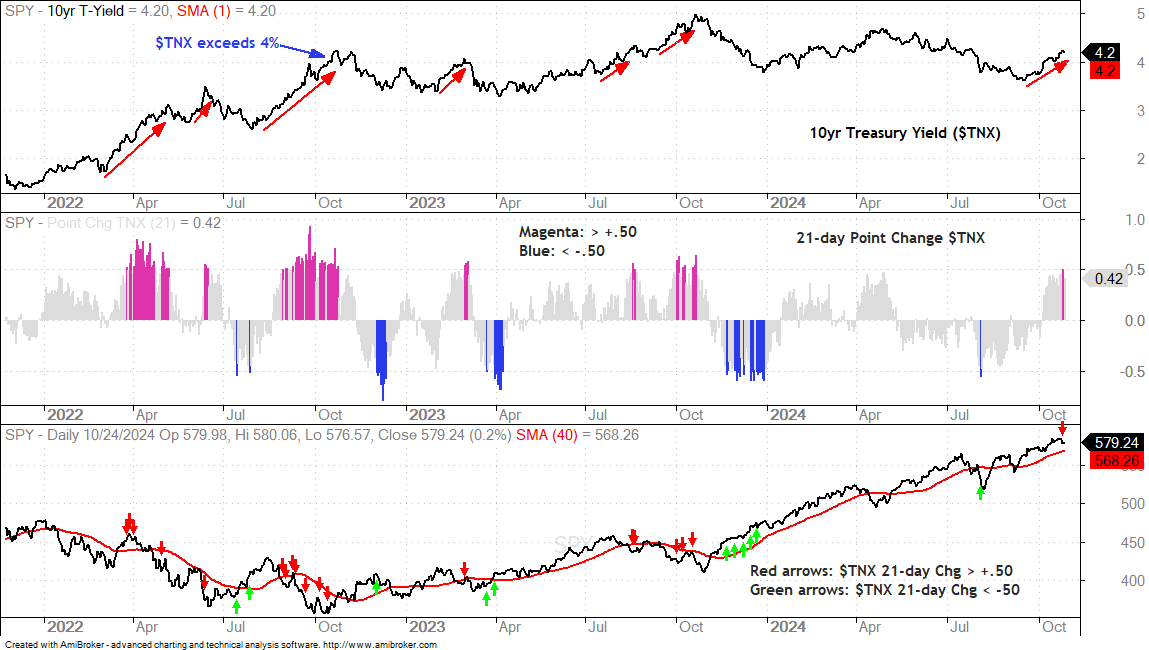
Sharp Rise in 10-yr Yield Could be Headwind for Stocks

Despite narrow yield spreads, the bond vigilantes became active over the last few weeks and pushed the 10-yr Treasury Yield ($TNX) above 4.20%. In the top window on the chart below, the yield rose from the 1.5% area in late 2021 to 5% in October 2024. There were seven exceptionally sharp rises along the way (red arrows). The middle window shows the 21-day Point Change for the 10-yr Treasury Yield, which defines these sharp rises. This turns magenta when it exceeds .50 (sharp rise) and blue when it exceeds -.50 (sharp fall). Thus, a 21-day change greater than .50 is considered a sharp rise in the 10yr Yield.

The bottom window on the chart above shows SPY. Red arrows show when sharp rises occurred and the green arrows show when there were sharp falls. Notice that the sharp rises typically mark periods of weakness for SPY, while the sharp falls led to strength. Stocks like it when the 10yr Yield falls sharply, but do not like it when it rises sharply, which is the case right now. The 21-day Point Change for $TNX exceeded .50 this week and this could provide a headwind for stocks.

SPY Holds above Rim Breakout

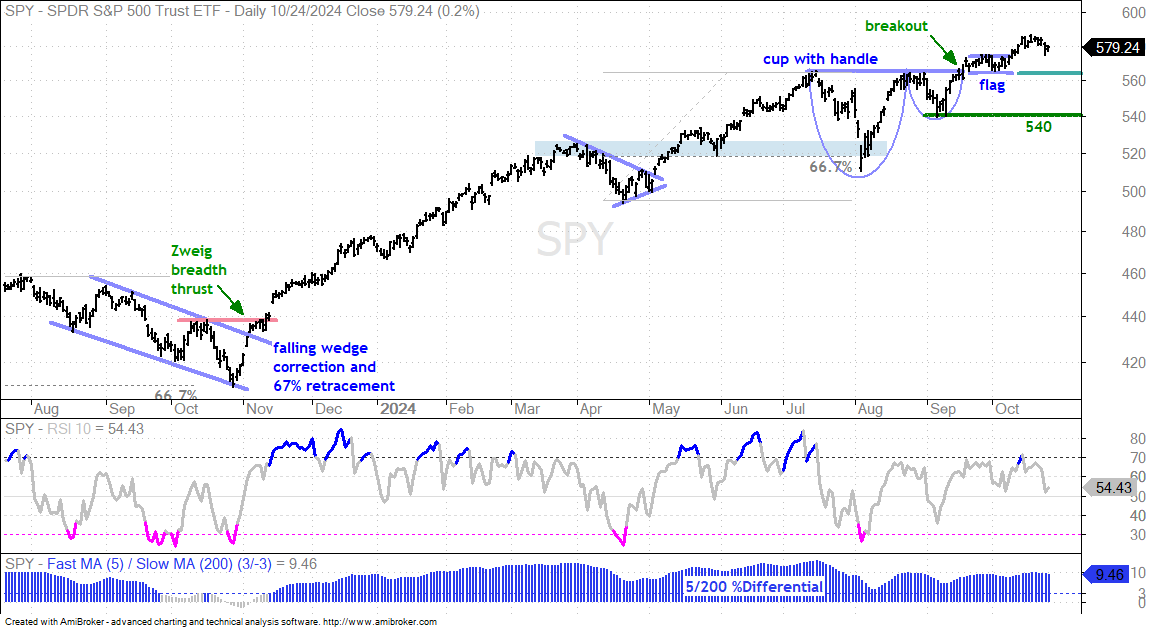
There is no change on the S&P 500 SPDR (SPY) chart. The cup-with-handle and flag breakouts remain in play. SPY tagged a new high last week and then fell back a little this week. Broken resistance and the flag low mark first support at 564. A break here would not be that bearish because the long-term trend is up and a pullback would be considered an opportunity, not a threat. Thus, a pullback to the 550-560 area could offer a chance to partake in the bull market at a discount. We will cross that bridge when/if it gets here. Key support is set at 540.

The indicator windows show RSI(10) and the 5/200 %Differential. The latter tells us the direction of the long-term trend. It turns bullish with a move above +3% (blue) and remains bullish until a move below -3% (magenta). This long-term trend indicator has been bullish since February 2023. It dipped into negative territory in October, but did not exceed -3%. This signal threshold helps to reduce whipsaws and stay with the bigger trend. RSI is used to identify oversold conditions during a long-term uptrend. It turns magenta with a move below 30. I typically ignore overbought readings because overbought conditions are normal in strong uptrends. 

QQQ, MAGS, XLK and SMH Remain with Triangle Breakouts

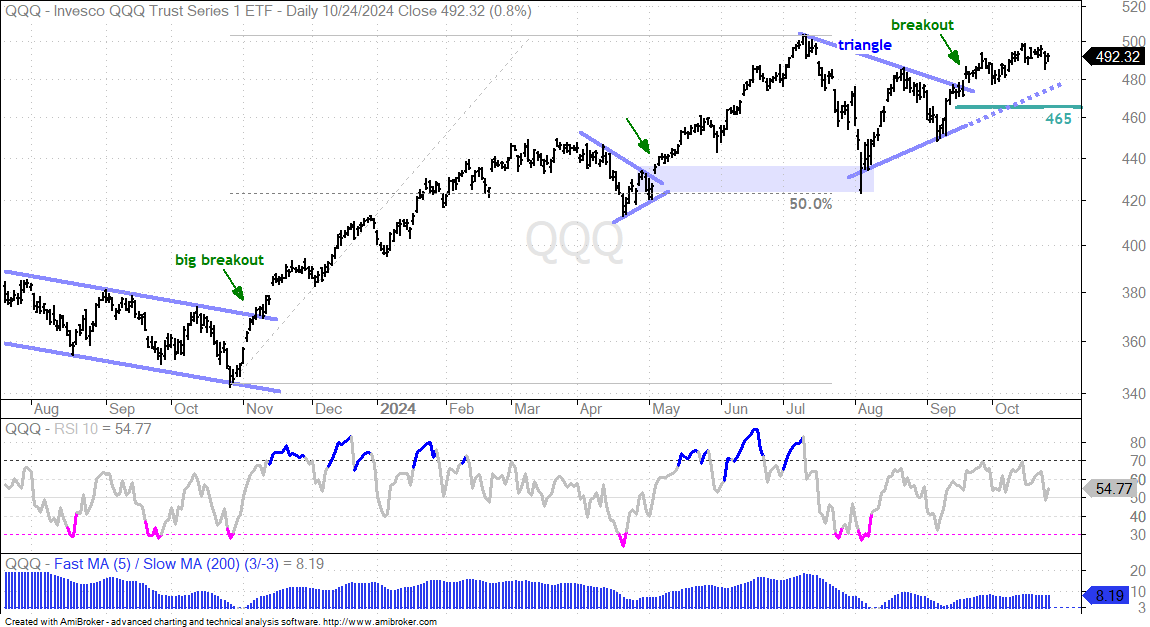
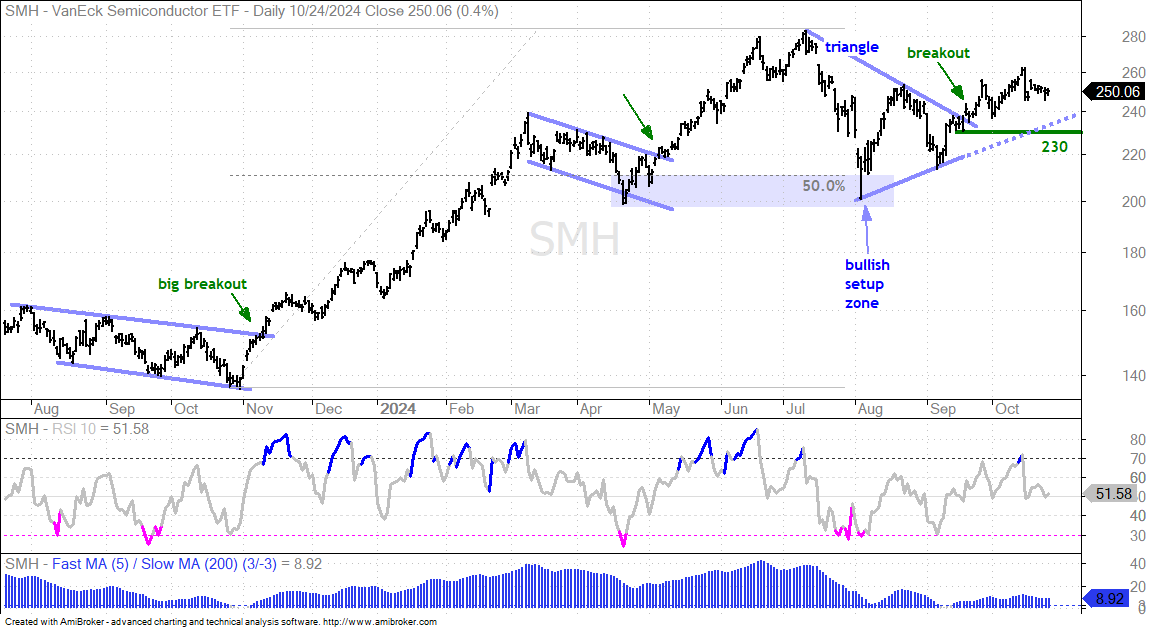
QQQ remains in a long-term uptrend, per the 5/200 %Differential in the bottom window. The triangle breakout is the active signal medium-term. A triangle consolidation within a long-term uptrend is a bullish continuation pattern. As such, the triangle breakout signals a continuation of the long-term uptrend and new highs are expected.

Short-term, QQQ fell sharply (>1%) on October 15th and 23rd. QQQ is also lagging SPY and the S&P 500 EW ETF (RSP) because it has yet to exceed its July high. As seen with the percentage of Nasdaq 100 stocks above their 200-day SMAs, QQQ and some large-cap techs are looking a little tired. The blue dashed line extends the triangle line to define the rate of ascent for this upswing. Based on the triangle breakout, I am marking support at 465. A break below 465 would negate the triangle breakout.

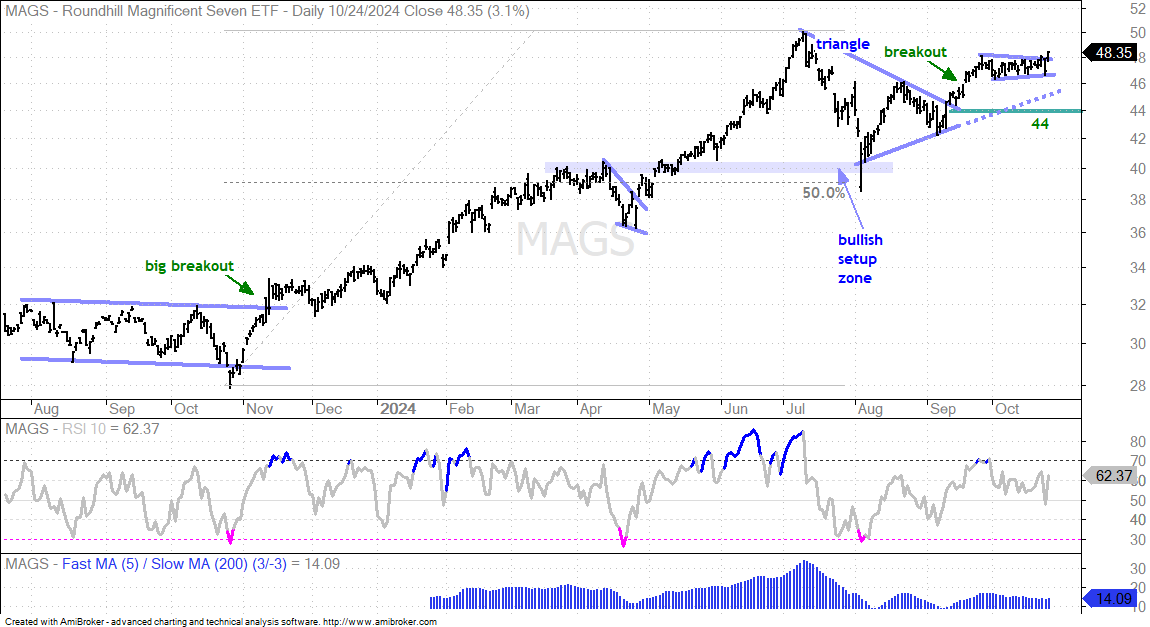
The next chart shows the Mag7 ETF (MAGS) with similar characteristics and support marked at 44. Also notice that MAGS is breaking out of a short-term pennant with a Tesla led surge on Thursday.

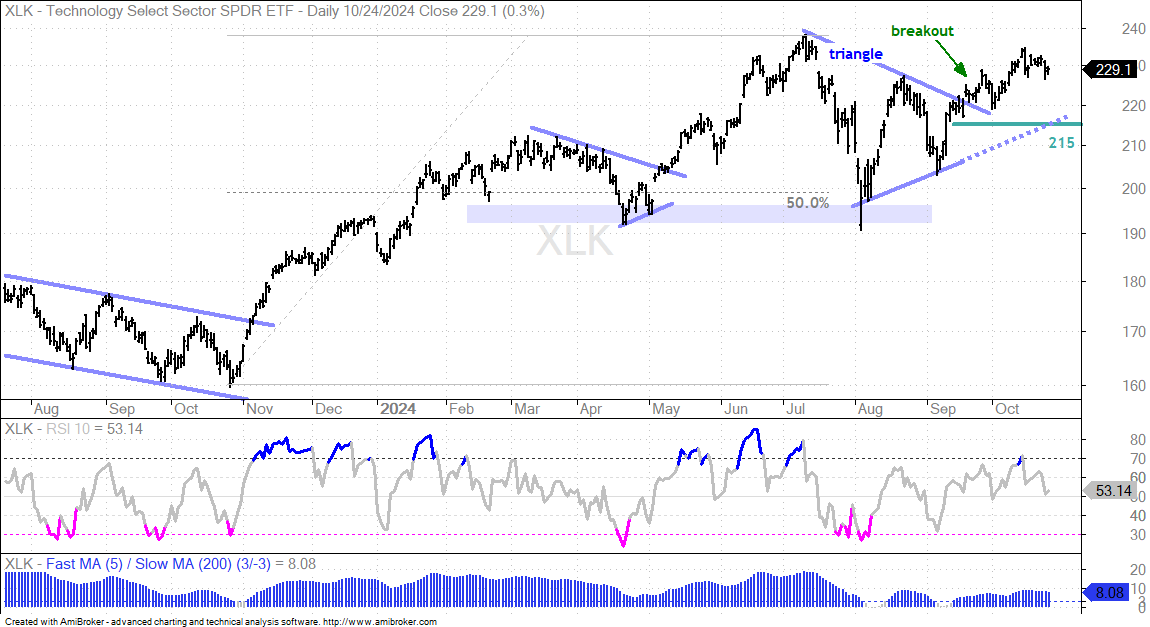
The next chart shows the Technology SPDR (XLK) with similar characteristics and support marked at 215.

The next chart shows the Semiconductor ETF (SMH) with similar characteristics and support marked at 230.

Bullish, but Extended: Cyber, Software, Fintech and Cloud

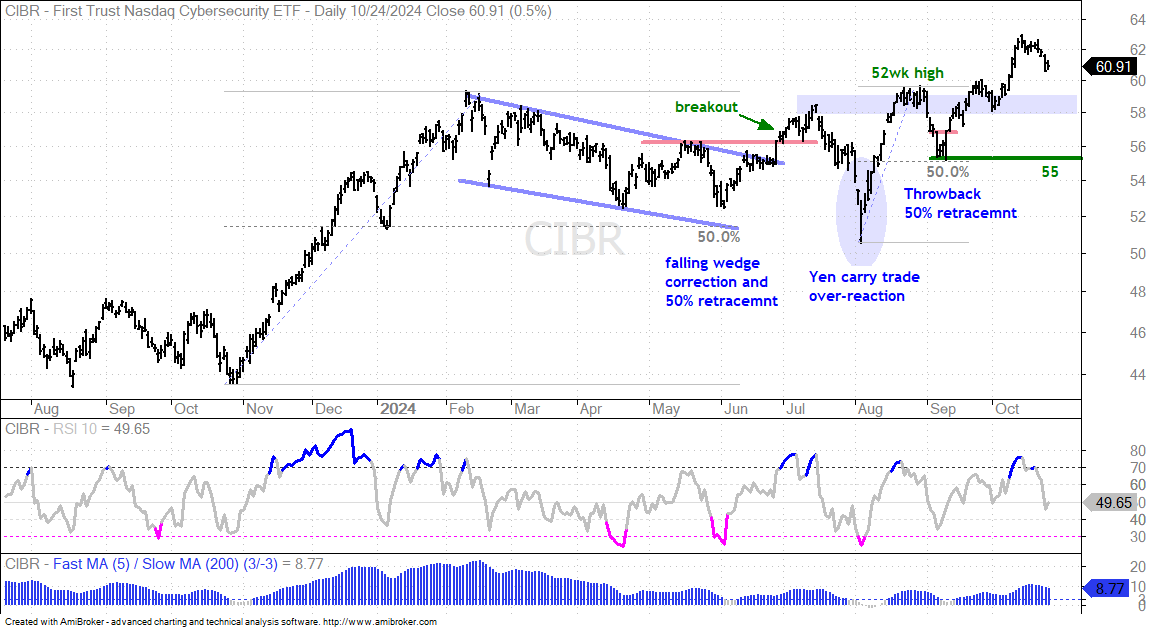
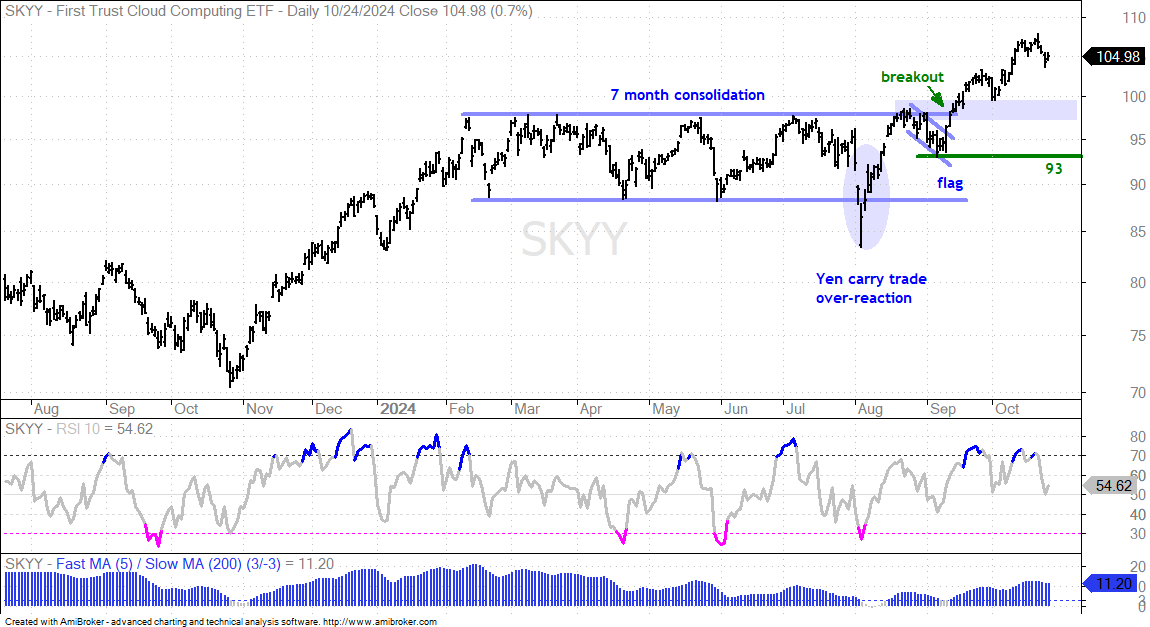
The Cybersecurity ETF (CIBR), Software ETF (IGV), FinTech ETF (FINX) and Cloud Computing ETF (SKYY) are stronger than the four tech ETFs above because they recorded new highs in September-October. These four are in long-term uptrends and leading, but became extended after 10+ percent advances from early September to mid October. IGV and CIBR peaked two weeks ago and started their pullbacks. SKYY and FINX fell this week. The green lines mark key support for the long-term trend. The blue shading above these lines marks short-term support to watch – should we see a pullback. A pullback within a long-term uptrend is a bullish opportunity. Thus, I will be watching these areas should prices extend here in the next week or two. The first chart shows CIBR with the short-term Bullish Setup Zone in the 58-59 area.

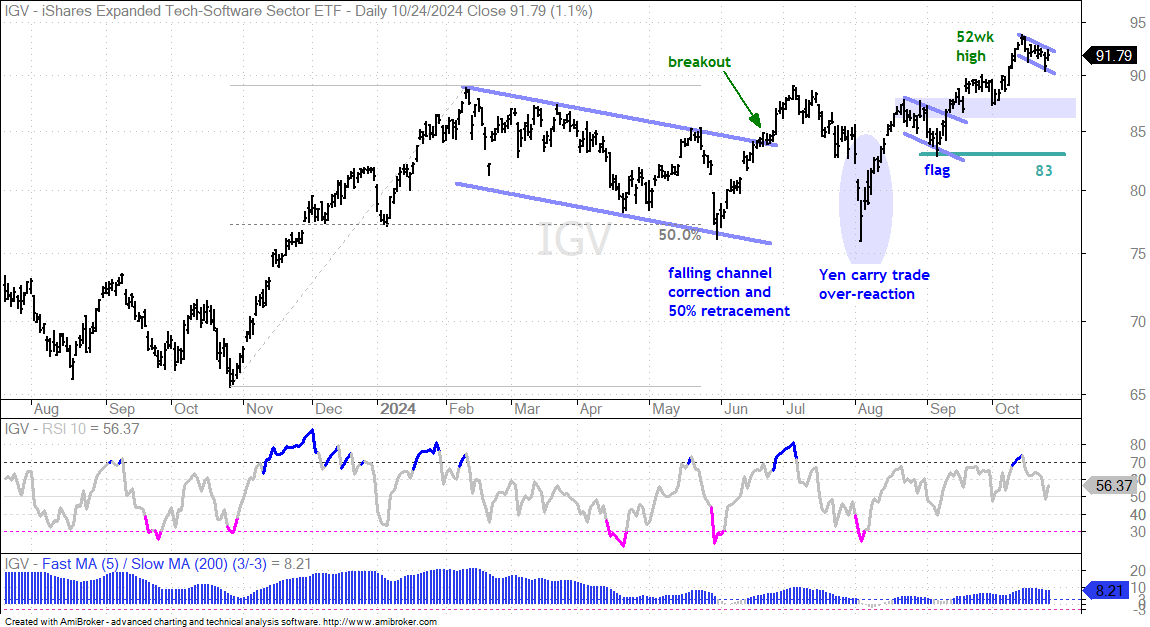
The next chart shows the Software ETF (IGV) with the short-term Bullish Setup Zone in the 86-88 area. IGV also formed a small flag over the last eight days. Note that MSFT reports next week.

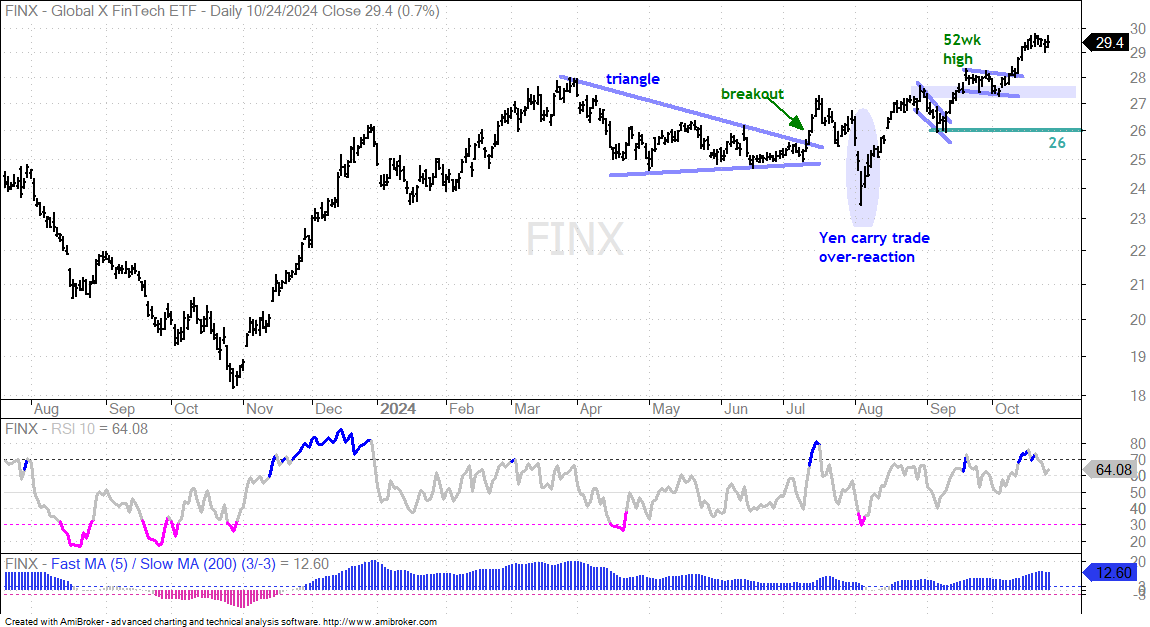
The next chart shows the FinTech ETF (FINX) with the short-term Bullish Setup Zone in the 27-27.50 area.

The next chart shows the Cloud Computing ETF (SKYY) with the short-term Bullish Setup Zone in the 97-100 area.

Zscaler Corrects with Massive Wedge

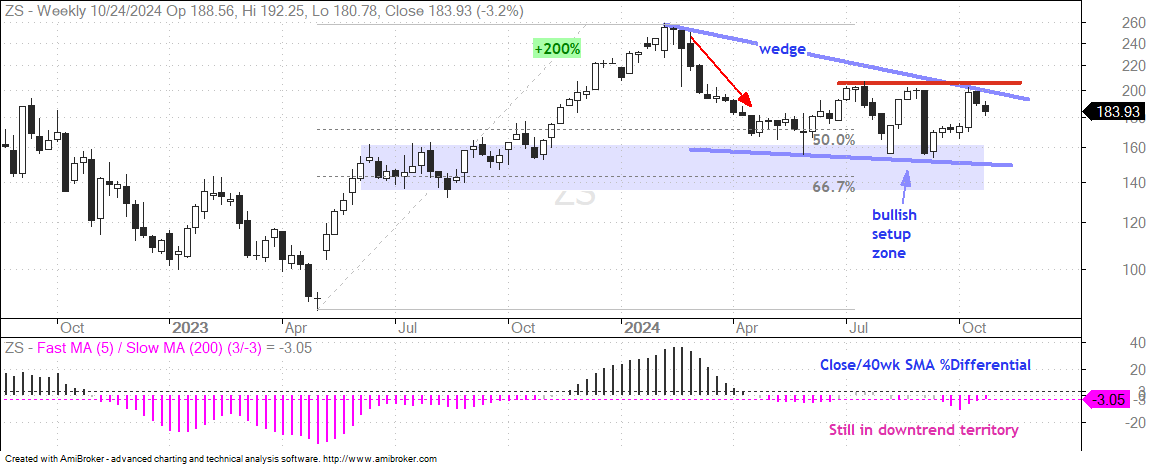
Zscaler (ZS) provides cloud-based internet security services and is part of the Cybersecurity ETF (CIBR). The stock is in a downtrend for 2024, but this could be a big correction after a huge advance in 2023. The first chart shows weekly candlesticks and a 200% advance from May 2023 to February 2024. ZS fell the rest of the year with a decline that retraced 50-62% of this 200% advance. Most of the decline occurred from mid February to mid April (red arrow) because the stock found support in the 160 area the last six months. Overall, I see a large bullish setup zone based on the 50-67% retracement zone and the consolidation in the middle of 2023 (blue shading). ZS found support in the upper end of this zone as a falling wedge formed. A wedge breakout would reverse the long-term downtrend and signal a continuation higher.

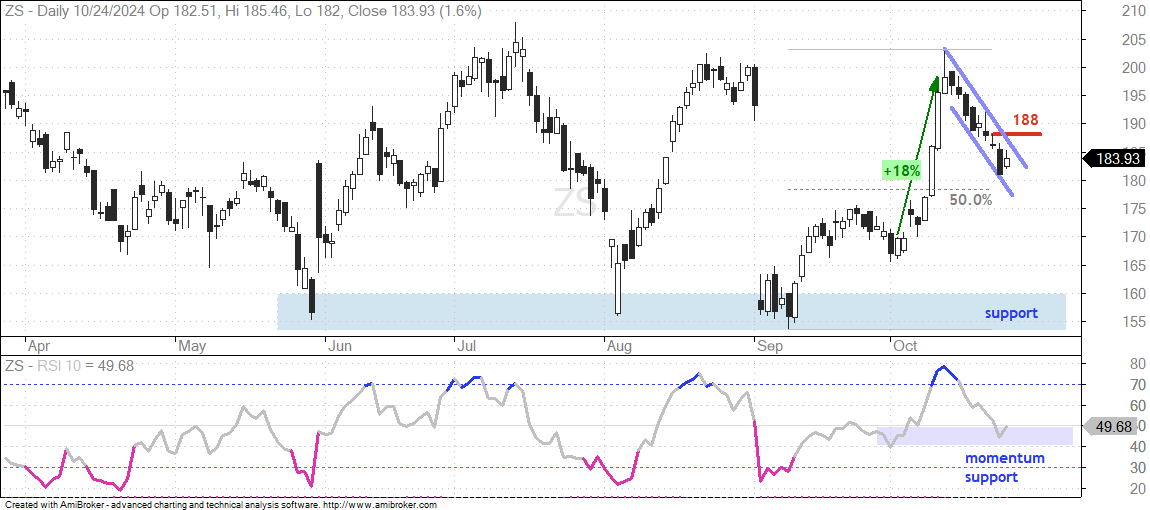
The next chart shows daily candlesticks since April. ZS traded range bound with support in the 155-160 area and resistance in the 200-205 area. The stock caught my eye short-term because it firmed immediately after the gap down in early September and surged 18% in early October. This is a powerful move that shows strong buying pressure. ZS then corrected with a falling flag that retraced 50% of the September-October advance. The pattern and the retracement amount are normal for corrections. Also notice that RSI fell back to the 40-50 zone, which can act as momentum support. I am marking short-term resistance at 188 and a breakout here would reverse the short-term downtrend. A breakout would also signal a continuation of the September-October advance and increase the odds for a bigger breakout on the weekly chart. ZS reports earnings on November 27th.

XLV and IBB Fail to Hold Short-term Breakouts

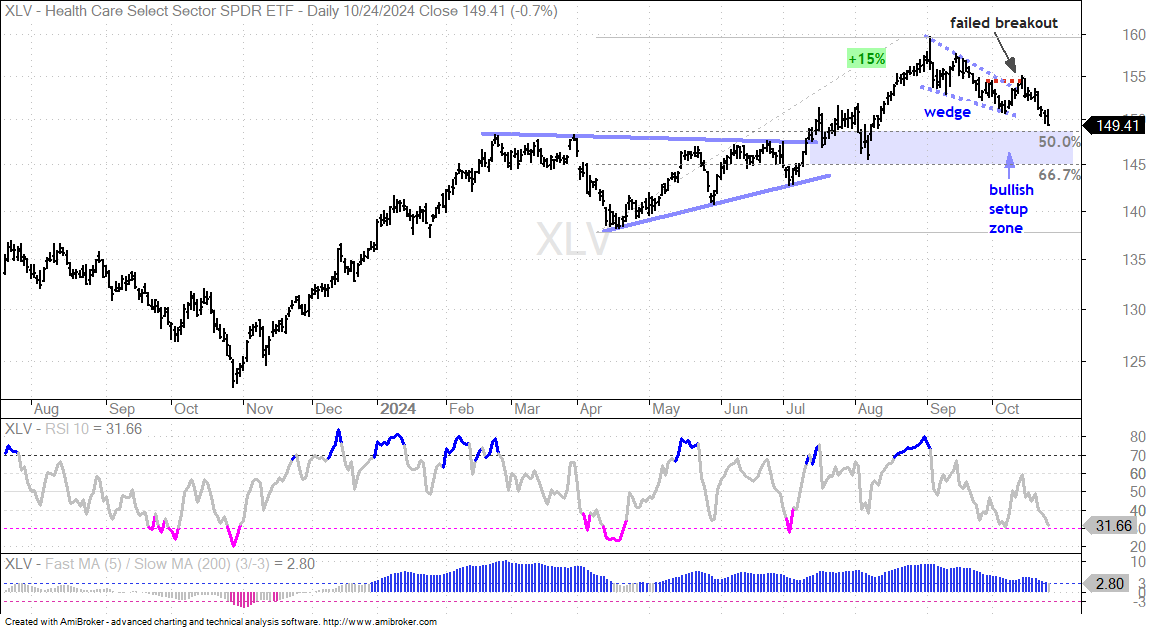
The Healthcare SPDR (XLV) remains in a long-term uptrend with a new high in early September and a bullish 5/200 %Differential. In general, a pullback during an uptrend presents traders with opportunities. I noted such an opportunity last week and XLV broke short-term resistance. The dashed lines show last week’s pattern and resistance level. This breakout did not hold.

Sometimes short-term breakouts do not hold and the corrective period extends. A failed breakout, however, does not alter the long-term trend. XLV remains on my radar because it is correcting within a long-term uptrend. I am marking a new Bullish Setup Zone in the 145-148 area. Here we have broken resistance turning support at 148, the August low marking support at 145 and the 50-67% retracement zone. This is the next area to watch for a tradable pattern.

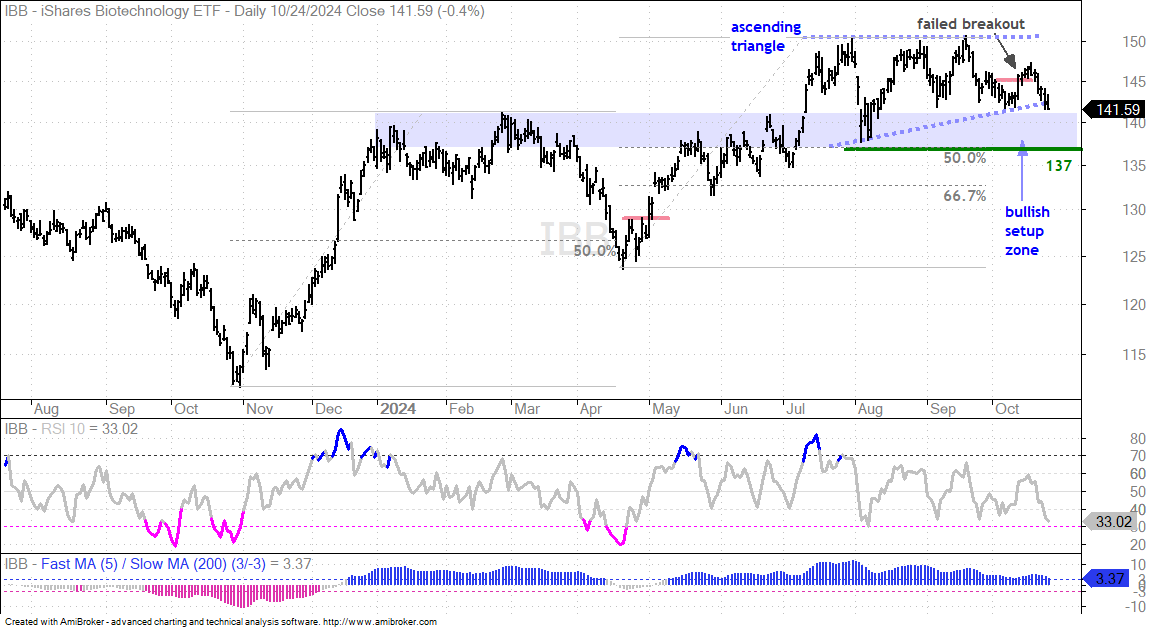
The next chart shows the Biotech ETF (IBB) breaking short-term resistance within a bigger Ascending Triangle. This breakout did not hold as the ETF fell rather sharply this week. Long-term, the trend is still up because IBB hit a new high in July and the 5/200 %Differential remains bullish. I am marking a Bullish Setup Zone in the 137-141 area (blue shading). This zone stems from broken resistance, the August low and the 50% retracement line. 

Copper Pulls Back within Uptrend

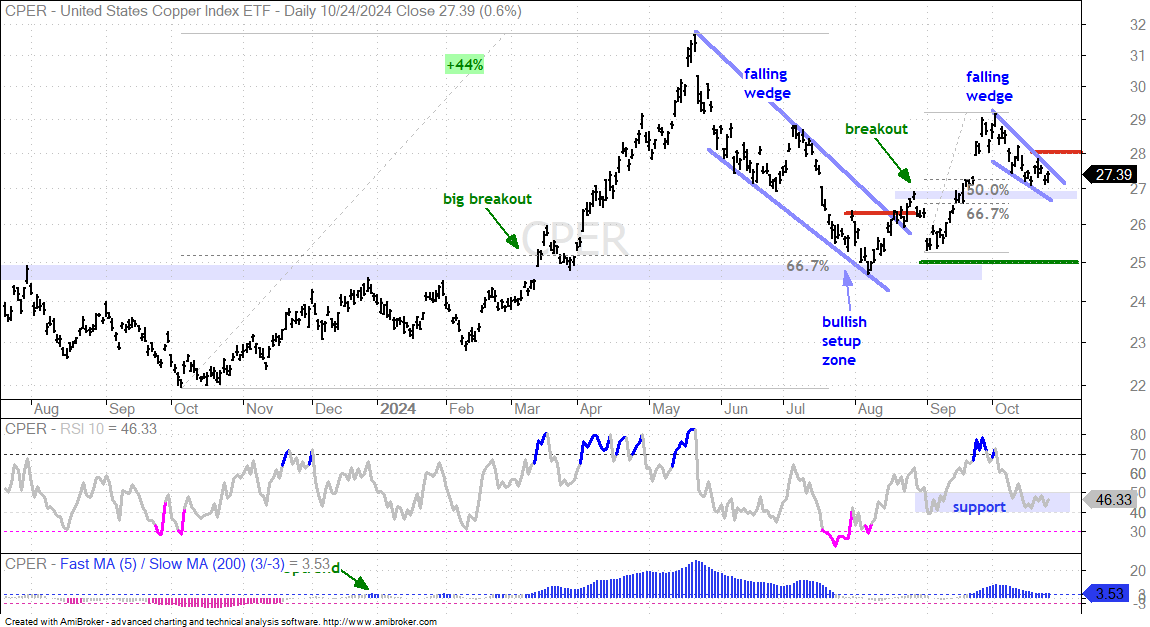
The Copper ETF (CPER) is not as strong as gold and silver, but the long-term trend is up and we have a short-term trading setup. For the long-term trend, the 5/200 %Differential turned bullish with a move above 3% in late December 2023 and we can see a big breakout at 25 in mid March. CPER advanced some 44% and then corrected with a large falling wedge in early August. The ETF broke out in late August and this is the most recent long-term signal.

Short-term, CPER advanced to 29 in September and then fell back here in October with a falling wedge. This wedge retraced 50-67% of the September surge and returned to the August high, which is broken resistance that turns support. Taken together, CPER is trading in a short-term bullish setup zone. In other words, this is a pullback within a bigger uptrend, and an opportunity. Also notice that RSI is trading in the 40-50 zone, which can act as momentum support in an uptrend. I am marking short-term resistance at 28 and a breakout here would be bullish.

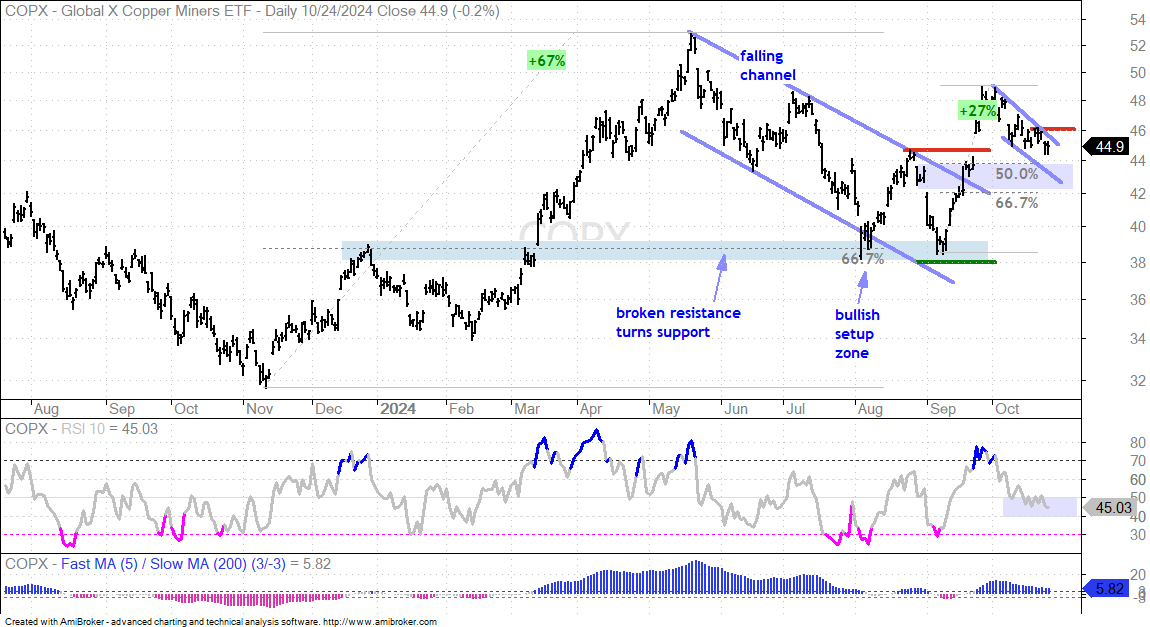
The next chart shows the Copper Miners ETF (COPX) surging 27% in September and then correcting in October. It is worrisome to see copper and copper miners extend their pullbacks when other metals are moving higher. Even so, I view this pullback as a correction after the September surge. COPX is also trading in a Bullish Setup Zone and RSI is in the 40-50 zone. Short-term resistance is set at 46 and a breakout here would be bullish.

DB Base Metals ETF Consolidates after Surge

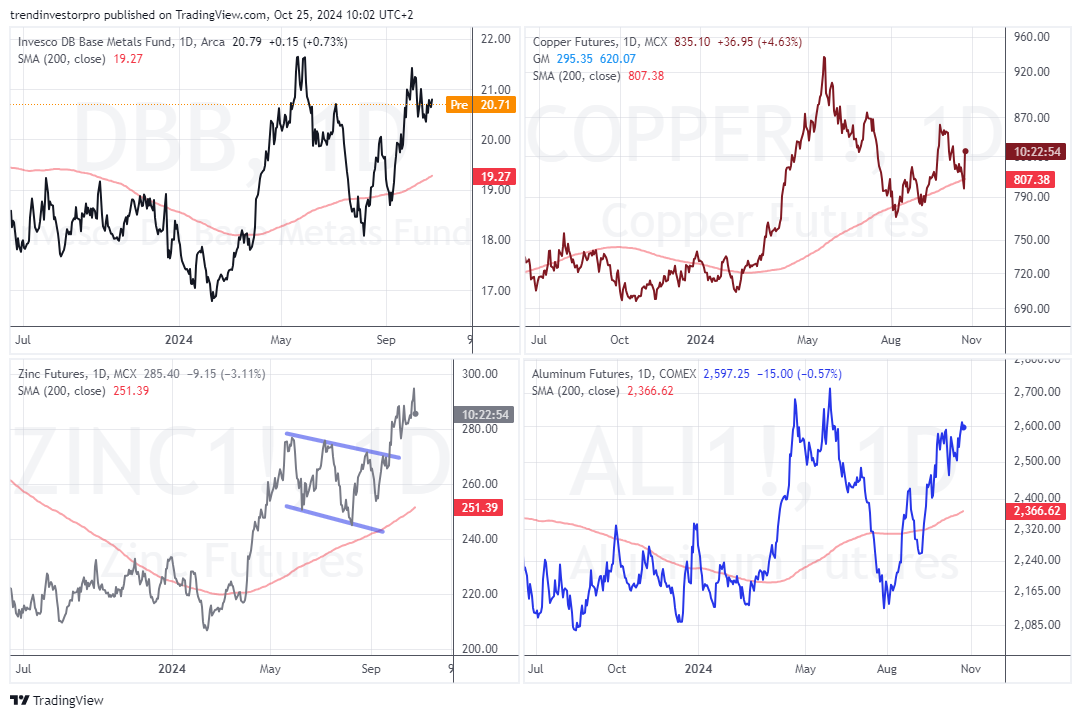
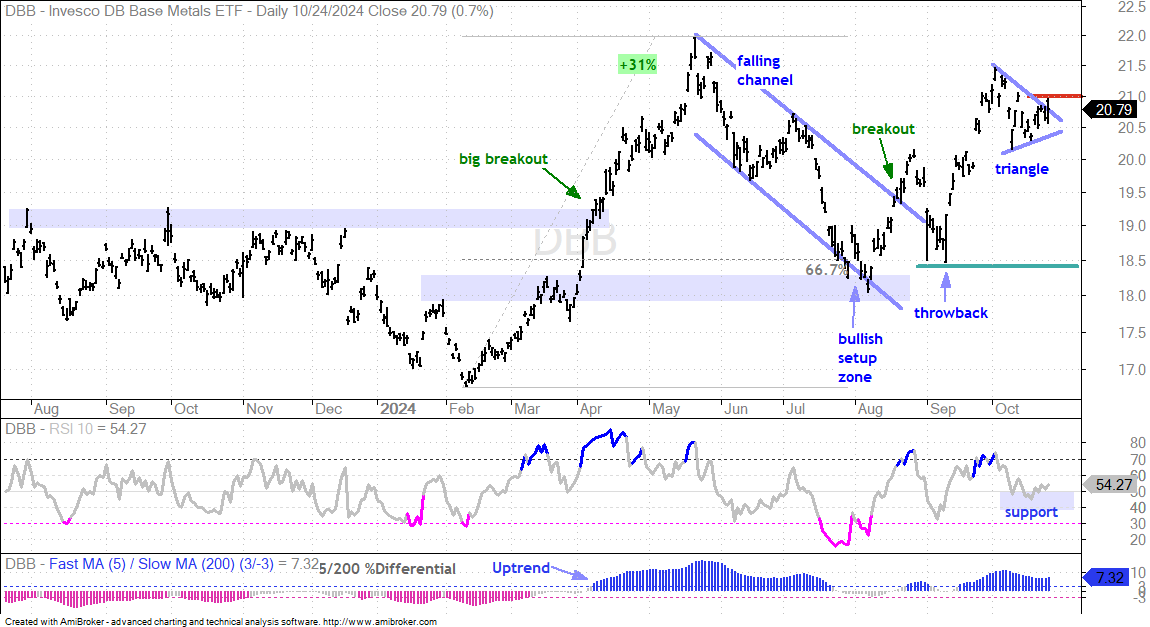
The DB Base Metals ETF (DBB) is equal parts copper, zinc and aluminum. The latter two are doing their part with breakouts and big moves the last two weeks, but copper is dragging its feet. The chart below shows DBB in the upper left and the continuous futures contracts for copper, zinc and aluminum. Copper (upper right) is testing its rising 200-day SMA. Zinc (lower left) broke out in late September and surged into October. Aluminum (lower right) surged to 2600 here in late October.

The next chart shows DBB in a long-term uptrend. The 5/200 %Differential (bottom window) exceeded 3% to turn bullish in early April (bottom window) and there was a big price breakout in mid April. As with CPER, DBB corrected with a falling channel into August and broke out again in September. Most recently, DBB surged above 21 in September and consolidated into October with a pennant (small triangle). This is a short-term continuation pattern and a breakout at 21 would be bullish. The indicator window shows RSI hitting the 40-50 support zone here in October. In a strong uptrend, the 40-50 zone can act as momentum support.

Freeport Returns to the Breakout Zone

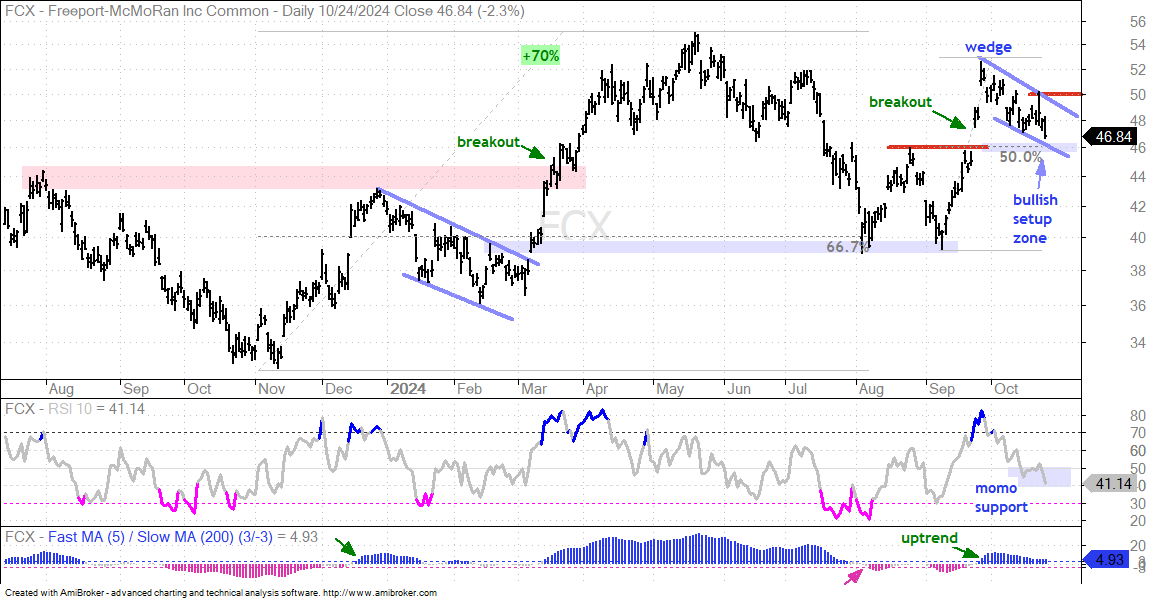
Freeport McMoRan (FCX) is part of the Materials SPDR (XLB) and the Copper Miners ETF (COPX). It derives its revenues from copper (55%), gold (4%), molybdenum (12%) and other byproducts (30%). Thus, it is mostly a play on copper. The long-term trend is rather choppy with big swings in both directions. FCX advanced some 70% from November 2023 to May 2024 and then fell 28%. These big moves triggered trend changes in the 5/200 %Differential as it exceeded +3% in December 2023 and -3% in August 2024. Most recently, it moved back above +3% in late September as the stock broke out with a September surge. Thus, FCX is in a long-term uptrend.

Short-term, I am focused on the September breakout and the return to this breakout zone. Broken resistance turns first support and this is a throwback to the breakout zone. Also notice that this throwback retraced around 50% of the prior advance and RSI moved into the 40-50 zone (momentum support). Taken together, we have a short-term Bullish Setup Zone around 46. The falling wedge defines the short-term downtrend with resistance marked at 50. A breakout here would be bullish and signal a continuation of the September surge. More aggressive traders may look for a close above 49 to trigger a breakout.

Palladium Goes for Big Breakout

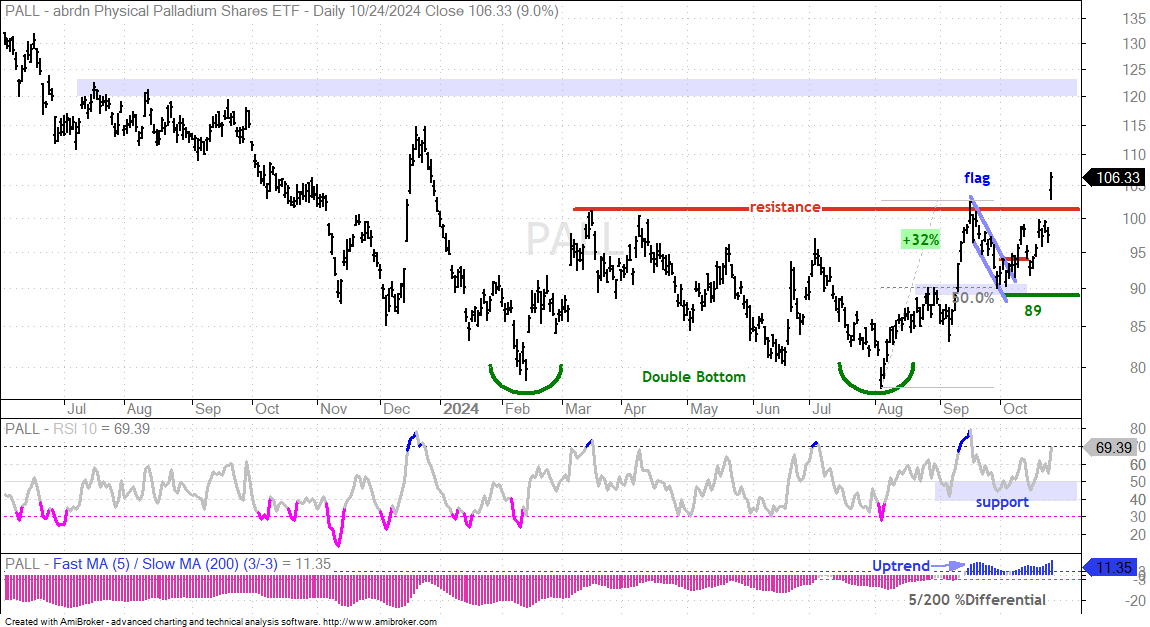
The Palladium ETF (PALL) got a short-term breakout in mid October and a massive double bottom breakout this week. Note that PALL was featured four times since September 19th. Long-term, the trend is up because the 5/200 %Differential exceeded +3% in mid September. Short-term, PALL surged 32% and then corrected with a falling flag into early October. This flag hit a bullish setup zone marked by broken resistance and the 50% retracement. Also notice that RSI was trading in the 40-50 zone (momentum support). PALL broke out in mid October for a short-term signal.

Long-term, a big double bottom formed from February to August. There are two lows just below 80 and resistance just above 100. This is a big base stretching some eight months. I am not a big fan of price targets, but the double bottom breakout projects a move to the low 120s (add the height of the pattern to the breakout). The July-August highs in 2023 also mark potential resistance here. Targets and next resistance are not what’s important here. The big base and long-term breakout are the main events.

GLD Remains Strong and Extended

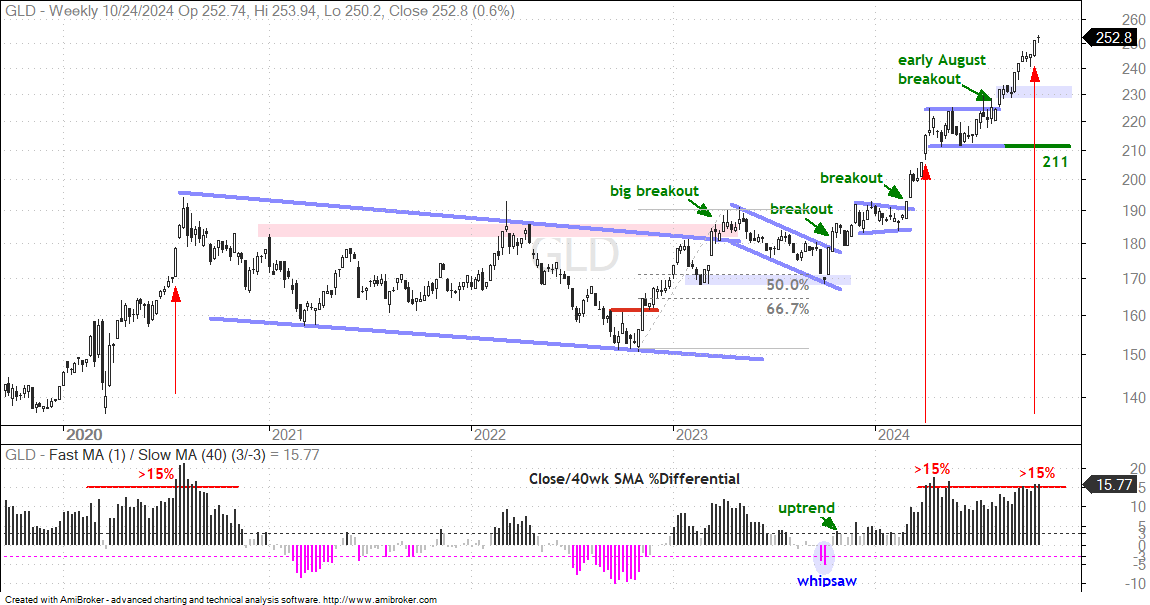
The Gold SPDR (GLD) remains very strong as it extends further on the early August breakout. GLD is up almost 50% since early October, when it was trading around 170. The only concern here is that gold became overbought the last two weeks because it was over 15% above its 40-week SMA. The red arrow-lines show the last three times this occurred. Overbought is not outright bearish, but it increases the odds for a corrective period (pullback or consolidation). First support is set in the 230 area (broken resistance). Key support remains at 211.  

TLT in Downtrend after Channel Break

The 20+ Yr Treasury Bond ETF (TLT) remains bearish. It broke channel support with a sharp decline the last few weeks and is seriously underperforming stocks (RSP). TLT turned bullish with a channel breakout in June and advanced into mid September. A normal pullback turned into a sharp decline and broke rising channel support. Moreover, TLT failed near the December 2023 high (red resistance zone). At best, TLT is in some sort of trading range. At worst, the channel break is bearish and targets a move into the mid 80s (October lows).

Bitcoin Holds its Breakout

Bitcoin broke out of a short-term pennant on October 14th and closed above long-term resistance with follow through the next day. Overall, BTC broke out of a large falling channel and forged a higher high as it broke the September high. The 5/200 %Differential also signaled a new uptrend as it exceeded +3% last week. I am using the closing low of the pennant to mark support at 60000. A close below this level would negate the pennant breakout and call for a re-evaluation.

Thanks for tuning in and have a great day!

Chart Trader Weekly Report – Broad Market Analysis, Leading Groups (ETFs), Chart Setups and Trading Ideas (Premium)

Today’s report starts with signs of broadening participation as mid-caps perk up. SPY hit another new high, but QQQ and semis remain below their summer highs. Large-cap techs are also showing some fatigue. We then compare SOXX and SMH, cover the leading tech ETFs and highlight the breakout in Bitcoin. We finish with two stocks: HPE (data centers) and MLM (construction materials).

Chart Trader Weekly Report – Broad Market Analysis, Leading Groups (ETFs), Chart Setups and Trading Ideas (Premium) Read More »

Chart Trader Weekly Report – Broad Market Analysis, Leading Groups (ETFs), Chart Setups and Trading Ideas (Premium)

Today’s report starts with strong breadth, the plunge in yield spreads and fresh highs in SPY. Tech-related ETFs are leading in October as triangle breakouts extend (QQQ, XLK, MAGS) and new highs are tagged (CIBR, IGV, SKYY, FINX). We then detail setups in the Healthcare (XLV), Palladium (PALL) and Biotech (IBB). Other Symbols Covered: VRTX, AMGN, AKAM and MU.

Chart Trader Weekly Report – Broad Market Analysis, Leading Groups (ETFs), Chart Setups and Trading Ideas (Premium) Read More »

Chart Trader Weekly Report – Broad Market Analysis, Leading Groups (ETFs), Chart Setups and Trading Ideas (Premium)

Today’s report starts with the Composite Breadth Model, yield spreads and the major trends. Tech-related ETFs are perking up with some triangle breakouts (QQQ, XLK, MAGS) and some new highs (CIBR, IGV, SKYY, FINX). We then detail short-term setups in the Healthcare SPDR (XLV) and Palladium ETF (PALL). Other Symbols Covered: ILMN, INCY, NVDA, TSM, AVGO, MRVL

Chart Trader Weekly Report – Broad Market Analysis, Leading Groups (ETFs), Chart Setups and Trading Ideas (Premium) Read More »

Chart Trader Weekly Report – Broad Market Analysis, Leading Groups (ETFs), Chart Setups and Trading Ideas (Premium)

Today’s report starts with the weight of the evidence for stocks. We look at the Composite Breadth Model, yield spreads and the major trends. Attention then turns the patterns in play for XLK, SOXX and MAGS, as well as four tech ETFs hitting new highs. China stole the show last week so we also analyze the China Large-Cap ETF (FXI), copper and base metals.

Chart Trader Weekly Report – Broad Market Analysis, Leading Groups (ETFs), Chart Setups and Trading Ideas (Premium) Read More »

Chart Trader Weekly Report – Broad Market Analysis, Leading Groups (ETFs), Chart Setups and Trading Ideas (Premium)

Today’s report starts with the Composite Breadth Model, yield spreads, SPY and QQQ. We then turn to key levels for tech ETFs and highlight the leaders. Commodity-related ETFs are strong since August and we are seeing breakouts base metals, agriculture and others. This report also features three stocks: two from healthcare and one from defense.

Chart Trader Weekly Report – Broad Market Analysis, Leading Groups (ETFs), Chart Setups and Trading Ideas (Premium) Read More »

Chart Trader Weekly Report – Broad Market Analysis, Leading Groups (ETFs), Chart Setups and Trading Ideas (Premium)

We are still in a bull market, but some risk-on groups are lagging and defensive groups are leading. Interest rate sensitive groups are leading. After hard hits in early September, tech names recovered this week with strong advances. We will put these into context and show key levels to watch (QQQ, XLK, MAGS, SOXX). The other four tech ETFs (IGV, CIBR, SKYY, FINX) are holding up better. This report also cover MSFT, META, QCOM, ARM, DELL, AVGO and NVDA.

Chart Trader Weekly Report – Broad Market Analysis, Leading Groups (ETFs), Chart Setups and Trading Ideas (Premium) Read More »

Chart Trader Weekly Report – Broad Market Analysis, Leading Groups (ETFs), Chart Setups and Trading Ideas (Premium)

Today’s report starts with the CBM and yield spread to define the broad market environment. Despite bull market conditions, odds are increasing for corrective period. We are seeing relative and absolute weakness in key groups, leadership in defensive groups and weak seasonal patterns. GLD and TLT remain strong, while Bitcoin remains weak. We finished with PODD and META.

Chart Trader Weekly Report – Broad Market Analysis, Leading Groups (ETFs), Chart Setups and Trading Ideas (Premium) Read More »

ChartTrader Weekly Report – Market Analysis, Leading Groups (ETFs), Chart Setups and Trading Ideas (Premium)

Today’s report starts with the CBM to define the market. We then address the recent market mood swing as volatility picked up, techs started lagging and defensive groups started leading. Cybersecurity and Fintech are leading within tech and we feature four stocks from these groups. Symbols Covered: XLU, XLP, XLV, XLK, SOXX, CYBR, IGV, FINX, XLRE, ITB, ITA, KIE, IBB, FAN, PBJ, PANW, CYBR, JKHY, PYPL

ChartTrader Weekly Report – Market Analysis, Leading Groups (ETFs), Chart Setups and Trading Ideas (Premium) Read More »

ChartTrader – Broad Breadth Model – SPX-NDX Breadth Model – Yield Spreads (Premium)

This report covers the broad market environment and will be updated every Friday. We start with the breadth models to define the broad market environment (bull market or bear market). The first model covers the broader market, while the second model emphasizes the Nasdaq 100. And finally, we finish with yield spreads to assess conditions in the credit markets.

ChartTrader – Broad Breadth Model – SPX-NDX Breadth Model – Yield Spreads (Premium) Read More »

ChartTrader – Overbought Conditions – Price Surges – Volatility Spikes – SPY, QQQ & MAGS – Key Tech ETFs and Stocks (Premium)

Today’s report starts with short-term overbought conditions, the 12 day surge and the increase in volatility. We then turn to the long-term trends for SPY, QQQ and MAGS. Several tech-related ETFs and tech stocks broke short-term resistance levels and we will set the key levels to watch going forward. Analysis covers SOXX, IGV, CIBR, NVDA, AVGO, AMAT, GOOGL, MSFT and more.

ChartTrader – Overbought Conditions – Price Surges – Volatility Spikes – SPY, QQQ & MAGS – Key Tech ETFs and Stocks (Premium) Read More »

ChartTrader – Healthcare and Biotech Continue to Lead – Three Healthcare Stocks with Breakouts  (Premium)

This report starts with the leaders over the last ten days and the leaders based on 52-week highs. Large-cap tech stocks led the 10-day surge, but Healthcare, Consumer Staples and Biotech are leading on charts. We then analyze the Healthcare SPDR, Biotech ETF and three Healthcare stocks (CAH, INCY, ILMN)

ChartTrader – Healthcare and Biotech Continue to Lead – Three Healthcare Stocks with Breakouts  (Premium) Read More »

ChartTrader – Healthcare Sector Leads – 3 Healthcare Breakouts – GOOGL, MSFT and Six Tech ETFs Test Key SMAs (Premium)

This report starts with the Healthcare SPDR because it is one of the leading sectors right now. Also notice that the Consumer Staples SPDR, Utilities SPDR and Real Estate SPDR are also leading with new highs this week. Leadership from the defensive sectors points to some risk

ChartTrader – Healthcare Sector Leads – 3 Healthcare Breakouts – GOOGL, MSFT and Six Tech ETFs Test Key SMAs (Premium) Read More »

ChartTrader – Nikkei Unwind – SPY/QQQ/MAGS Corrections – VIX – Symbols: NVDA, AVGO, GEHC, ABT (Premium)

This report starts a long-term look at the Nikkei, which started breaking down in July. US stocks rebounded after sharp declines on August 5th, but they have yet to fully recover and remain in short-term downtrends. We will look at the corrections in SPY, QQQ and MAGS.

ChartTrader – Nikkei Unwind – SPY/QQQ/MAGS Corrections – VIX – Symbols: NVDA, AVGO, GEHC, ABT (Premium) Read More »

ChartTrader – VIX and Yield Spreads Surge – Correlations on Rise – A Canary for SPY – TLT Holds Breakout (Premium)

Increasing uncertainty is causing the markets to reprice. SPY, QQQ and IWM hit new highs in July and were priced for the best of all worlds. We then got a shakeup in the presidential race, a weak jobs report and a route in the Nikkei. Markets do not like uncertainty and

ChartTrader – VIX and Yield Spreads Surge – Correlations on Rise – A Canary for SPY – TLT Holds Breakout (Premium) Read More »

ChartTrader – VIX Spike – NDX Breadth Deteriorates – Short-term Breadth Not Yet Oversold – SPY Downside Target (Premium)

Selling pressure broadened over the last three days with the broader market (S&P 500 stocks) joining tech-related stocks (Nasdaq 100 stocks) in the sell off. The long-term trends are still up for SPY and QQQ. In addition, the Composite Breadth Model and the SPX-NDX Breadth model remain

ChartTrader – VIX Spike – NDX Breadth Deteriorates – Short-term Breadth Not Yet Oversold – SPY Downside Target (Premium) Read More »

ChartTrader – SPY and QQQ Pop – Cybersecurity and Software Pullback – SOXX Surges – Symbols: CIBR, IGV, PANW, CPER, TLT, STLD (Premium)

This report starts with the short-term breakouts in SPY and QQQ. Battered semiconductor stocks led the surge and we will look at the Semiconductor ETF today. We also cover the Software and Cybersecurity ETFs, which represent

ChartTrader – SPY and QQQ Pop – Cybersecurity and Software Pullback – SOXX Surges – Symbols: CIBR, IGV, PANW, CPER, TLT, STLD (Premium) Read More »

ChartTrader – Bull Market – Not Yet Oversold – Mid and Small Breakouts – Corrections AI Stocks: NVDA, DELL, AVGO, QCOM, PSTG, MU (Premium)

This report starts with the long-term breadth indicators to confirm the bull market. Overall, S&P 500 stocks are stronger than Nasdaq 100 stocks. SPY and QQQ are in the midst of pullbacks and have yet to become oversold. Thus, they could have further to go before bouncing. We will then update the breakouts in

ChartTrader – Bull Market – Not Yet Oversold – Mid and Small Breakouts – Corrections AI Stocks: NVDA, DELL, AVGO, QCOM, PSTG, MU (Premium) Read More »

ChartTrader – Long-term QQQ – Seasonals for SPX – Defensive Groups Lead – Symbols: RSP, MDY, IWM, XLU, XLV, IHI, JNJ, JKHY (Premium)

This report starts with a long-term look at the QQQ chart and the seasonality pattern for the S&P 500. Earnings season is in full gear, but the reactions to these reports is decidedly negative. SPY is in

ChartTrader – Long-term QQQ – Seasonals for SPX – Defensive Groups Lead – Symbols: RSP, MDY, IWM, XLU, XLV, IHI, JNJ, JKHY (Premium) Read More »

ChartTrader – Plenty of Stocks Above 200-day – Next Support for XLK/MAGS – Symbols: XLI, XLF, XLY, XLV, IPAY, FINX, PAVE, ITB (Premium)

This report starts with the long-term breadth indicators to confirm the bull market. Overall, S&P 500 stocks are stronger than Nasdaq 100 stocks. Our short-term breadth indicators are also bullish. QQQ is in the midst of a pullback and has yet to become

ChartTrader – Plenty of Stocks Above 200-day – Next Support for XLK/MAGS – Symbols: XLI, XLF, XLY, XLV, IPAY, FINX, PAVE, ITB (Premium) Read More »

ChartTrader – Perspective on Small-cap Breadth Surge, MAGS/XLK Go the Other Way – Symbols: KRE, FINX, IPAY and 12 Stocks (Premium)

This report starts with the big breadth surge in small-caps. We put this surge into perspective and show what it means going forward. The surge in small-caps, however, was offset with outsized declines in large-cap tech stocks. We will show charts for MAGS and XLK

ChartTrader – Perspective on Small-cap Breadth Surge, MAGS/XLK Go the Other Way – Symbols: KRE, FINX, IPAY and 12 Stocks (Premium) Read More »

Scroll to Top