The broad market index ETFs remain in steady uptrends, but volatility ticked up after the down gaps on May 11th. The bar chart shows the S&P 500 Equal-weight ETF (RSP) in a steady uptrend since December with the rising 50-day SMA holding on each pullback. RSP is a great barometer for the overall stock market because it weights the S&P 500 equally. The blue squares show prior tests of the 50-day SMA when volatility picked up. Rising volatility is more negative than positive, but it does not always result in a trend reversal. The candlestick chart shows a gap down on May 11th and this gap held (red shading). RSP also gapped down on Wednesday. Even though the ETF closed on the high of the day, the gap remains and short-term price action is more negative than positive.
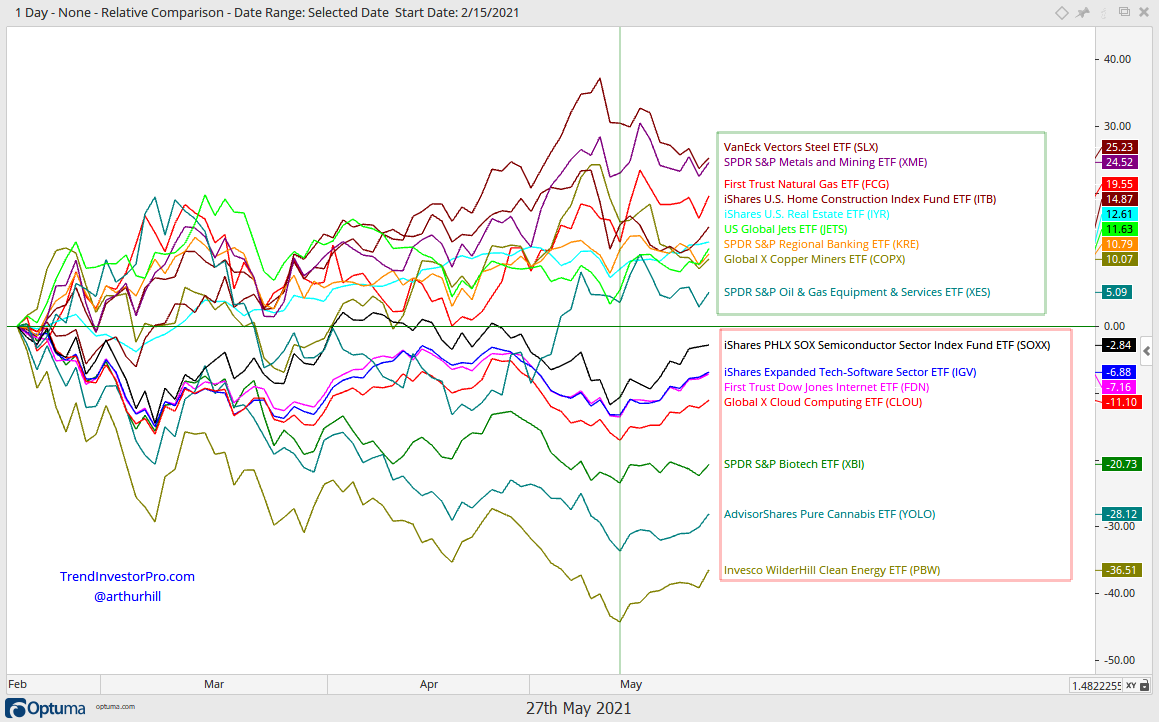
The green line is at May 13th and this marks a recent performance. Notice that the laggards since mid February are leading since mid May. The lines in the bottom half of this chart are rising since May 13th and the lines in the top half are falling or flat. It is too early to tell if this shift has legs, but we are seeing short-term strength in tech, biotech, clean energy and cannabis.
S&P 500 Rolls with the Changes
These rotations mean we are seeing rolling corrections within the S&P 500 and the index is handling them quite well. You would never know that Semis and Software are down since February by looking at the SPY chart. SPY maintained its tight rising channel throughout the corrective process, as did the S&P 500 EW ETF (RSP). The middle line is a linear regression, the upper line is two standard deviations above and the lower line is 2.5 standard deviations below. Declines need a little more wiggle room. Also notice that the 50-day SMA is in this area and SPY bounced after each dip below the 50-day. While I see some short-term volatility and choppy trading since the early May gap (red shading), the overall trend is up for SPY.
You can learn more about my chart strategy in this article covering the different timeframes, chart settings, StochClose, RSI and StochRSI.
New High in Late May (Closing Prices), Leading
XLV, XLRE, IYR, REZ, ITA, INDA, RSX
The Healthcare SPDR (XLV) is leading the stock market because it recorded a new 52-week high on Friday. XLV also shows why I try to avoid ratio charts. The upper left window shows XLV (black line) and the XLV:SPY ratio (gray line). This ratio chart has been working its way lower for a year. Meanwhile, XLV has been working its way higher and the price chart is nothing but bullish. Ratio charts measure relative performance, but they tell you nothing about absolute performance and do not reflect the price trend. XLV is one of the best performing sectors over the last 50 days, which is when it broke out of a falling channel. Chartists focused on the XLV:SPY ratio would have missed this bullish setup and big move. I do not see a setup on the chart right now, but XLV is clearly a leader because it is recording new highs.
I am also seeing short-term breakouts and leadership in the Real Estate SPDR (XLRE), Residential REIT ETF (REZ) and Communication Services SPDR (XLC). All three broke out of falling flag patterns the last few days. XLRE and REZ hit new highs this week, and XLC is close to a new high. The Utilities SPDR (XLU) is also on the chart below, but it did not hold its breakout. XLU is, however, near the rising 50-day SMA and RSI is in the oversold zone.
New High in May, Short-term Pennant/Flag
XLC, XLF, XLI, XLP, XLE, XLB, XME
There are quite a few flags, pennants and small wedges here in May. This is unsurprising because the broader market has pretty much traded flat or down in May. Personally, flags and pennants that extend two to three weeks are a bit too short-term for my taste because the chances of whipsaw are above average. The charts below show that the Finance SPDR (XLF), Materials SPDR (XLB) and Consumer Staples SPDR (XLP) did not even become short-term oversold here in May. Thus, there was no real pullback. RSI did dip below 50 for XLI as it turned blue for a day on May 12th. Again, this is a very mild oversold condition. All four are in long-term uptrends.
The Metals & Mining SPDR (XME) chart below highlights the short-term conundrum in many ETFs right now. XME is leading with an uptrend and new high last week. A pennant is forming over the last 2-3 weeks, but the ETF gapped down last Wednesday and this gap is holding. Short-term price action is quite choppy and this increase the chances of whipsaw for short-term traders (those playing flag/pennant breakouts).
You can learn more about ATR Trailing stops in this post, which includes a video and charting option for everyone.
Holding Triangle Breakout
KRE
The Regional Bank ETF (KRE) continues to hold its triangle breakout and the rising 50-day SMA. Price action is pretty flat since the breakout because follow through was muted. Nevertheless, the breakout is holding, as is the ATR Trailing Stop. The candlestick chart shows that the breakout zone turned into support and a move below the mid May low would negate the breakout.
You can learn more the StochClose indicator and strategies in this post.
Oversold Bounce off 50-day SMA
ITB, XHB, IHI
The Home Construction ETF (ITB) found its footing late last week and bounced off the 50-day SMA this week. Notice that the decline retraced around half of the March-May advance, price dipped below the 50-day SMA and RSI dipped below 50 twice. ITB moved back above the 50-day SMA on Wednesday and RSI is back above 50. The candlestick chart shows StochRSI popping above .80 and ITB filling last week’s gap down with a bounce. The first re-evaluation level is set at 69.
The Medical Devices ETF (IHI) chart is similar to ITB, but it surged back above its 50-day SMA a week earlier. IHI fell back to the breakout zone on Wednesday and this is the first area to watch for support. A strong breakout should hold and prices should continue higher. A close below 340 would put prices below the breakout zone and question its validity.
Falling Wedge Breakout
JETS
The Airline ETF (JETS) broke out of a falling wedge two weeks ago, fell back and moved back above the breakout zone. This falling wedge extended nine to ten weeks and retraced 50-67 percent of the prior advance. This makes it a medium-term correction within a long-term uptrend. Here is an article/video to learn more about falling wedges. The breakout signals an end to this correction and a resumption of the bigger uptrend. This breakout is also holding for the most part. The red line marks the ATR Trailing Stop (2 x ATR(22)) and the brown line marks a wider stop (3 x ATR(22)). With the highest close since late April, I would tighten the stop a little and re-evaluate on a close below 25.50.
Wedge Breakouts in Early May
XLE, XES, XOP, FCG
The energy-related ETFs are holding up for the most part. All four broke out of falling wedge patterns in early May. The Energy SPDR (XLE) and Natural Gas ETF (FCG) hit new highs after the breakout, but the Oil & Gas Equipment & Services ETF (XES) and Oil & Gas Exploration & Production ETF (XOP) remain short of their March highs. XLE triggered its ATR Trailing Stop on Tuesday, but the other three are holding.
RSI Oversold and/or Testing 50-day
COPX, SLX, WOOD, DBA
There are short-term oversold setups in the Copper Miners ETF (COPX), Steel ETF (SLX), Global Timber Forestry ETF (WOOD) and DB Agriculture ETF (DBA). All four are commodity-related and all four hit new highs earlier this month. They fell back the last three weeks and RSI dipped into the oversold zone (30-50). Note that RSI turns blue when it dips into this zone. COPX and WOOD are also at their 50-day SMAs. This is pretty short-term stuff so keep your preferred timeframe in mind and plan that trade. The red lines mark Tuesday’s highs and breaks above these levels would argue for an oversold bounce.
Uptrends and Short-term Breakouts
QQQ, XLK, XLY
QQQ is in an uptrend with wider swings than SPY, which makes sense because QQQ is more volatile than SPY. QQQ hit new highs in February and April, and dipped well below the 50-day SMA after these new highs. Most recently, QQQ retraced 50-67 percent of the prior advance with a dip to the 316 area. This retracement amount is normal for a pullback within a bigger uptrend and QQQ broke short-term resistance with a surge last week. This breakout is holding, as did last Thursday’s gap. Thus, bullish. The red line on the bar chart shows the ATR Trailing Stop at 323.58 (2 x ATR(22)). Again, a strong breakout should hold. A close below 323.58 would signal a failed breakout and warrant a re-evaluation.
Uptrend with Widening Swings, Short-term Breakout
SOXX, IPAY, FIVG
The Semiconductor ETF (SOXX) hit a new high in April and then fell pretty hard into mid May. The ETF managed to hold above its early March low, firm and break short-term resistance with a surge last week. The breakout occurred with a gap and this gap/breakout is holding. The red line marks the ATR Trailing Stop at 405.63 and a close below this level would also fill the gap. This would question the underlying strength behind the breakout and call for a re-evaluation.
The next chart shows the Mobile Payments ETF (IPAY) with a similar setup: new high in late April and sharp decline into mid May. IPAY found support near the prior lows, firmed for a week and broke out with a surge last week. The breakout is holding and bullish until proven otherwise. The red line on the bar chart marks the ATR Trailing Stop for reference.
Small-caps Continue to Stall
IJR, IWM
SPY hit a new high in May, QQQ hit a new high in April and IJR hit a new high in March (50 days ago). SPY is the strongest of the three and IJR/IWM are the weakest. The IJR chart is not exactly bearish because the ETF is consolidating after a 70+ percent advance. Price action within the consolidation is quite choppy, which is what makes this a consolidation. Technically, a break above the May 10th high would end this consolidation and signal a continuation of the bigger uptrend. As long as prices remain stuck in this range, there is nothing to do but sit and wait.
Short-term Breakout with Multi-month Trading Range
CARZ, DRIV, IDRV, BETZ
The Global Auto ETF (CARZ), Autonomous EV ETF (DRIV), Self-Driving EV Tech ETF (IDRV) and Sports Betting iGaming ETF (BETZ) turned up the last two weeks and broke short-term resistance levels. These breakouts occurred within bigger consolidations. The bigger consolidation is a bullish continuation pattern because it represents a rest within the bigger uptrend. The recent breakouts reversed the downswing within these patterns and increases the odds for a bigger breakout. The red lines show the ATR Trailing Stops for reference.
Big Triangle Consolidation, Short-term Breakout
IGV, SMH, FDN, CIBR
These four tech-related ETFs show classic examples of trading the swing within a pattern (see this video for details). These ETFs formed lower highs from February to April and higher lows from March to May. Connecting these peaks and troughs with a trendline reveals large triangle consolidation patterns, which are bullish continuation patterns because the long-term trends are up. The swing within these patterns was down from late April to early May. All four firmed for a week and then broke short-term resistance with gaps last week. These gaps held and there was some follow through this week. The first chart shows IGV with the gap zone turning into first support. The ATR Trailing Stop (2 x ATR(22)) at 343.89 and in the gap zone so I would just use the gap zone and re-evaluate with a close below 342.
Bouncing off 200-day and Key Retracement
IBB
The Biotech ETF (IBB) bounced off a support zone marked by the rising 200-day SMA, broken resistance and the 67% retracement. The bounce over the last three weeks is the fourth attempt to hold this zone. There is some concern here because IBB exceeded the April lows in May and then bounced. The candlestick chart shows this bounce retracing around 67% of the prior decline and forming a rising wedge. The short-term trend is up as long as the wedge rises and this is net positive for the latest bounce. A move below 147.5 would break wedge support and argue for a continuation lower.
Broke 200-day and/or March Lows
The laggards bounced over the last two weeks. They are still lagging over the last three months, but they are leading short-term. These bounces, however, are coming from lower lows as all of the ETFs broke their April lows in May. Some are even below their 200-day SMAs (PBW, TAN, XBI, ARKK, ARKG). I narrow my universe by focusing on the stronger charts and avoiding the weaker charts. For example, IGV, FDN and CIBR held their March lows and have better looking charts. ETFs in the list below have the weaker charts right now and I do not see any setups right now.
")