Stocks closed weak on Tuesday and are set to open lower on Wednesday, which means the corrective process is set to continue. It is still a bull market according to the Composite Breadth Model and the weight of the evidence, but the near-term picture is looking shaky with QQQ struggling and small-caps underperforming. We are also in a seasonally weak period (May-June).
Stocks were up sharply from late October to mid February with several key groups recording new highs to confirm broad market strength. The new high parade started to dwindle with several tech-related ETFs peaking in mid February, the Russell 2000 ETF peaking in mid March, SMH peaking in early April, QQQ peaking in mid April and SPY hitting a new high on May 7th. The call here is not for a bear market, but rather a corrective period that could lead to lower prices and/or choppy trading in the coming weeks, perhaps months.
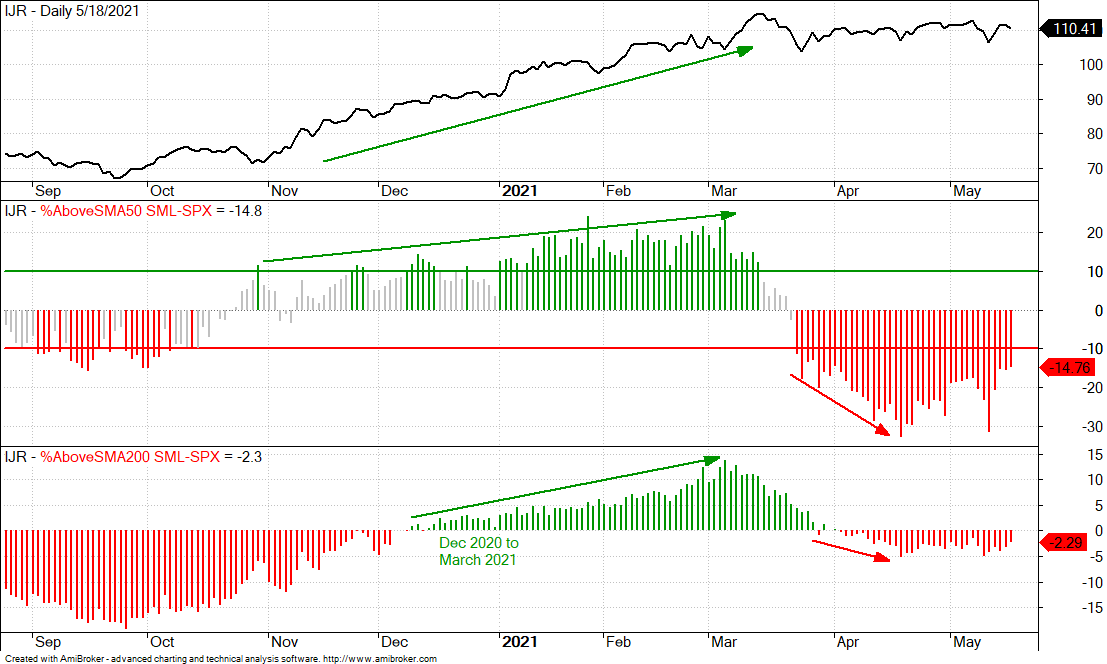
Small-cap Breadth Lags Large-cap Breadth
The chart below shows the S&P SmallCap 600 SPDR (IJR) in the top window and the difference between two breadth indicators: SML %Above 200-day less SPX %Above 200-day and SML %Above 50-day less SPX %Above 50-day. This shows small-cap breadth relative to large-cap breadth. Notice that SML %Above 50-day SMA was consistently higher than SPX %Above 50-day SMA from late October to mid March (green arrow) and then turned negative in late March. This means there are fewer small-cap stocks above their 50-day SMAs than large-cap stocks. The bottom window shows the differential for %Above 200-day and it turned negative in April. These indicators show small-caps lagging large-caps overall. The chart below is linked to a SharpChart from StockCharts that uses EMAs instead of SMAs. I prefer SMAs because they are smoother and generate fewer whipsaws.
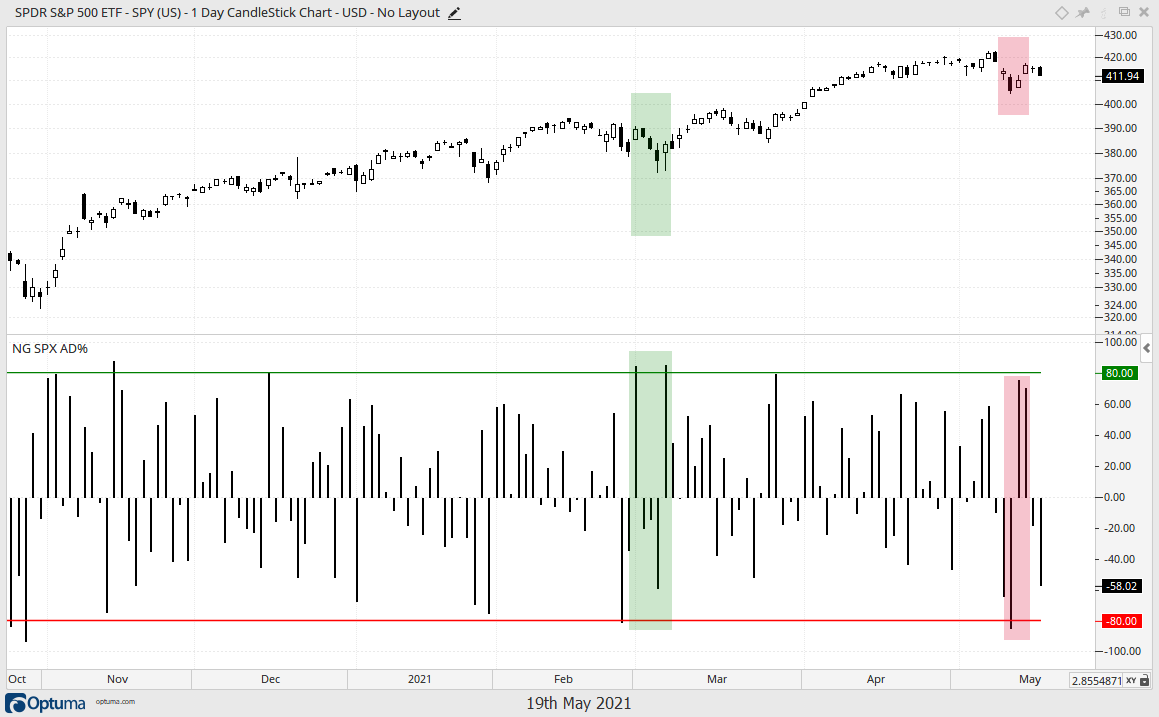
90% Down Day for S&P 500
The next chart shows S&P 500 Advance-Decline Percent, which is advances less declines divided by total issues. A move above +80% means more than 90% of S&P 500 stocks advanced, while a move below -80% means more than 90% declined. The green shading shows two surges above +80% and these occurred after a plunge below -80%. This strong rebound foreshadowed the March-April advance. The red shading shows a plunge below -80% last Wednesday and two big up days that did not exceed +80%. The Thursday-Friday rebound was not quite a strong as fewer stocks participated.
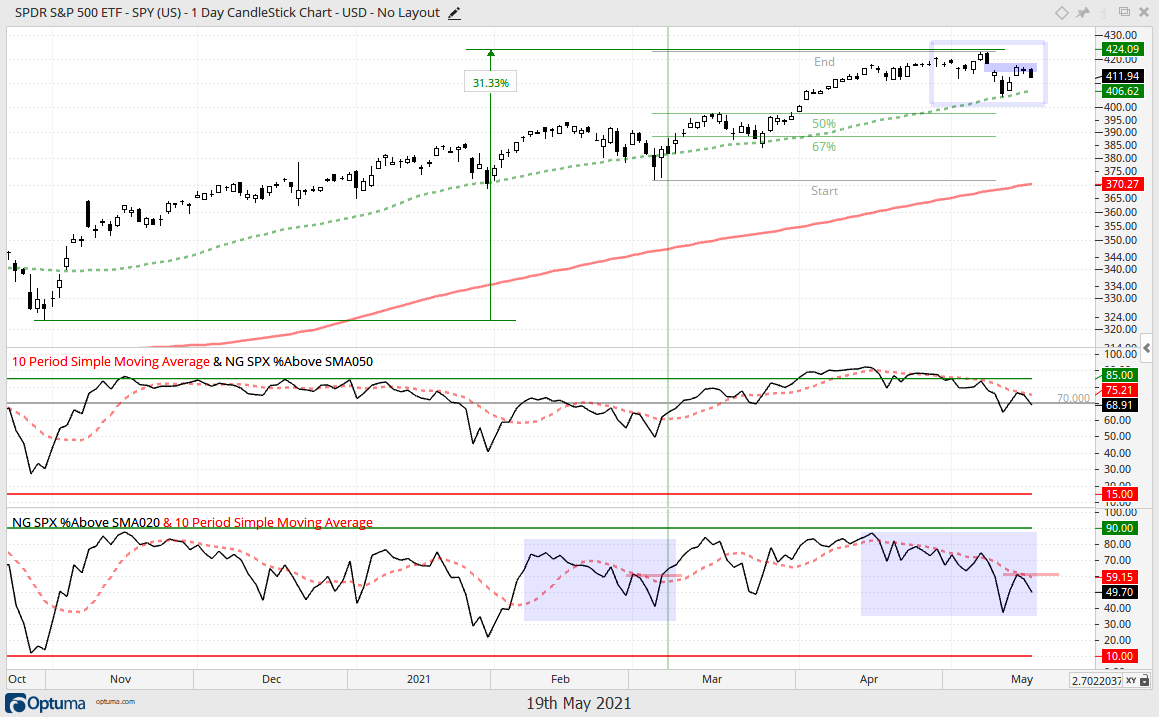
SPY Hits Gap Resistance
The next chart shows SPY testing its rising 50-day SMA with a sharp decline last week, rebounding on Thursday-Friday and stalling Monday-Tuesday. SPY gapped down last Tuesday and is now meeting resistance in this gap zone. SPY was up some 31% from late October to early May and a correction at this stage would be pretty normal. A 50-67% retracement of the March-May advance would extend to the 390-395 area, which would mark a very modest correction. Take any kind of price targets with skepticism and instead focus on evolving price action.
The middle window shows SPX %Above 50-day SMA with the gray line at 70%. SPY often struggles when this indicator is falling and below 70%, which it is now. The bottom window shows SPX %Above 20-day SMA falling since mid April and dipping below 40% last week. This indicator is still falling and needs to break 60% to reverse the fall. There was a similar decline/breakout in February.
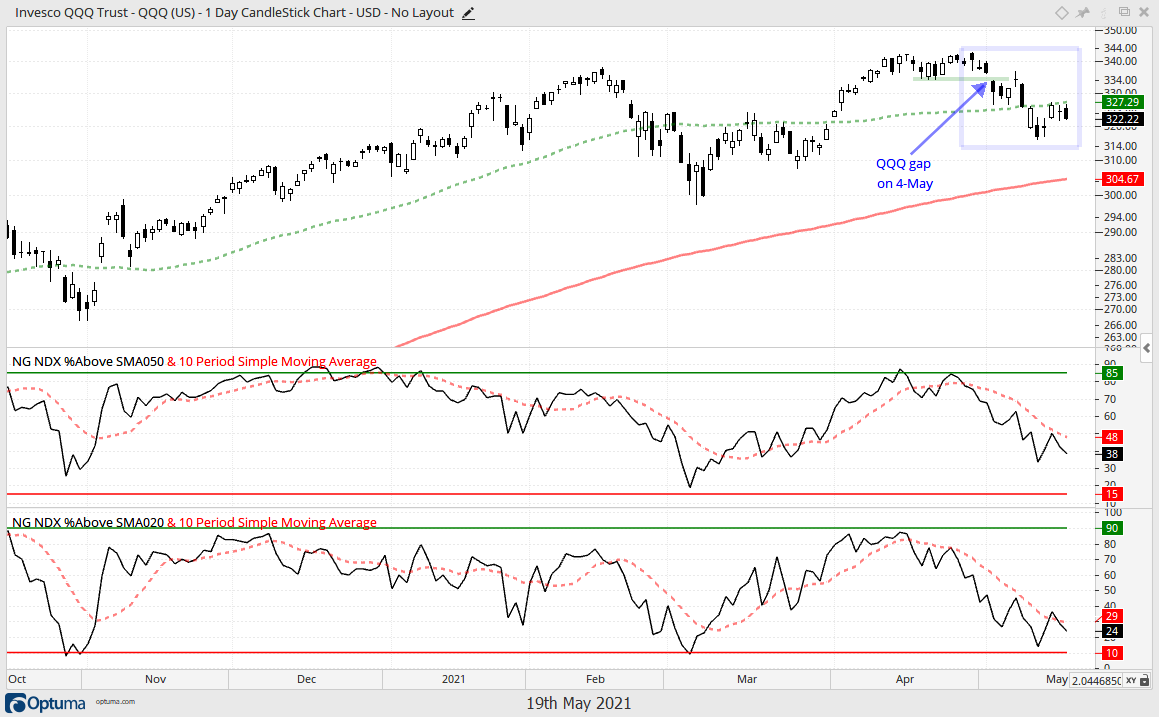
QQQ Fails to Reclaim 50-day
The next chart shows QQQ struggling as it failed to get back above its 50-day SMA. The ETF gapped down on May 4th (breakaway gap), failed in the gap zone with the bounce on May 7th and fell below the 50-day. The long-term trend is up, but QQQ is underperforming SPY this month and its components account for a large portion of the S&P 500.
Corrections are like a box of chocolates: you never know what you are going to get. Some are short and sharp, some are relatively flat and extended, and some are a mix. In general, correlations tend to rise when the S&P 500 weakens. This means most stock-related ETFs and stocks will be susceptible to broad market pressure. At this stage, broad market weakness is considered a correction as long as the market regime remains bullish.
")