This commentary will look at this historic advance in the S&P 500, and them some less historic charts for oil, gold, silver, bonds and the Dollar. The 14-month gain in the S&P 500 is the largest in over 70 years. Oil is still challenging resistance as a bullish cup-with-handle forms. Gold remains in the midst of a strong advance as silver forms a bullish pennant. Treasury bonds are best avoided because they are tainted and the Dollar is in a clear downtrend.
SPY Surpasses Gains off 2009 Low
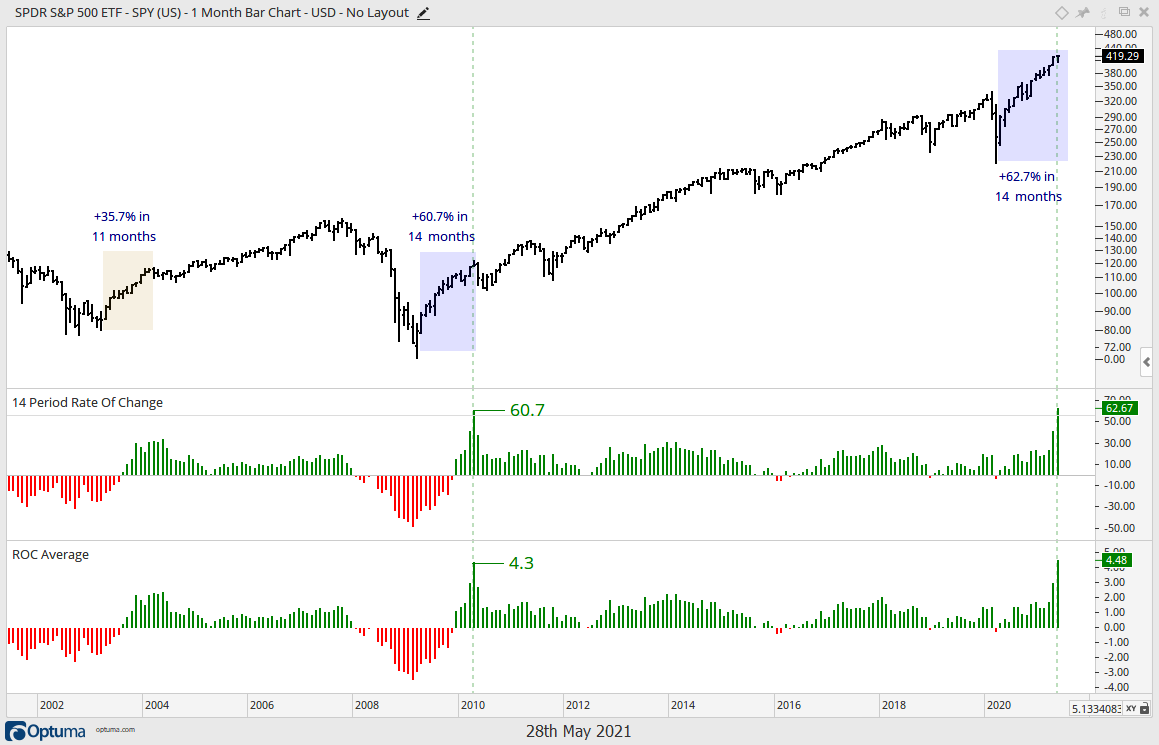
Even though there is still one more trading day in May, the S&P 500 SPDR (SPY) is on course to surpass the gains seen off the February 2009 closing low. The chart below shows monthly bars, the 14-month Rate-of-Change and the average monthly change for those 14 months. SPY is currently up 62.7% in 14 months and this eclipses the 60.7% gain seen from March 2009 until April 2010. The average monthly gain is currently 4.48% and this is higher than the average monthly gain in April 2010, which was 4.3%. Looking back to the 2002 low, SPY was up 35.73% in 11 months from April 2003 to February 2004.
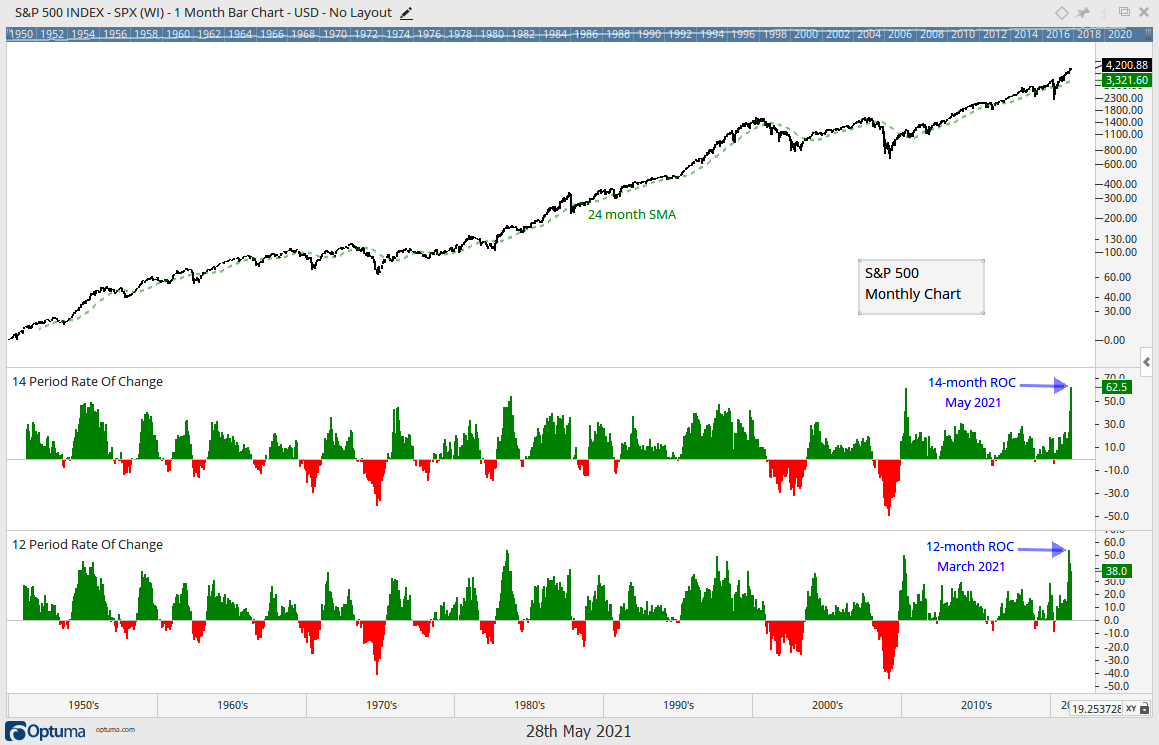
The purpose of this exercise is to put the current gains into perspective. These big gains to not point to a major top or a reason to turn bearish. SPY and SPX are quite extended, but the current trend is up and SPY is very close to a new high. Using the S&P 500 (below), the current 14-month advance is the largest in over 70 years. I have 12 and 14 month Rate-of-Change data for the S&P 500 back to January 1951. The 12-month advance from April 2020 to March 2021 was 53.71% and this is also the single largest 12-month advance since 1951.
Oil Forms Bullish Pattern
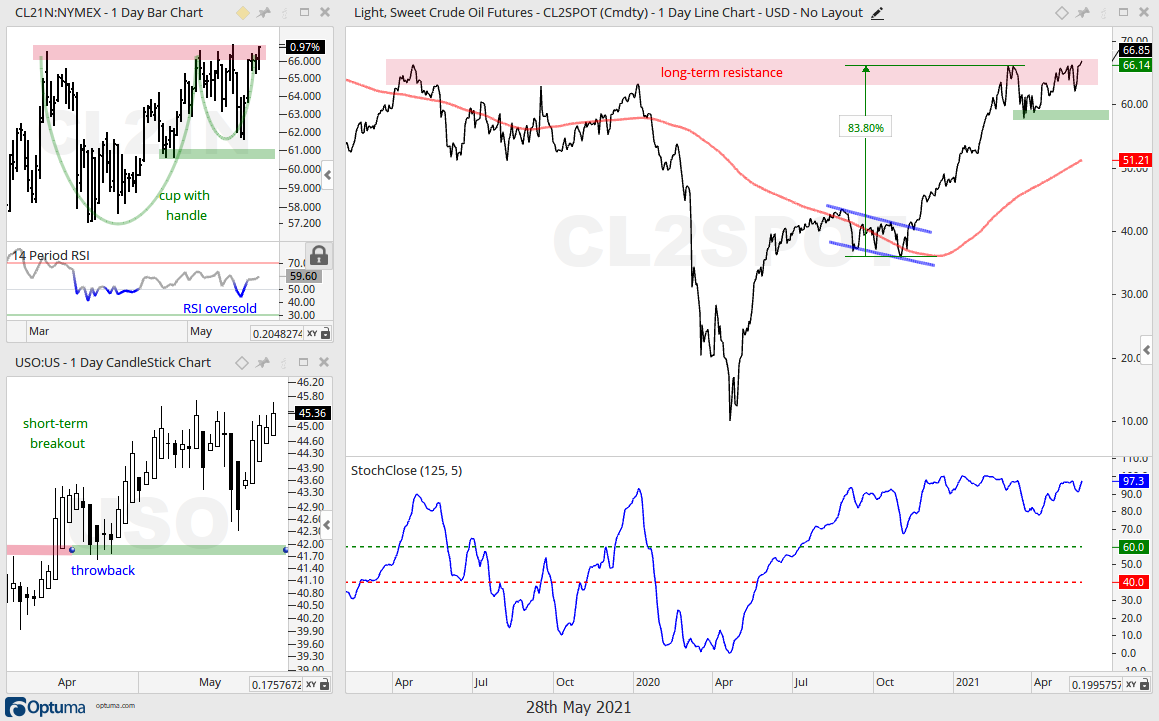
The long-term trend for oil remains up and resistance is nigh, but oil remains strong and a bullish cup-with-handle pattern formed. The upper left chart shows bars for NYMEX Crude Futures (July 2021), which is the purest play on oil. The green lines show the cup-with-handle and the red shading marks rim resistance. This is a bullish continuation pattern and a breakout would argue for a move towards the upper 70s.
Gold Extends above 200-day
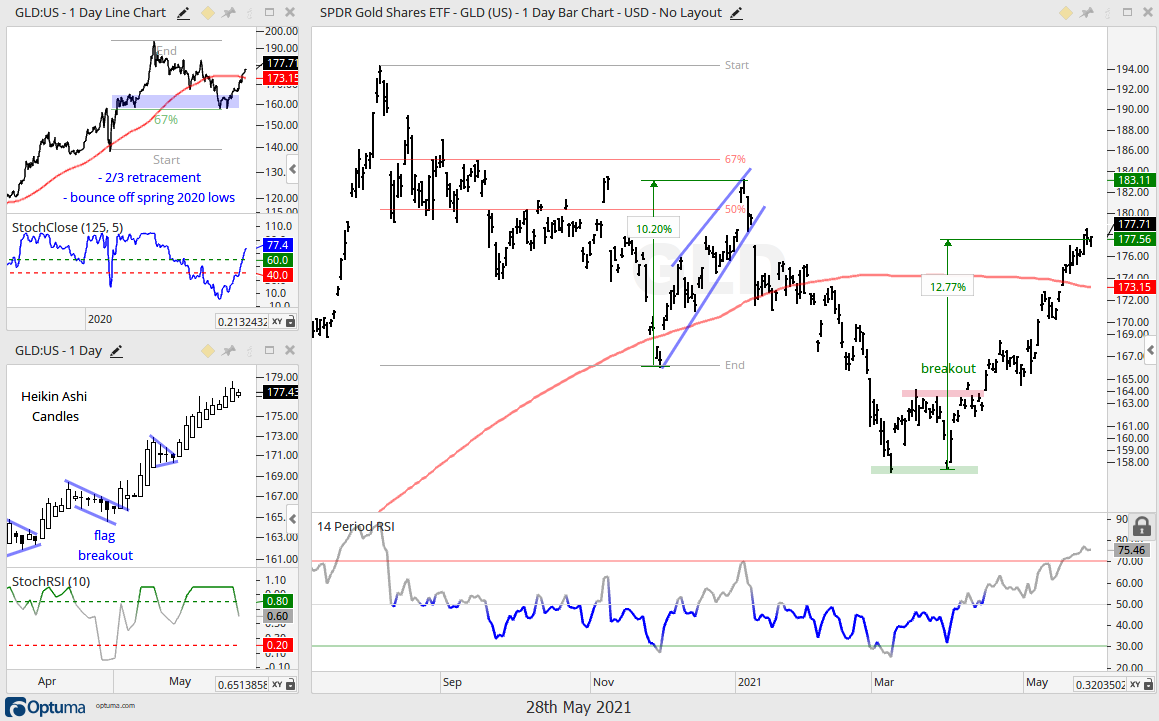
Overall, there is no change in GLD and nothing negative to say, except that it is quite extended after a 13% surge the last nine weeks. The chart is bullish, but I do not see a setup right now. Long-term, the chart in the upper left shows GLD bouncing off a reversal zone marked by the spring 2020 lows and 67% retracement. This is a long-term bullish sequence: three steps forward and two steps backward (67% retracement). The double bottom in March and breakout in April are bullish. On the bar chart, GLD extended its advance and broke above the 200-day SMA. The Heikin-Ashi Candle chart shows GLD breaking out of a pennant pattern two weeks ago.
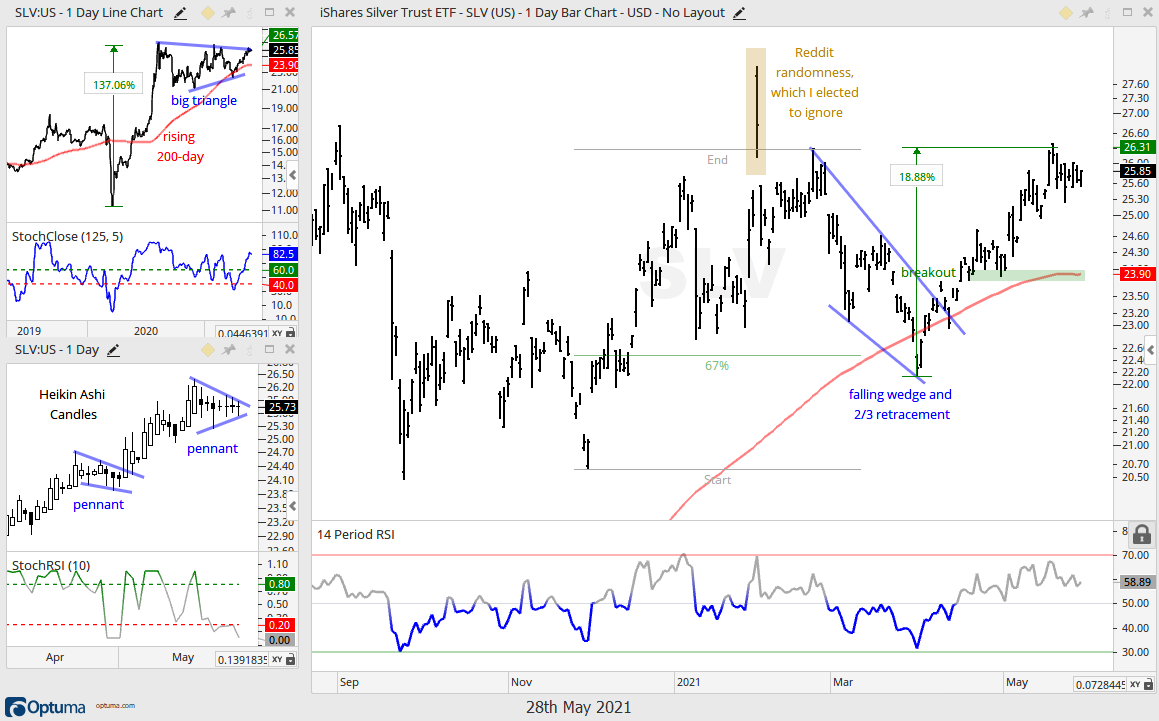
Silver Challenges Triangle Line
The Silver ETF (SLV) is also bullish, but getting extended after a 19% run that is challenging the triangle trendline. Short-term, a bullish pennant is forming and a breakout at 26.10 would argue for a continuation higher, and also a triangle breakout. The long-term chart in the upper left shows SLV near the triangle trendline and a breakout would be long-term bullish. The swing within this big triangle turned up with the falling wedge breakout on the bar chart (mid April).
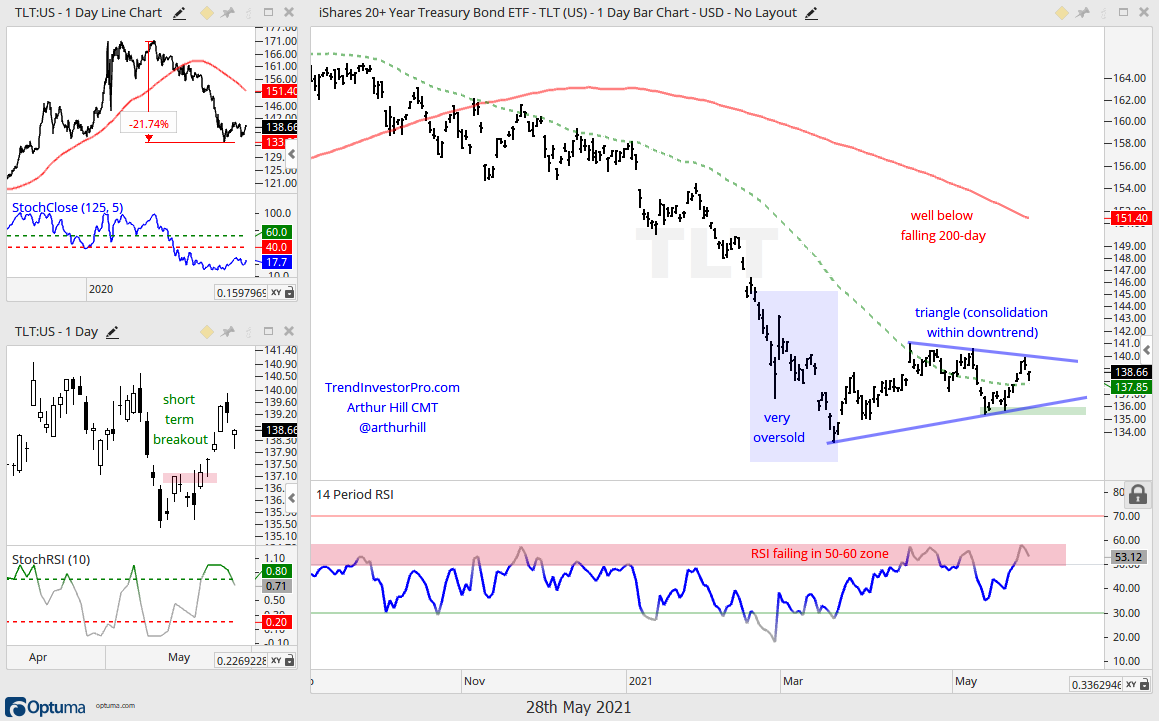
Tainted TLT
The 20+ Yr Treasury Bond ETF (TLT) is in a long-term downtrend and it is easy to be bearish on bonds. The Fed, however, is the elephant in the room because the Fed is actively buying US Treasury bonds. I do not want to speculate on Fed purchases and future tapering plans, but the Fed presence is an issue. On the price chart, TLT is in a long-term downtrend and getting some sort of oversold bounce. It is also possible that a triangle consolidation is forming. Either way, I am not interested in TLT right now because the Fed is spiking the cool-aid and stocks are in a bull market.
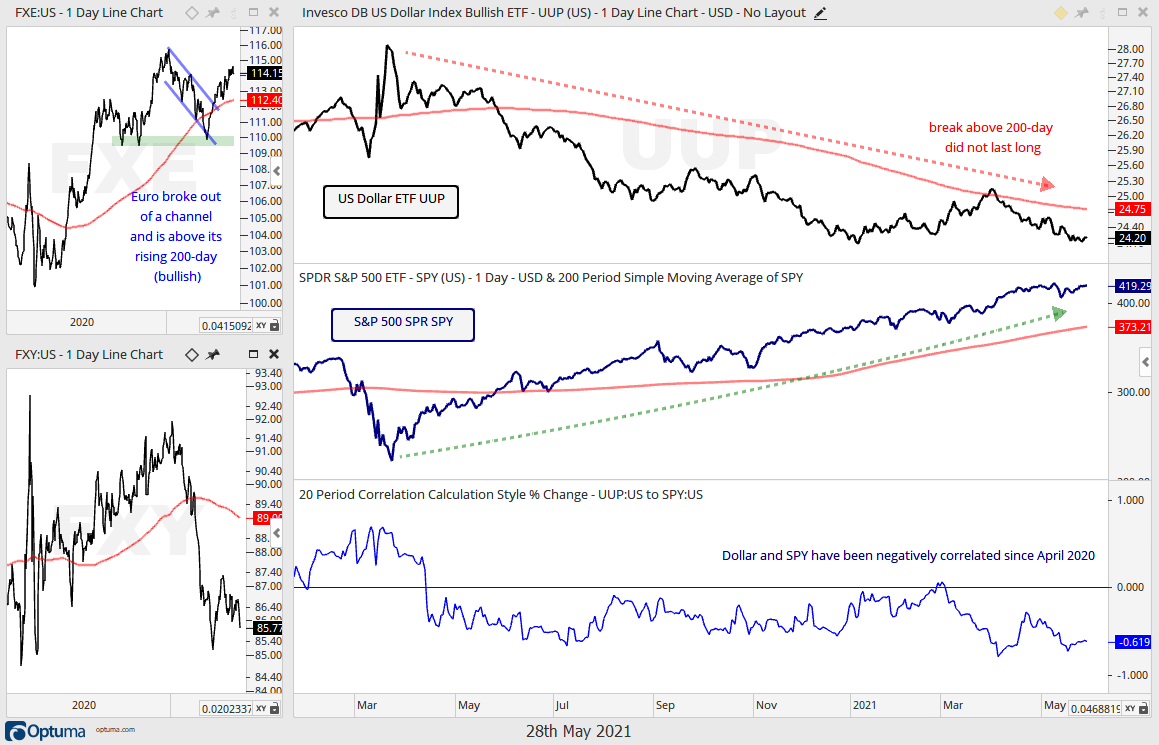
Dollar Nears January Low
There is no change in the Dollar Bullish ETF (UUP), which remains in a long-term downtrend and is on the verge of a 52-week low. UUP bounced from January to March with a test of the falling 200-day. UUP actually broke above the 200-day in late March, but this break did not last long as it turned down a few days later. The downturn extended the last eight weeks and the trend is clearly down. For whatever reason, the Dollar and SPY are negatively correlated, which means they are moving in opposite directions.
")