This article is the second of a two part series where we put gold and silver to the test. The first part (here) showed test results for crosses of the 200-day SMA and EMA. This article tests the Trend Composite signals, analyzes correlation between gold and silver, and analyzes the individual price charts.
The Trend Composite aggregates signals in the five trend indicators below and is part of the TIP Indicator Edge Plugin for StockCharts ACP. The Trend Composite is +1 when three are on bullish signals and two are on bearish signals, and -1 when three are on bearish signals and two are on bullish signals. Thus, an uptrend signals when the Trend Composite turns positive and a downtrend signals when it turns negative.
Moving Average Trend (direction): 5-day ROC of 125-day SMA. Bullish when positive and bearish when negative.
CCI Close: 125 day Commodity Channel Index based on closing prices. Bullish with cross above +100 and bearish with cross below -100.
Bollinger Bands (125,1): bullish with cross above upper band and bearish with cross below lower band.
Keltner Channels (125,2): bullish with cross above upper line and bearish with cross below lower line.
StochClose (125,5): bullish with cross above 60 and bearish with cross below 40.
GLD and SLV Trend Composite Signals
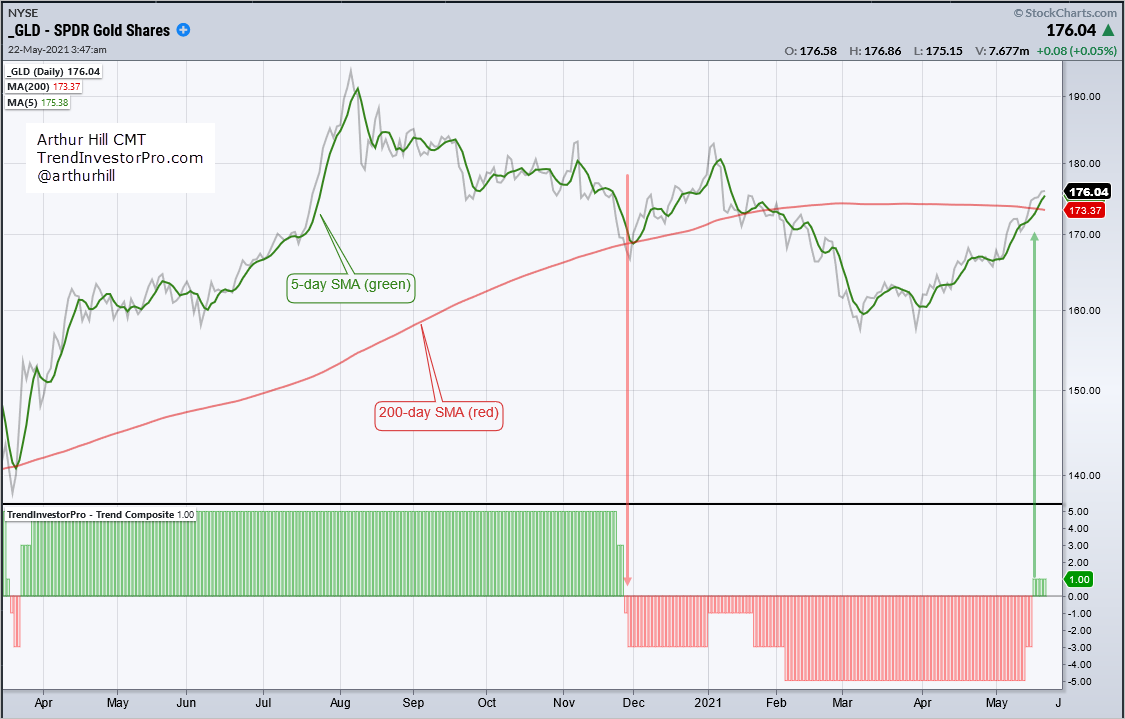
The chart below shows GLD with the Trend Composite turning positive (green) this week. This reverses a bearish signal (red) that was in place from late November to mid May. As you can see on the far left, the Trend Composite is not immune to whipsaws as it turned bearish for a few days in April and then back to bullish.
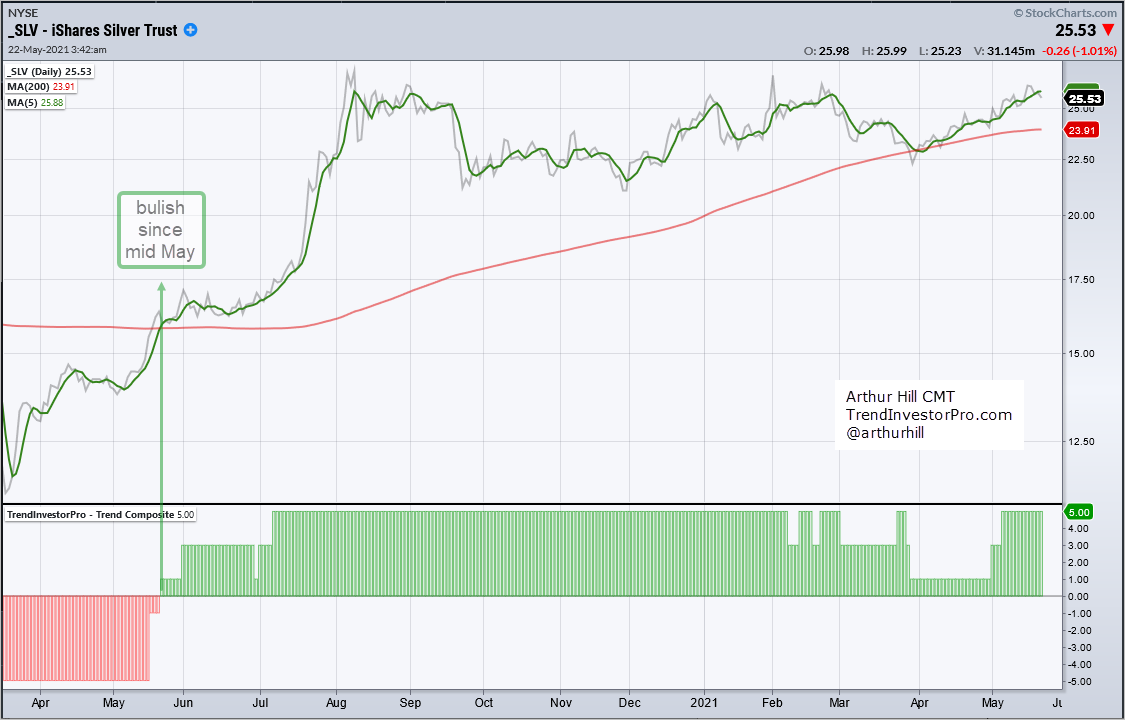
The next chart shows SLV with the Trend Composite turning positive in late May 2020 and remaining positive for a year. Notice that the indicator was able to remain bullish (positive) during the long consolidation from August to May.
Click here to learn more the Trend Composite and the other indicators in the TIP Indicator Edge Plugin.
Testing Trend Composite Signals
Now let’s put GLD and SLV to the test with the Trend Composite. Buy when the Trend Composite turns positive and sell when it turns negative. The GLD test starts in January 2006 and the SLV test starts in January 2007. GLD started trading in March 2005 and SLV started trading in May 2006.
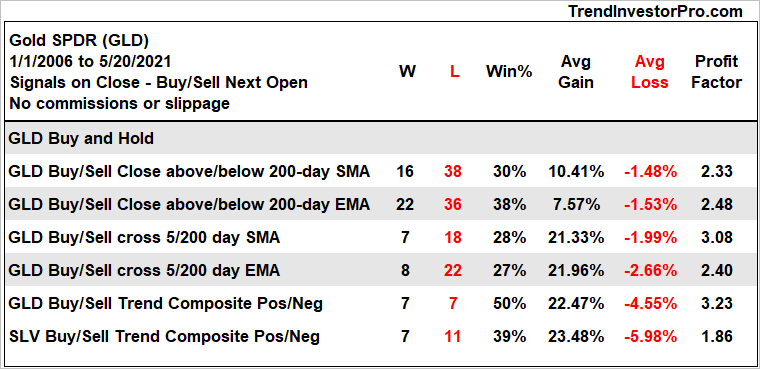
Overall performance metrics improved when using the Trend Composite. The Win% for GLD jumped to 50%, the Average Gain was marginally higher and the Average Loss was double. The Average Loss was still manageable and more than four times the Average Gain. This is why the Profit Factor improved to 3.23 and was the highest of the group. Given the 50% win rate and high Profit Factor, I would give the win to the Trend Composite.
The bottom line shows results for SLV. SLV had a lower Win% than GLD and higher Average Loss, but the Average Gain was slightly higher. Nevertheless, the Profit Factor was below 2 and the lowest of the group. Silver is much more volatile than gold and this means it carries more risk. Note that SLV produced a bull run from 10 to 50 (Nov-2008 to Apr-2011) and then a bear run from 50 to 13 (Apr-2011 to Dec-2015).
Natural Gas is known as the widow maker because of its volatility and I would put SLV in second place. Don’t bet the farm!
Silver is Gold on Red Bull
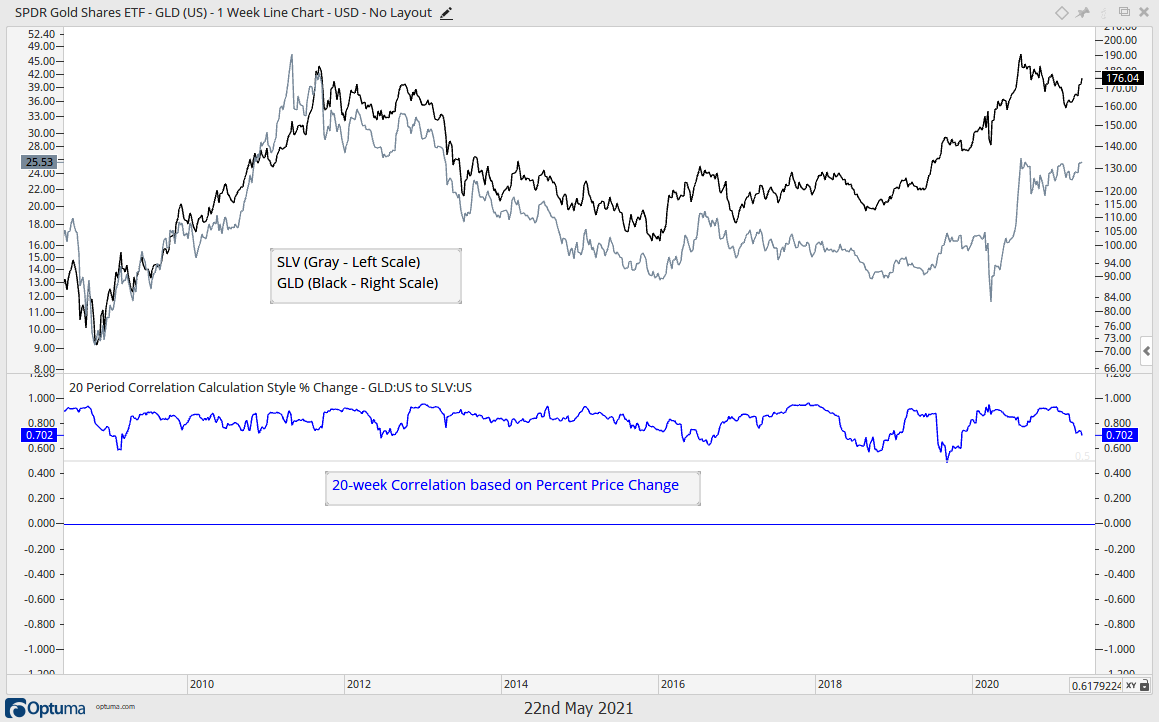
The monthly annualized volatility is 24.8% for SLV and 10.4% for GLD. For reference, this number is 14.8% for SPY. SLV is more than twice as volatile as GLD, but GLD is less volatile than SPY. Despite this volatility difference, GLD and SLV are positively correlated and this correlation is strong. The chart below shows weekly closing prices for GLD (black) and SLV (gray) in the top window and the 20-week Correlation of price changes in the lower window. Visually, we can see GLD and SLV moving in tandem. 20-week Correlation confirms this link because it has been well above .50 for most of the last 12 years. Thus, don’t expect any diversification by holding both. Choose gold if you want normal exposure. Choose silver for a wilder ride.
GLD Chart is Structurally Bullish
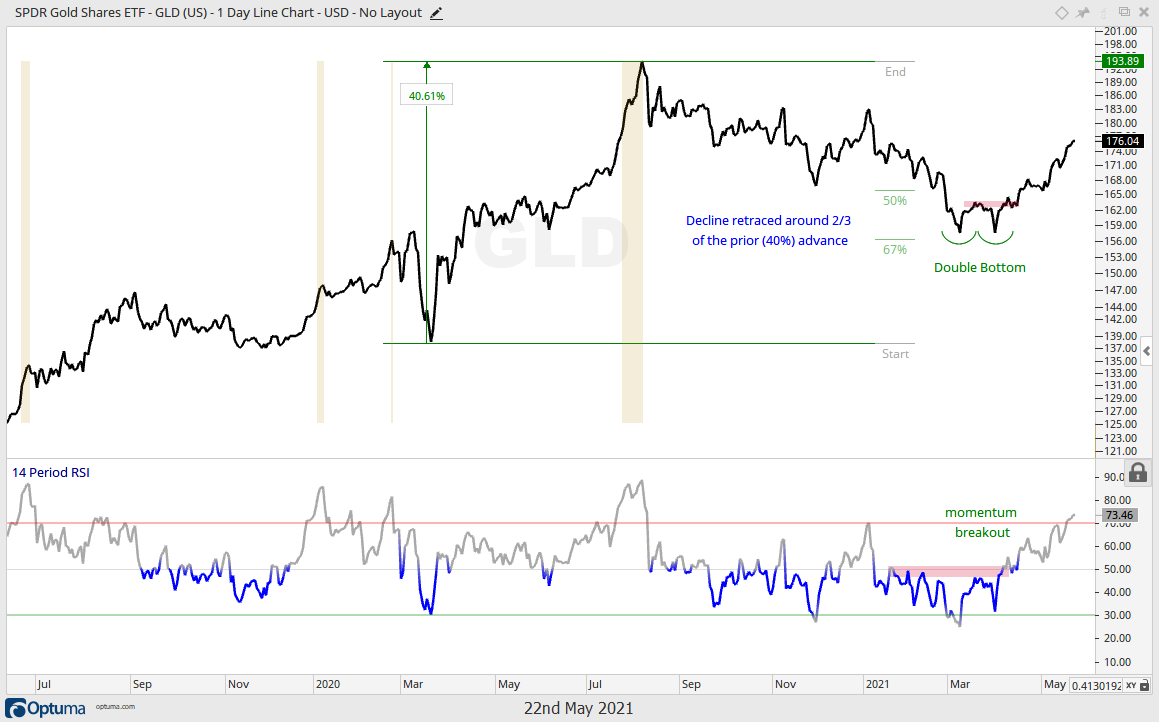
The price charts for GLD and SLV are long-term bullish, but short-term extended after big runs the last eight weeks. The first chart shows GLD with a 40% advance and then a decline that retraced around 2/3. This is a bullish sequence because it represents three steps forward (+40%) and two steps backward (2/3 retracement). GLD formed a Double Bottom earlier this year and broke out in mid April.
RSI moved above 70 this week and hit its highest level since July, when it exceed 80. The move above 70 shows strong buying pressure (momentum) and this is actually bullish. In contrast, a move above 80 shows froth that can lead to a pullback (yellow shading).
I am currently bullish on gold and will stay bullish as long as the Trend Composite remains positive. I do not see a short-term bullish setup on the chart right now, but will be watching for an RSI dip to the oversold zone (30-50) and/or a short-term bullish continuation pattern (flag, triangle, wedge).
SLV Forms Massive Bullish Continuation Pattern
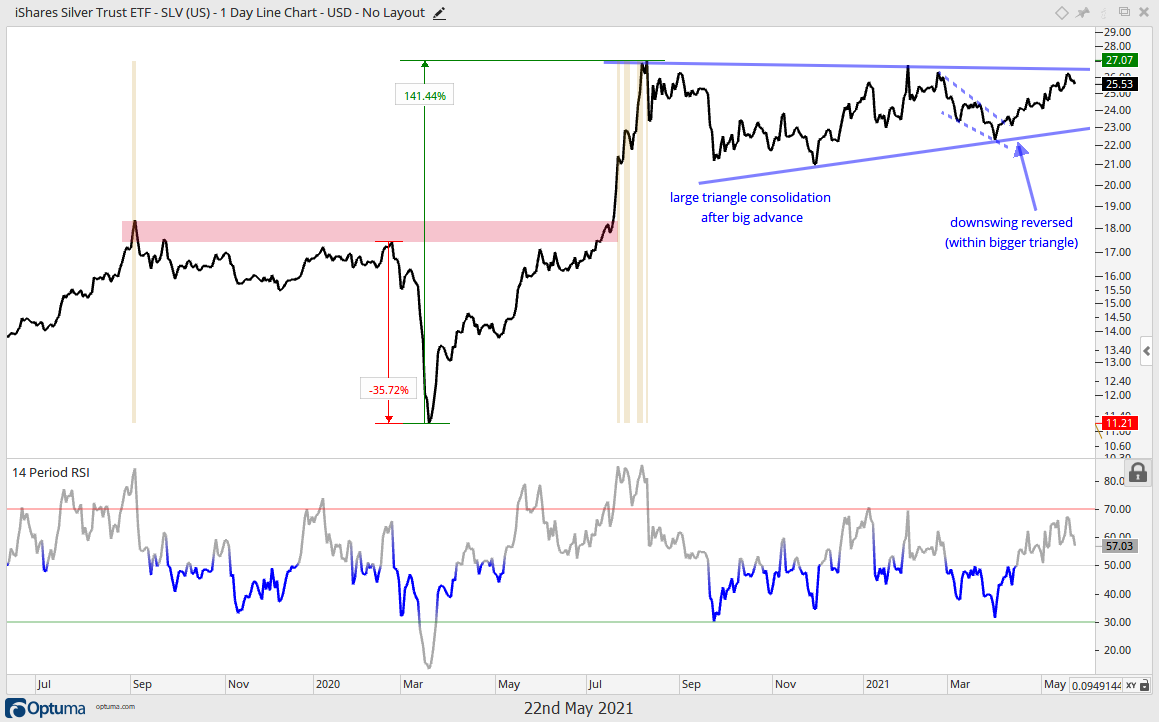
The next chart shows SLV with two big swings: down 36% from 21-Feb to 17-Mar 2020 and up 140% from 18-Mar to 10-Aug 2020. The yellow shading shows when RSI(14) exceeded 80 and this marked a danger zone in September 2019 and summer 2020. This extended overbought condition preceded a long corrective period as a triangle formed from August to May. A triangle within an uptrend represents a consolidation or rest within that trend and is considered a bullish continuation pattern.
The swing within the triangle turned up with the falling wedge breakout in mid April. A triangle breakout would end the big consolidation and signal a continuation of the prior advance. $50 here we come? Before getting too excited, remember that anything is possible with silver. As with GLD, I do not see a short-term bullish setup right now and will keep SLV on my radar for bullish setups as long as the Trend Composite remains positive.
")