The broad market environment (market regime) remains bullish. The Composite Breadth Model is bullish and the key inputs (breadth indicators) support this bull market. Even though QQQ dipped the last two weeks and IWM stalled since mid February (blue shading), SPY hit a new high recently and all three remain well above their rising 200-day SMAs (red lines).
There can still be corrections along the way because SPY remains extended (+28% since late October), but any weakness would be considered a mere correction, as long as the bulk of the evidence remains bullish.
Today’s report just covers the Composite Breadth Model, yield spreads and Fed balance sheet. These are the macro indicators that drive bull and bear markets in stocks. They may wiggle, but major changes do not occur that often. The yield spreads remain near multi-year lows and there are no signs of stress in the credit markets, which supports a bull market for stocks. Details are below.
Composite Breadth Model: Bull Market
There is no change in the Composite Breadth Model, which remains on a bullish signal since May 29th, 2020. This signal is 239 days old and SPY is up around 40%. I updated the note on the right side of the image.
Even though this signal is getting stretched in both time and price, the trend is not over until its over. At least that’s what Yogi Berra said when he was a trader. On a serious note, Charles Dow asserted over 100 years ago that neither the length nor the duration of a trend can be determined. The best we can do is identify the direction and trade based on the path of least resistance.
The image below shows the Composite Breadth Model signals in the top window and the five inputs in the lower windows. All five inputs are bullish and the Composite Breadth Model stands at +5. All five inputs have been bullish since August 7th. I do not attach a degree of bullishness or bearishness based on the number of inputs that are bullish/bearish. The model is either bullish or bearish.
Over 90% of S&P 500 and S&P 1500 stocks are above their 200-day SMAs. Over 85% of S&P 500 and S&P 1500 stocks are above their 150-day SMAs. S&P 500 High-Low Percent exceeded +20% several times since April. This means more than 20% of stocks in the S&P 500 recorded 52-week highs. S&P 1500 High-Low Percent exceeded +10% several times since April. Overall, large-caps remain stronger than small-caps, but small-caps are not exactly bearish right now. You can see charts with individual indicators on the Market Regime page.
You can learn more about the methodology and historical performance for these breadth models in this article.
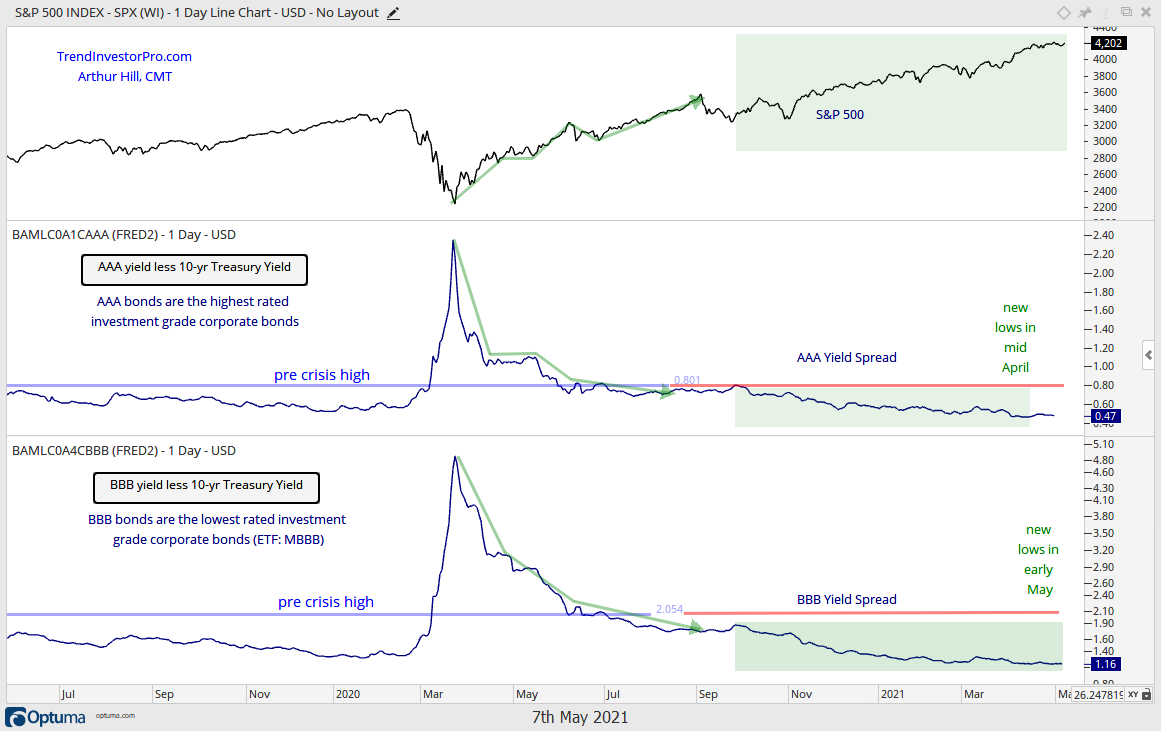
Yield Spreads and Fed Balance Sheet
AAA bond spreads narrowed from late September to mid April and then flattened out at low levels. BBB spreads narrowed a little more in early May and hit new lows this past week. BBB bonds are the lowest rated investment grade bonds. New lows in these spreads means there are no signs of stress in the credit markets.
Junk and CCC yield spreads narrowed from late September to early April and then flattened over the last few weeks. They remain at very low levels and there are no signs of stress at the junk end of the credit market.
The Fed balance sheet expanded by $30 billion this past week and there is no change in the overall trajectory. The balance sheet has been expanding since mid July.
")