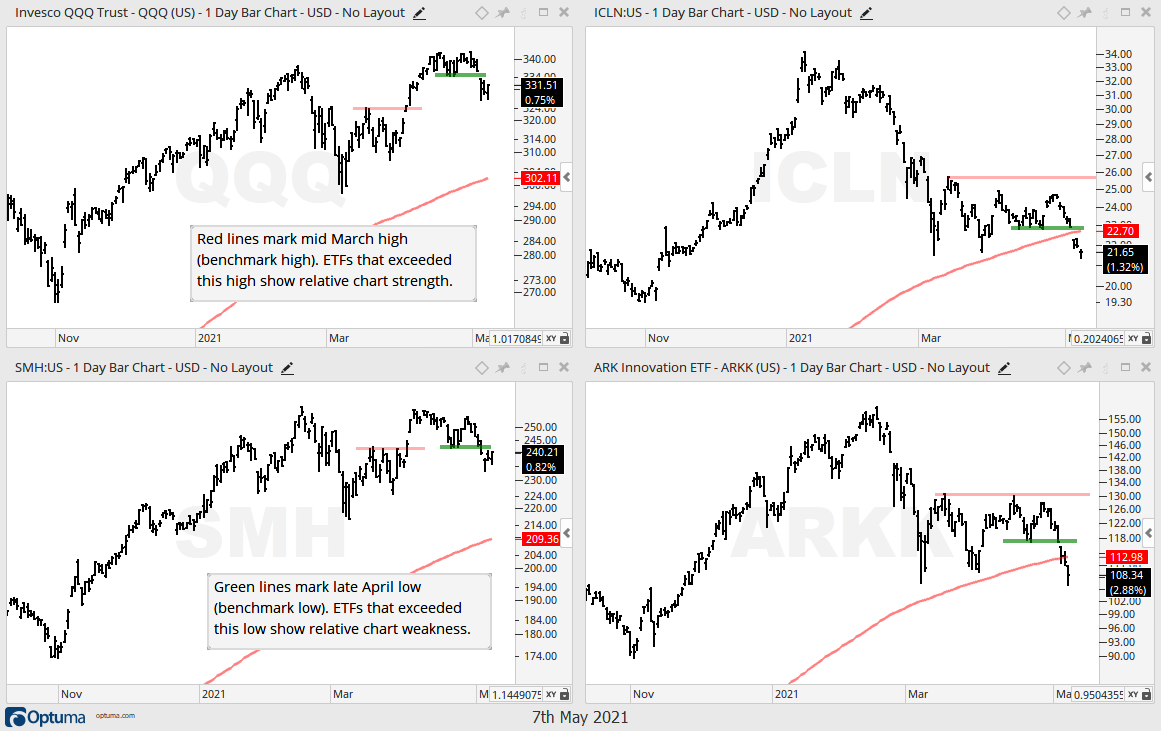
A benchmark high/low is a price peak/trough that we can use to compare performance. ETFs that break above benchmark highs, such as the mid March highs, show relative strength. ETFs that fail to exceed these highs show relative weakness. ETFs that break below benchmark lows, such as the late April lows, show relative weakness. ETFs that hold these lows show relative strength. Today’s report will show some charts with the mid March benchmark highs and late April benchmark lows. I will also show four ETFs that held up relatively well the last two weeks and have bullish setups on the charts.
ETFs Breaking below and Holding above Benchmark Lows
ETFs related to tech and high growth came under selling pressure the last two weeks and most broke their late April lows, which are considered benchmark lows. QQQ, XLK, most tech-related ETFs, clean energy ETFs and the ARK ETFs all broke their late April lows. The clean-energy and ARK ETFs have been lagging since the second half of February. QQQ, XLK and the Semiconductor HOLDRS (SMH) are new to the lagging side with recent breaks below these bench mark lows.
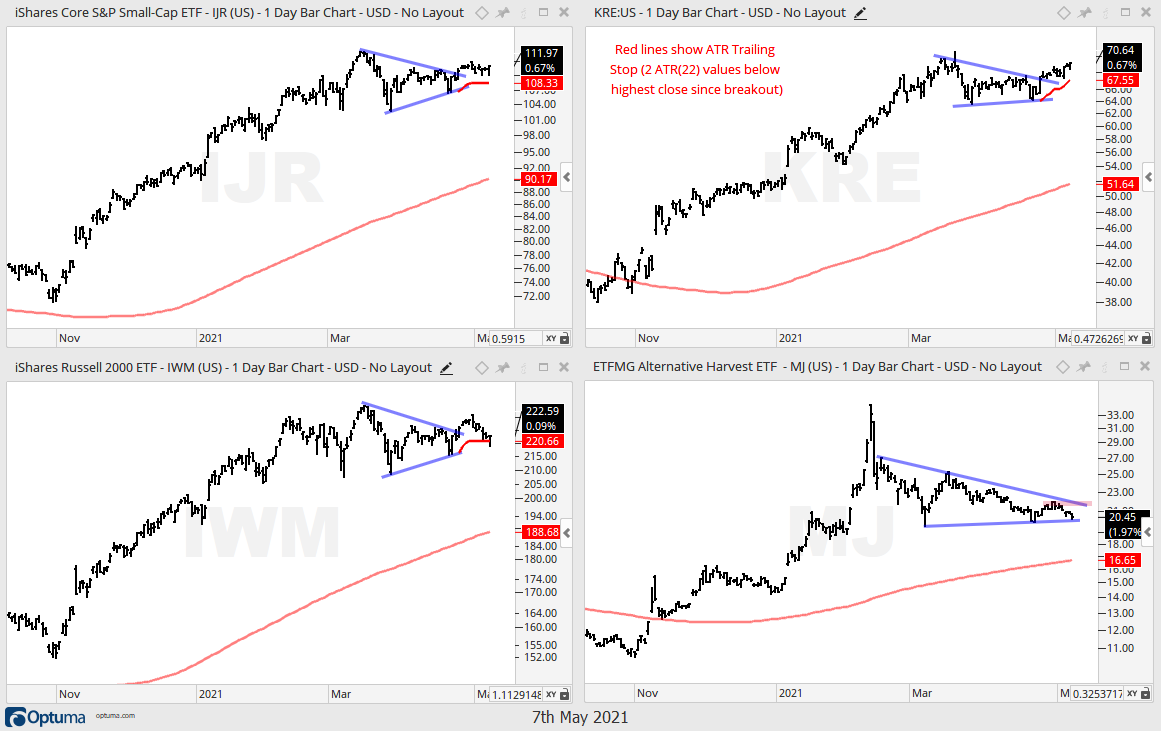
On the flipside, we have small-caps, banks, consumer discretionary, defense and cannabis ETFs holding above their late April lows. The S&P SmallCap 600 SPDR (IJR) and Regional Bank ETF (KRE) were highlighted on Thursday as they held their triangle breakouts. The Alternative Harvest ETF (MJ) was also highlighted as its triangle consolidation narrows. Today I would like to highlight four more ETFs showing some short-term relative strength. These ETFs are also in uptrends with bullish continuation patterns working.
You can learn more about ATR Trailing stops in this post,
which includes a video and charting option for everyone.
JETS Holds Above Late April Low
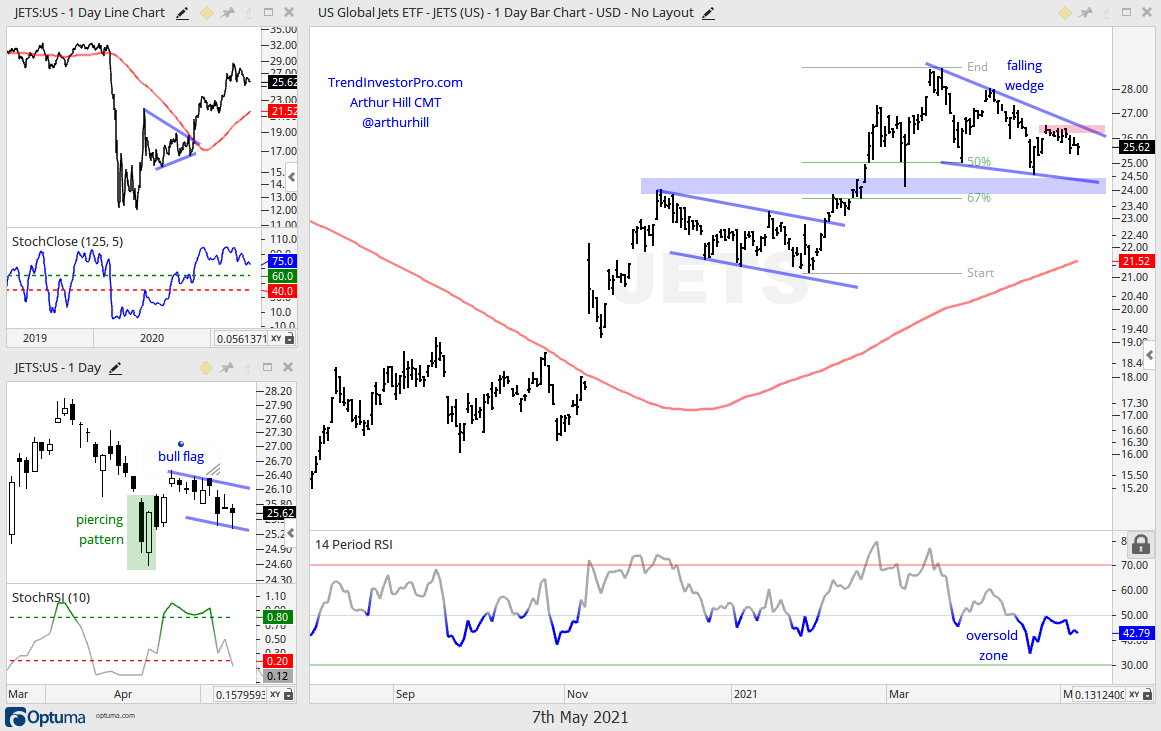
The first chart shows the Global Jets ETF (JETS), which, unsurprisingly, is full of airline stocks. JETS hit a new high in mid March and then retraced 50-67% with a falling wedge pattern. Both the retracement and the pattern are typical for corrections within a bigger uptrend. JETS bounced near the blue zone and then edged lower the last two weeks, but remains above its late April low as it held up relatively well. A breakout at 26.5 would reverse the falling wedge and signal a continuation higher.
Programing Note: I will post the Market Timing report today before noon ET.
PSCD Confirms Breakout in Small-Caps
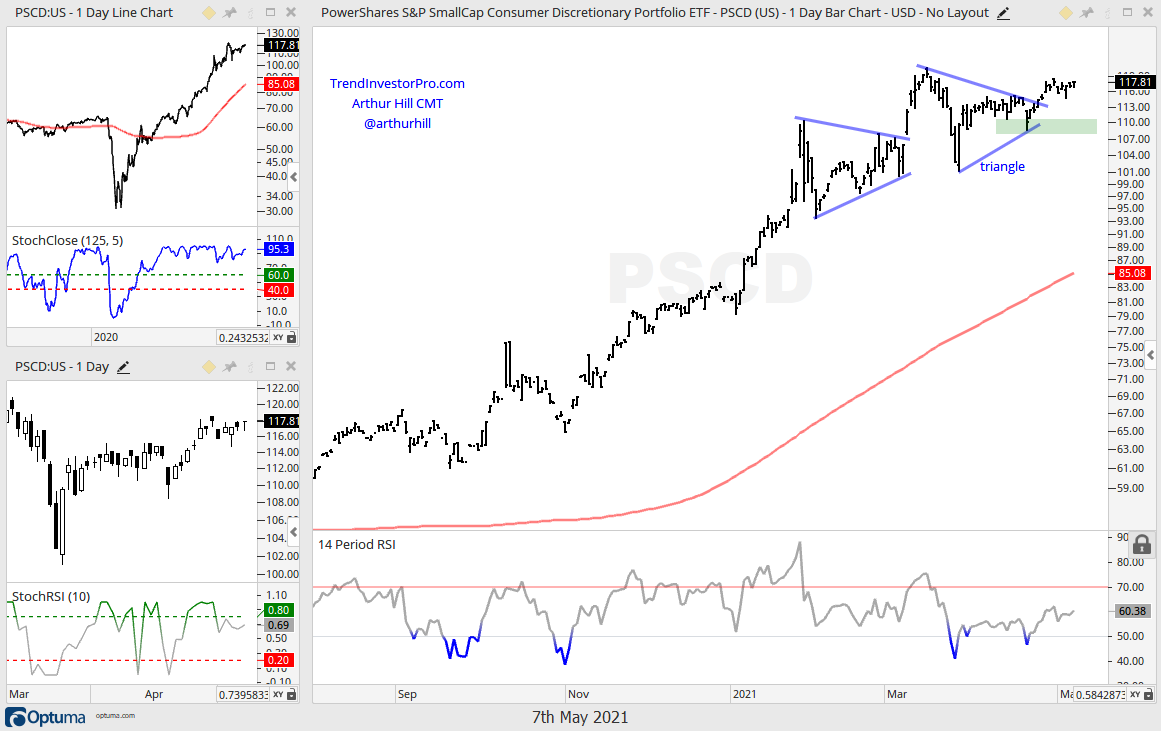
I realize that the Small-cap Consumer Discretionary ETF (PSCD) is not the most liquid ETF out there and it gets a B- for liquidity on ETFDB.com. This, however, does not make it useless, especially if we are interested in the S&P SmallCap 600 SPDR or Russell 2000 ETF. Consumer Discretionary is an important sector. The chart below shows PSCD keeping pace by breaking out of a triangle pattern last week and holding this breakout. This is bullish for small-caps overall and PSCD remains bullish as long as the late April lows hold (green shading).
ITA Forms Bullish Continuation Pattern
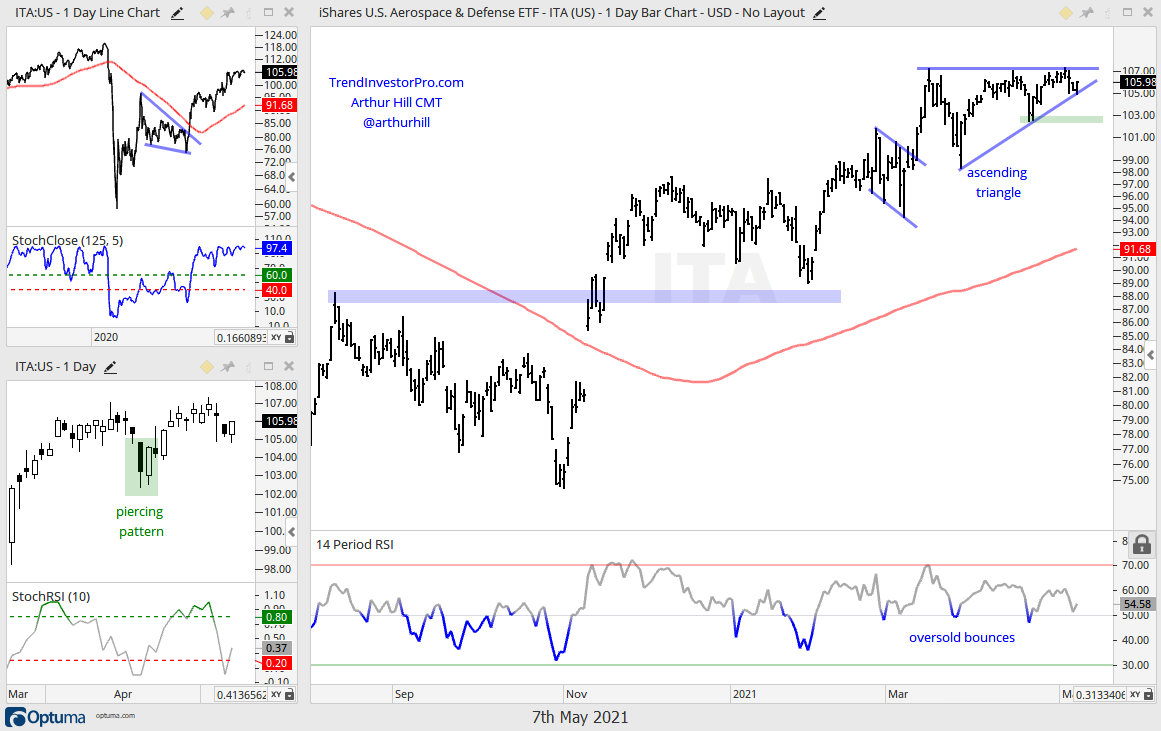
The next chart shows the Aerospace & Defense ETF (ITA) hitting a new high in mid March and then forming an Ascending Triangle. This is a bullish continuation pattern and a break above the March-April highs would signal a continuation higher. Again, the green shading shows the late April low and the bulls have a clear edge as long as this low holds.
EPOL Extends After Breakout
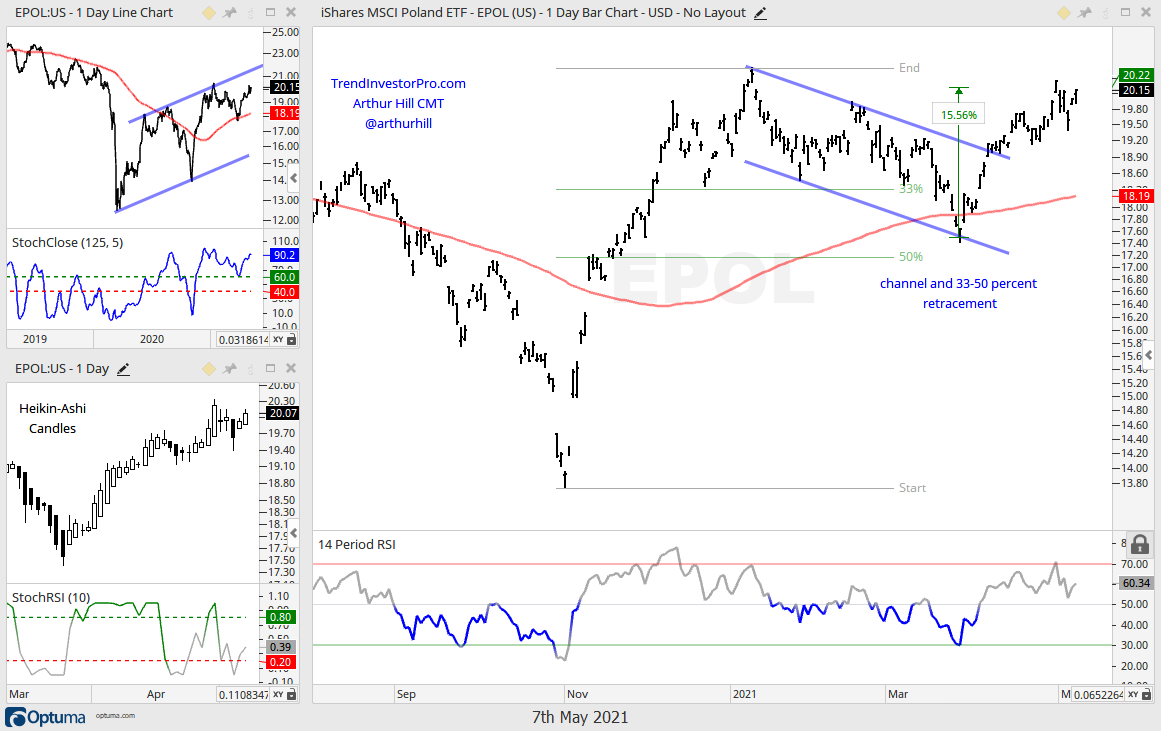
The next chart shows the Poland ETF (EPOL) with a falling channel and breakout. The channel retraced 33-50 percent of the prior decline and managed to reverse at the 200-day SMA. The early April breakout reversed the channel and signaled a continuation higher. EPOL fell back on Friday-Monday-Tuesday, but held above the late April low as it rebounded the last two days. Admittedly, EPOL is a bit extended short-term after a 15% advance, but this chart looks bullish longer term.


