")
The next report and video will be on Thursday, January 2nd.
Report & Video Headlines
- Percent Downside for a Normal Correction
- Warning Sign Review (ITB, SOXX, TNX, %Above 50-day)
- Long-term Breadth Indicators Remain Bullish
- Yield Spreads Tick Up from Low Levels
- SPY/QQQ in Uptrends, but Ripe for Corrective Period
- Oversold Until Upside Participation Expands
Today’s report will highlight the warning signs over the last few weeks and assess the evidence (bull or bear market). Corrections are normal, but what might a normal correction entail? We will review the long-term breadth indicators, yield spreads and the weekly charts for SPY and QQQ, including correction targets. This report ends with two short-term breadth indicators to watch for a bullish signal.
Traders and investors rely on signals to dictate position changes. A bull market signals and remains in place until a bear market signals. In other words, it is a bull market until it isn’t. Even though I am seeing some warning signs in the markets, my broad market indicators are still bullish and have yet to signal a bear market.
As shown in the commentary below, breadth deteriorated in December, but has yet to reach bear market levels. Yield spreads ticked up as stocks fell, but have yet to show serious stress that would undermine the bull market. And finally, SPY and QQQ fell over 2% last week, but remain in long-term uptrends. Thus, the weight of the evidence remains bullish for stocks.
Holiday Schedule
Note that I will post a comprehensive report and video on Monday. There will be no reports between Christmas and New Years (25-Dec to 1-Jan). I will resume on January 2nd with a report and video.
- Monday, December 23th: Report and Video
- Wednesday, December 25: Christmas
- Wednesday, January 1: New Years Day
- Thursday, January 2: Report and Video
Merry Christmas and Happy New Year!!
Percent Downside for a Normal Correction
Even with the weight of the evidence bullish, we can still experience corrections and pullbacks along the way. In fact, an 8-10 percent pullback would actually be quite normal. Such a pullback, however, would not feel normal. It would feel a lot worse. Also keep in mind that correlations rise during a correction and this means most stocks come under pressure. The chart below shows SPY over the last three years with the Zigzag (8) indicator, which shows price swings that are 8% or greater.
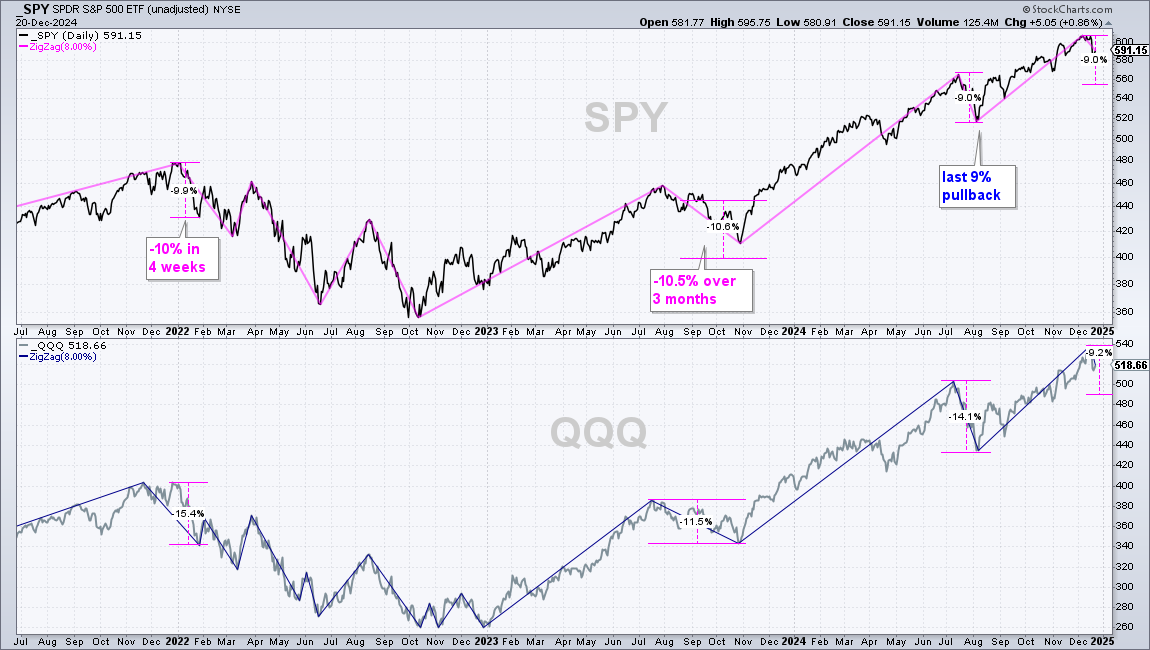
SPY bottomed in October 2022 around 360 and exceeded 600 in December 2024. This is basically a 65% advance in a little over two years. During this bull run, there was a 10.5% correction that lasted three months (Aug-Sep-Oct 2023) and a short-sharp 9% pullback in early August. And that’s it. For reference, a 9% decline from current levels would extend to the 553 area.
Warning Sign Review (ITB, SOXX, TNX, %Above 50-day)
As noted in commentaries last week (here and here), the warning signs are increasing. The breakout and rise in the 10-yr Treasury Yield looks similar to July 2023 and this foreshadowed a 10% decline in SPY (August to October 2023). Housing is an important part of the economy and the breakdown in the Home Construction ETF (ITB) bodes ill. The semiconductor business is cyclical and the Semiconductor ETF (SOXX) is in a downtrend. SPX %Above 50-day SMA plunged to its lowest level of the year as downside participation increased significantly.
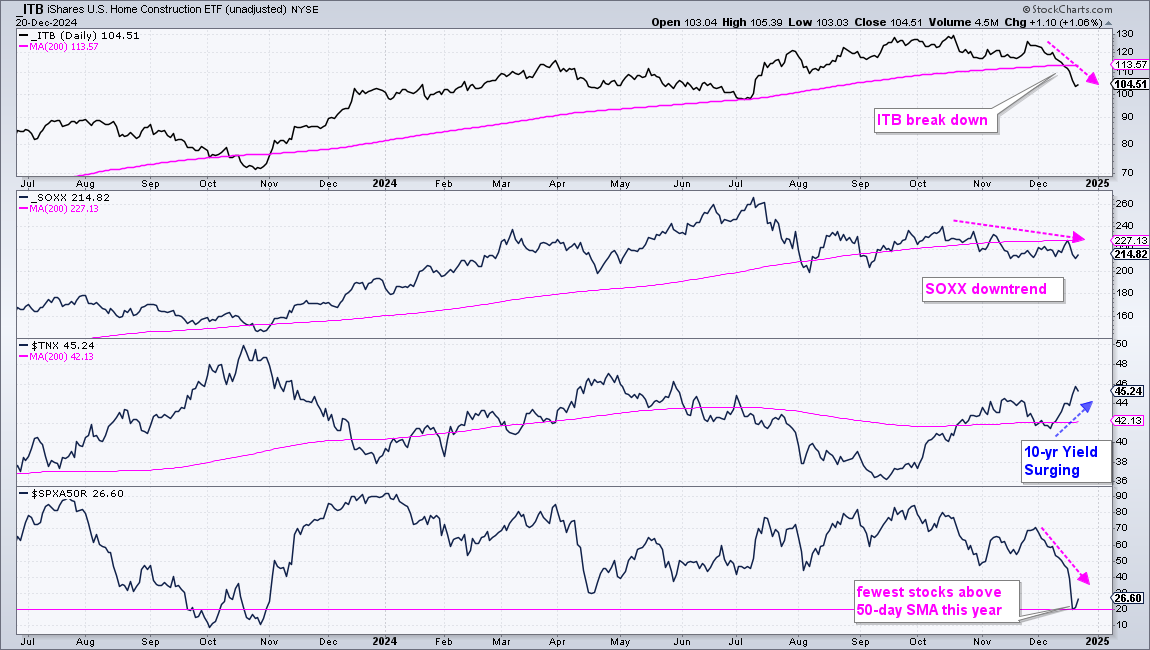
I will treat a decline as a correction within an uptrend as long as the weight of the evidence remains bullish. All corrections begin with a 3-5% pullback, but not all 3-5% pullbacks result in corrections. Similarly, all bear market signals start with a correction, but not all corrections lead to bear market signals. The call right now is for a corrective phase and I will take it one day/week at a time.
Long-term Breadth Indicators Remain Bullish
The long-term breadth indicators turned net bullish on December 1st, 2023. SPX %Above 200-day SMA exceeded 60% on November 20th and SPX High-Low Percent exceeded +10% on December 1st. See the blue arrows and dates in the middle of the chart. These signals put two of the three breadth indicators in bull mode. Also note that SPY triggered a Bollinger Band breakout on November 15th. Thus, the weight of the evidence turned bullish in early December 2023 and this signal has yet to be reversed.
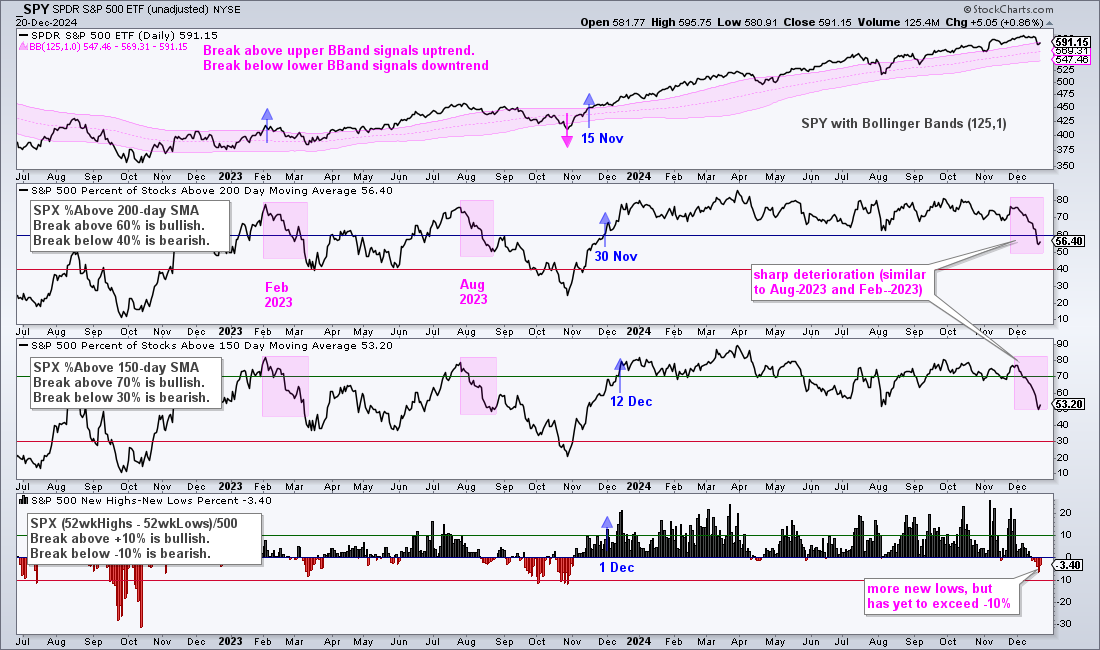
The pink shading on the right side shows a sharp deterioration in breadth this month. The percentage of S&P 500 stocks above their 200-day SMAs fell to 56.40% and the percentage of stocks above their 150-day SMAs fell to 53.2%. These are also the lowest levels of the year. The sharpness of the decline is similar to what we saw in February and August 2023. The February decline was short-lived as the market bounced in mid March. The August decline, however, extended into late October as both breadth indicators moved below 30%.
Despite a sharp deterioration in breadth, these indicators have yet to trigger bearish. This means we are still in a bull market environment. The weight of the evidence would turn bearish should two of the three trigger bearish. This means SPX %Above 200-day crossing below 40%, SPX %Above 150-day crossing below 30% and/or SPX High-Low Percent crossing below -10%.
The next chart shows the same indicators for the Nasdaq 100: QQQ with Bollinger Bands (125, 1), NDX %Above 200-day SMA, NDX %Above 150-day SMA and NDX High-Low Percent. Nasdaq 100 breadth has been net bullish since February 1st, 2023. NDX %Above 200-day triggered bullish with a move above 60% on January 30th and NDX %Above 150-day triggered bullish with a move above 70% on February 1st. NDX High-Low Percent followed with a move above +10% on May 19th. Also note that QQQ triggered a Bollinger Band breakout in mid November 2023.
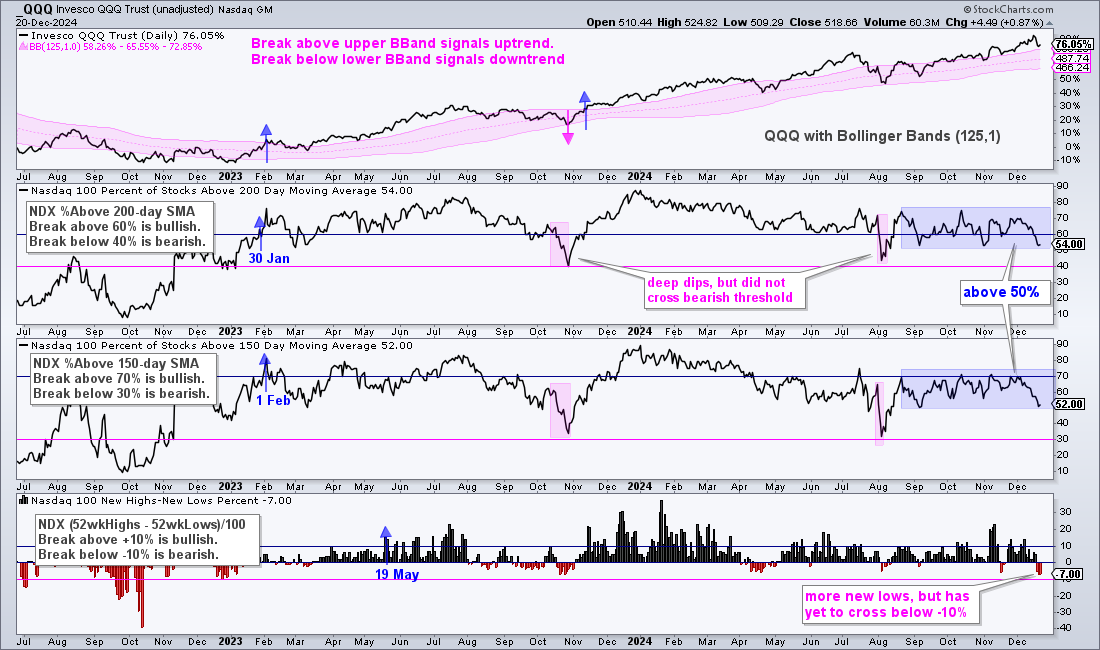
All three indicators deteriorated in December, but has yet to trigger long-term bearish signals. The percentage of stocks above their 200-day SMAs and above their 150-day SMA experienced two sharp declines in the last 15 months: October 2023 and August 2024 (pink shading). At this point, the deterioration in breadth is considered a pullback within a bigger bullish environment. I need a signal before calling for a bear market and these indicators have yet to trigger bearish.
Yield Spreads Tick Up from Low Levels
The next chart shows the BBB and Junk bond spreads ticking up last week, but remaining at narrow levels overall. See below for an explanation of yield spreads. The red lines are the 200-day SMAs and these are the first levels to watch. A break above the 200-day SMAs would show some widening that could provide a headwind for stocks. Further above, I marked by lines in the sand at 1.3 and 3.6. Breakouts here would show a serious widening and stress in the credit markets. This would be negative for stocks.
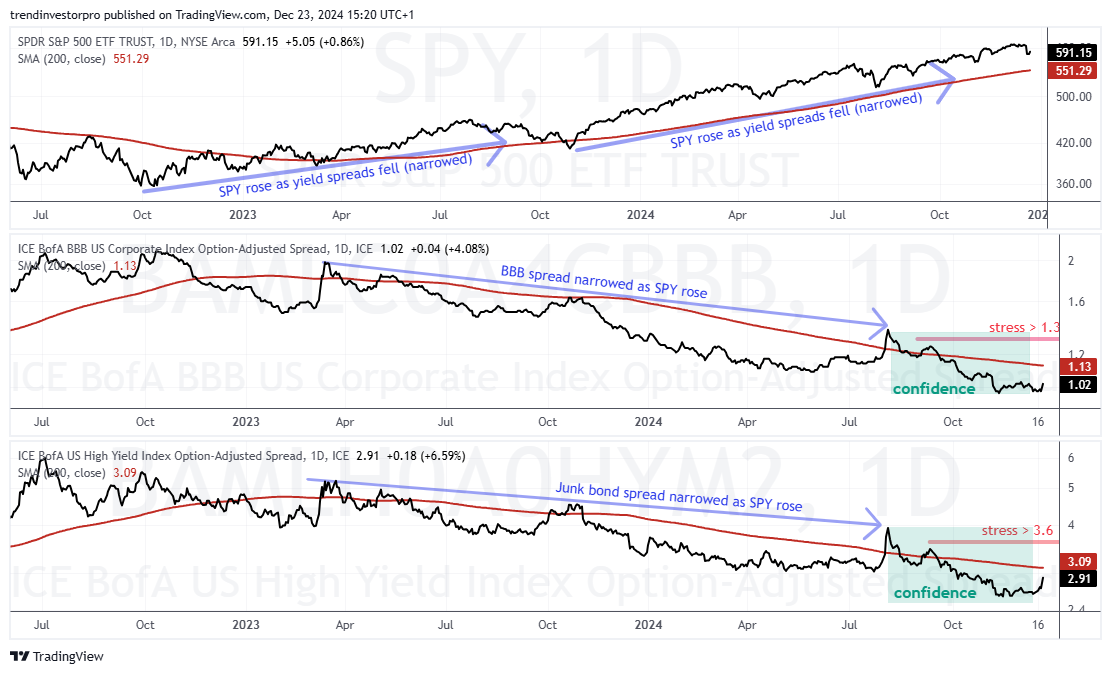
The BBB yield spread shows the difference between the BBB corporate bond yield and the comparable US Treasury bond yield. BBB yields are always higher than US Treasury yields because they are riskier. Narrow and/or narrowing spreads show confidence in the corporate bond market, while wide and/or widening spreads show stress. Confidence is bullish for stocks, and stress is negative.
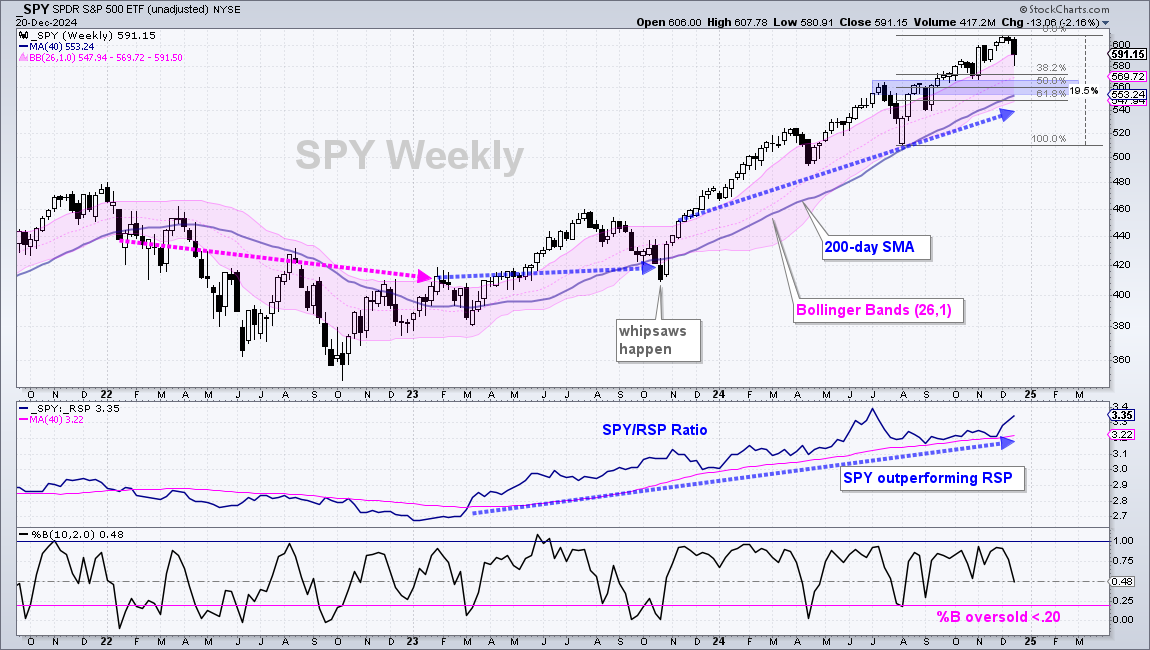
SPY and QQQ in Uptrends, but Ripe for a Corrective Period
The next charts show weekly candlesticks for SPY and QQQ with Bollinger Bands (26,1) in pink shading and the 200-day SMA (thick blue line). SPY is in a long-term uptrend with a new high three weeks ago. The ETF fell 2.16% last week and finished near the upper Bollinger Band. This weekly chart puts the decline into perspective. The decline is not enough to threaten the long-term uptrend, but we could be entering a corrective period after a 19.5% advance off the early August lows. I am marking the first support zone around 560 (blue shading). This zone stems from broken resistance, the rising 200-day SMA and the 50-61.8% retracement zone. A correction into this zone could offer an opportunity to partake in the bull market at lower prices.
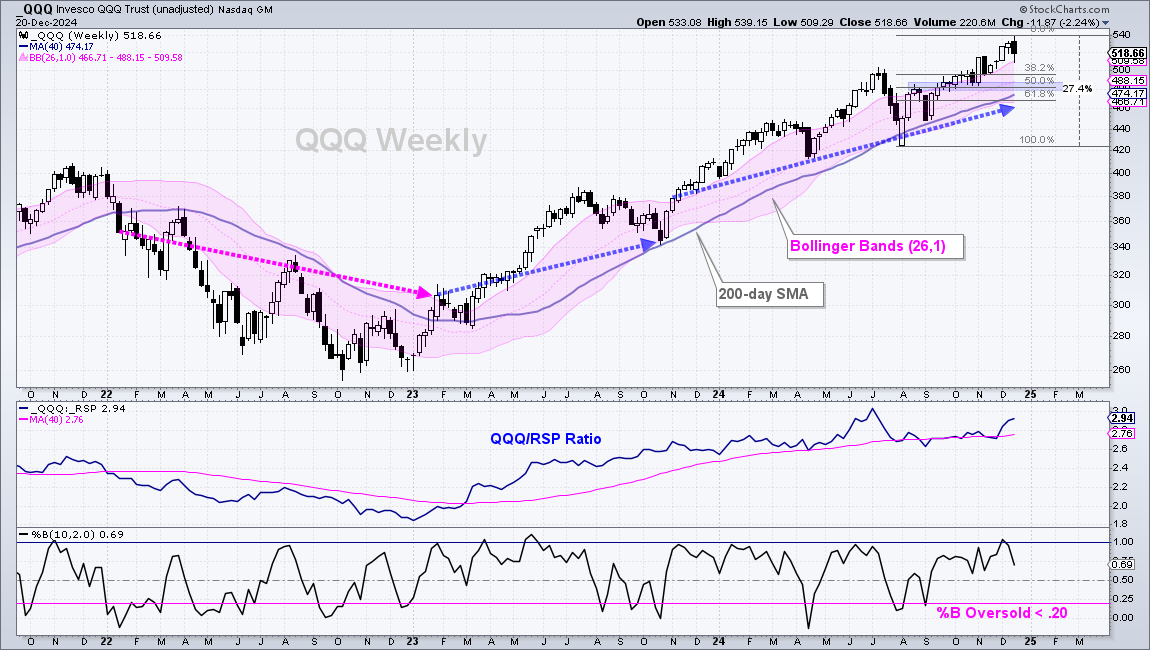
The next chart shows QQQ with the same indicators and settings. QQQ hit a new high last week, but closed 2.24% lower by the end of the week. Overall, the long-term trend is up with this new high. However, we can see an overbought indicator and exhaustion that could give way to a correction. For exhaustion, notice that QQQ formed a bearish engulfing as it started the week strong and finished weak. For overbought, the bottom window shows %B exceeding 1 for the first time since May 2023. Overbought readings with a breakout surge, such as in early 2023, reflect an upside momentum thrust and this is bullish. In contrast, overbought readings in a relatively mature uptrend are a sign of excess that could lead to a correction. I am marking my correction target in the 480 area (blue shading). As with SPY, this area marks broken resistance, the 50% retracement and the rising 200-day SMA.
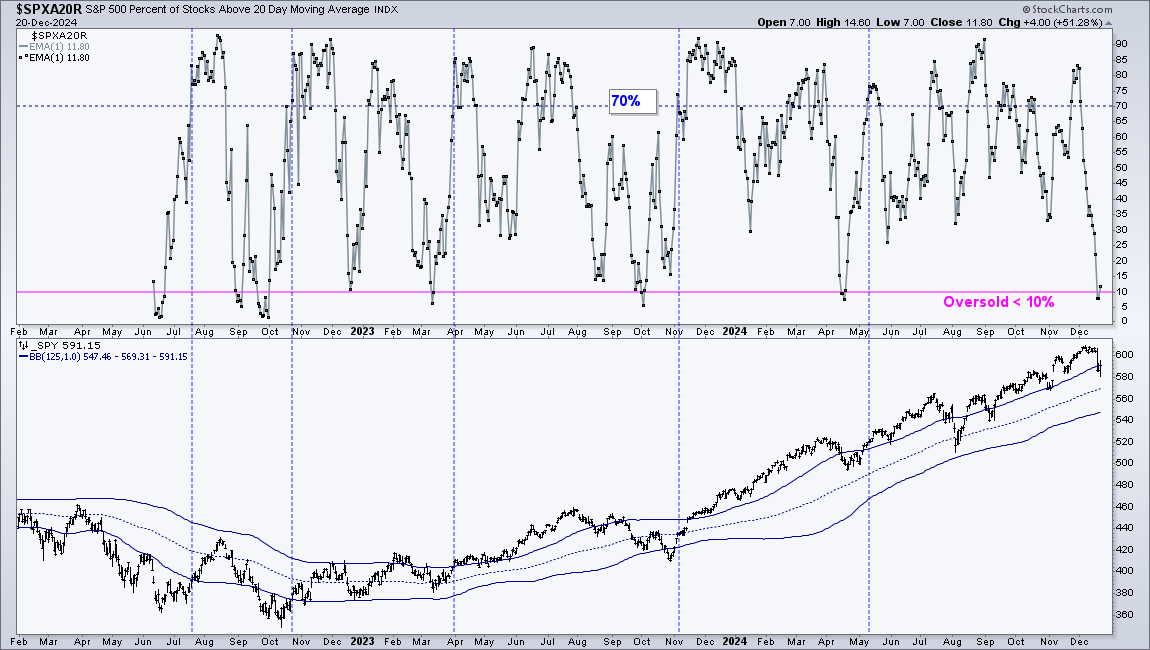
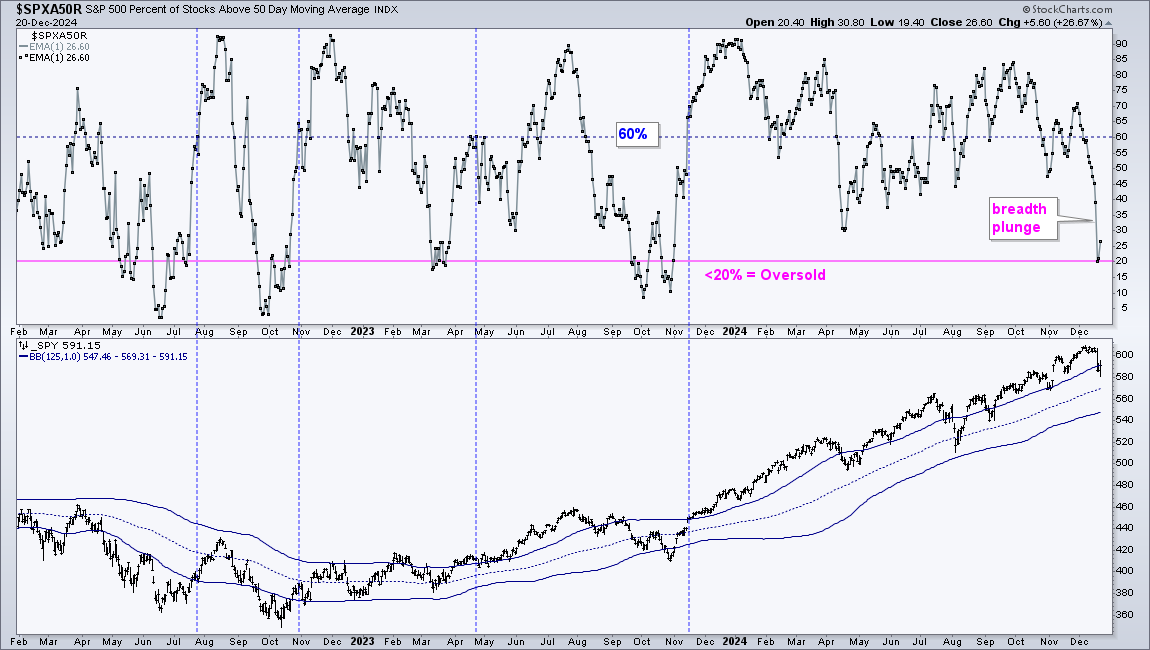
Oversold Until Upside Participation Expands
The chart below shows SPX %Above 50-day in the top window and SPY with Bollinger Bands (125,1) in the lower window. %Above 50-day become oversold with a move below 20%. Note, however, that it can become oversold and remain oversold. An oversold reading shows strong downside participation so we need a signal to confirm a rebound. I look for a move above 60%. The blue dashed lines show when %Above 50-day SMA exceeds 60% after becoming oversold. There were just four signals in the last three years and none in 2024.
The next chart shows SPX %Above 20-day SMA in the top window and SPY with Bollinger Bands in the lower window. This indicator is more sensitive because the 20-day SMA is much shorter than the 50-day SMA. This means it generates more setups and signals. I did, however, widen my oversold and signal thresholds to account for more sensitivity. A move below 10% denotes an oversold condition and a subsequent surge above 70% triggers a bullish signal.