Medical Devices ETF Holds Wedge and Flag Breakouts
MLP ETF Surges to Solidify Breakout
Is Lithium Turning the Corner?
Uranium ETF Breaks Out after Shallow Retracement
Two Breakout Leaders (TJX, VRSK)
Two Former Leaders with Pullbacks (AVGO, UHS)
GLD Gets Oversold Bounce and Short-term Breakout
TLT Extends Downtrend
Bitcoin Nears 100K
Note that I am using SharpCharts in this report and each image links to the corresponding SharpChart. Instead of RSI (10), I am showing %B (20,2) to identify oversold conditions. Instead of the 5/200 %Differential, I am using the PPO (10,200,0) to define the long-term trend. The PPO shows the percentage difference between two exponential moving averages, as opposed to simple moving averages. This is why I lengthened the short-term moving average from 5 to 10. The same signals apply: a move above +3% signals a long-term uptrend and a move below -3% signals a long-term downtrend.
ETFs with Leading Uptrends and No Setups
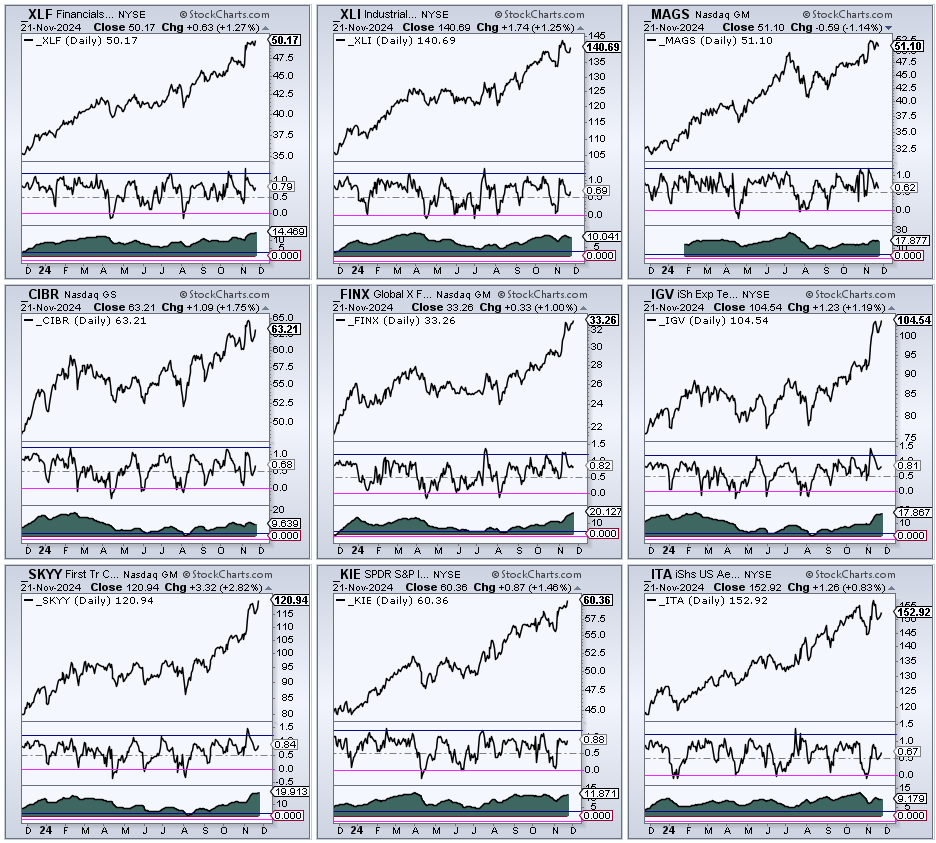
The CandleGlance chart below shows some of the leading ETFs that were not covered on Thursday or Friday. They are in leading uptrends, but I do not see any setups, such as an oversold condition or tradable pattern. These charts show %B in the first window and the PPO(10,200,0) in the lower window.
Finance SPDR (XLF)
Industrials SPDR (XLI)
Mag7 ETF (MAGS)
Cybersecurity ETF (CIBR)
FinTech ETF (FINX)
Software ETF (IGV)
Cloud Computing ETF (SKYY)
Insurance ETF (KIE)
Aerospace & Defense ETF (ITA)
Healthcare SPDR Gets Oversold Bounce
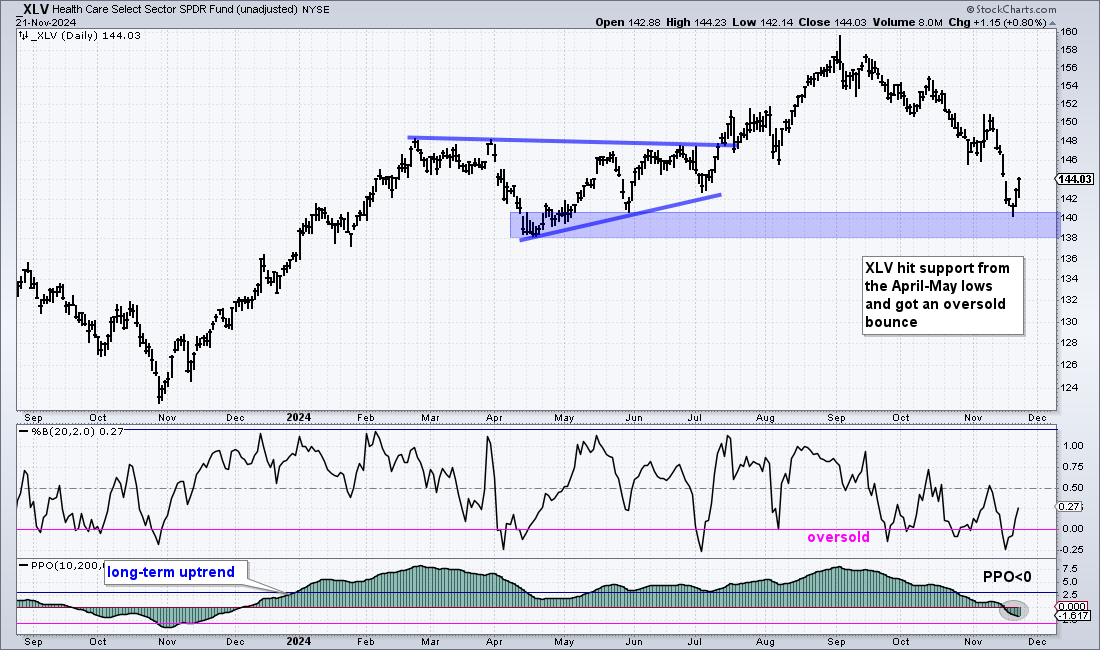
The Healthcare SPDR (XLV) is the weakest sector since September and one of the weakest stock-based ETFs as it fell from 158 to 144. Last week’s plunge was a reaction to the RFK Jr. appointment to the Department of Health and Human Services, which covers the FDA. This looks like an overreaction and the pharma lobby is still quite powerful. Regardless of the outcome, there are way too many variables at work to make a fundamental assessment.
On the price chart, XLV hit a support zone from the April-May lows and became the most oversold since early April. %B hit -.25% in both April and November, which marks an extreme oversold condition. The ETF bounced the last two days and is getting an oversold bounce. We are also seeing oversold bounces in IBB and XBI. It is hard to tell if this is the bottom because volatility is above average and it may take some time to stabilize. I also do not see a tradable pattern. All we have is an extreme oversold condition and support from prior lows.
Long-term, the PPO(10,200,0) shows the percentage difference between the 10 and 200 day EMAs (bottom window). It signaled an uptrend with the most above +3% in late December and moved into negative territory the last few days. A move below -3% would signal a downtrend.
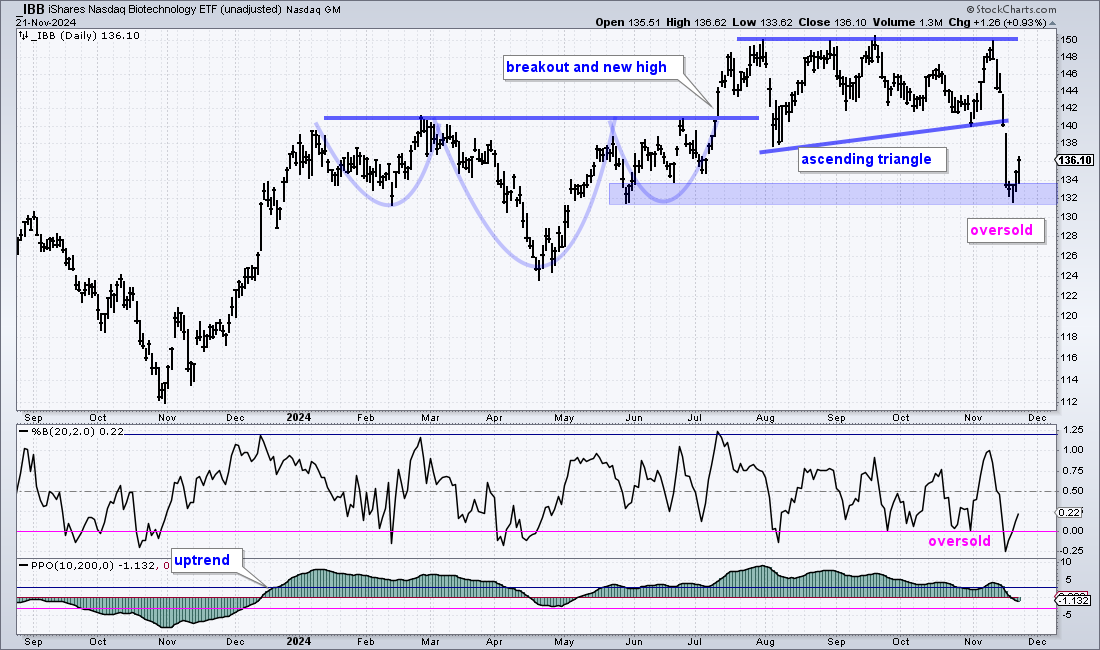
The next chart shows the Biotech ETF (IBB) with an Ascending Triangle that failed as the ETF plunged last week. IBB hit support from the May-June lows as %B hit -.25, its lowest level in over a year. The combination of oversold and support gave way to a bounce the last two days.
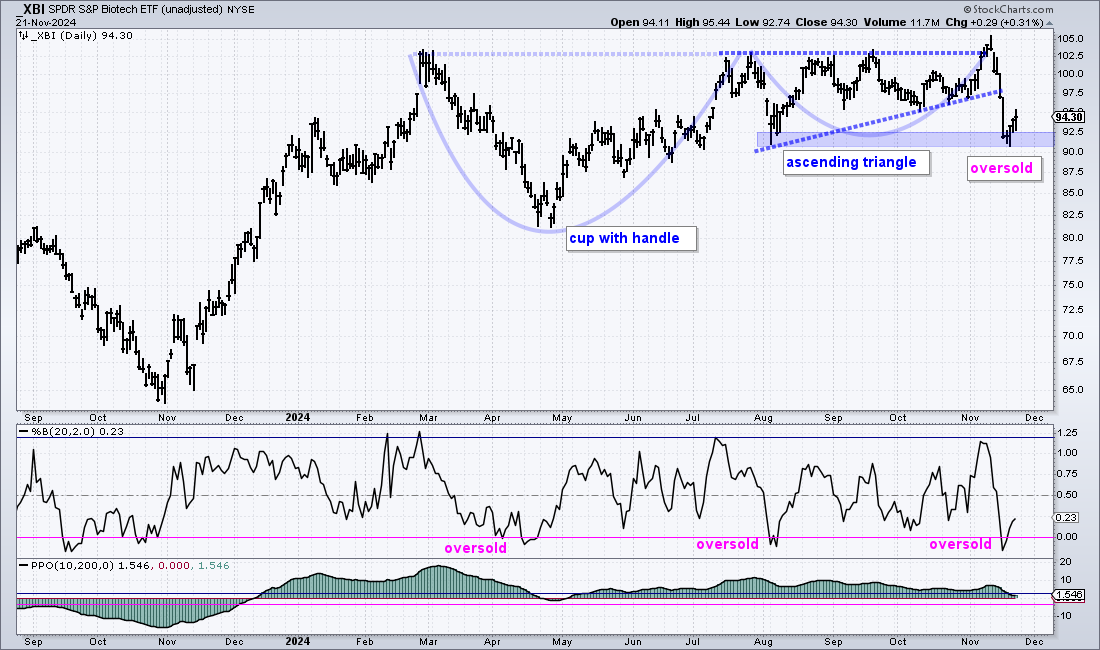
The next chart shows the Biotech SPDR (XBI) with a cup-with-handle and Ascending Triangle breakout on November 8th. And then the bottom fell out. XBI plunged to the August lows and became oversold as %B fell below zero. XBI is also getting an oversold bounce.
Medical Devices ETF Holds Wedge and Flag Breakouts
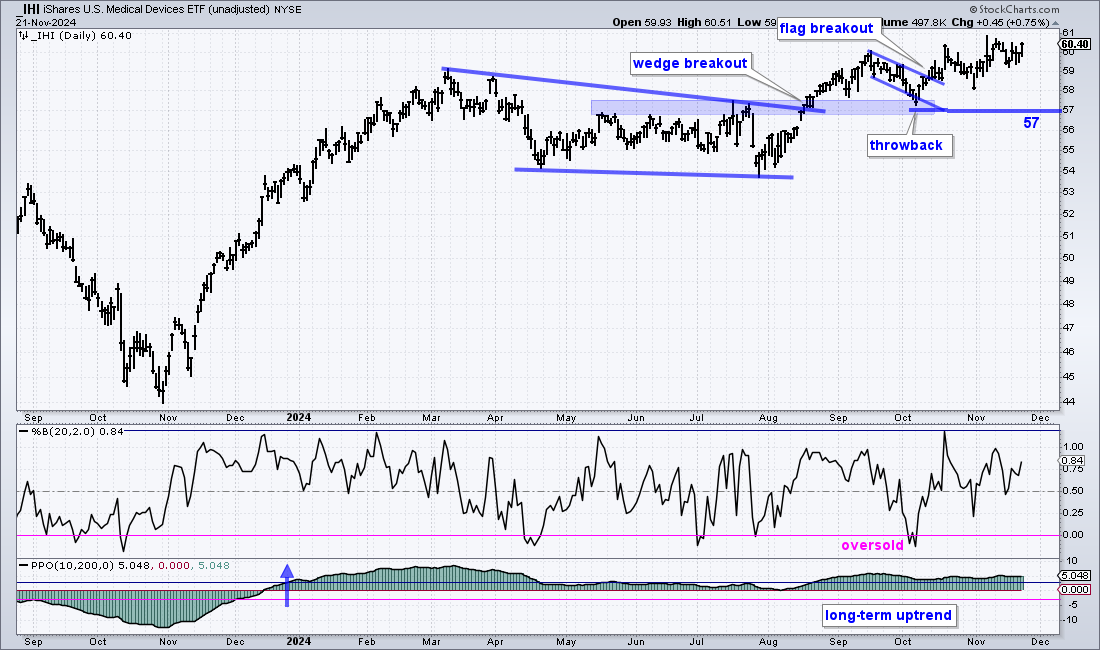
The next chart shows the Medical Devices ETF (IHI) with a wedge breakout in mid August, a throwback to the breakout zone in October and a flag breakout in mid October. IHI is holding up the best with the Healthcare sector.
I also use TraderView and started my subscription with the Black Friday sale. The discount is huge and renews every year during this big sale. Affiliate link below:
MLP ETF Surges to Solidify Breakout
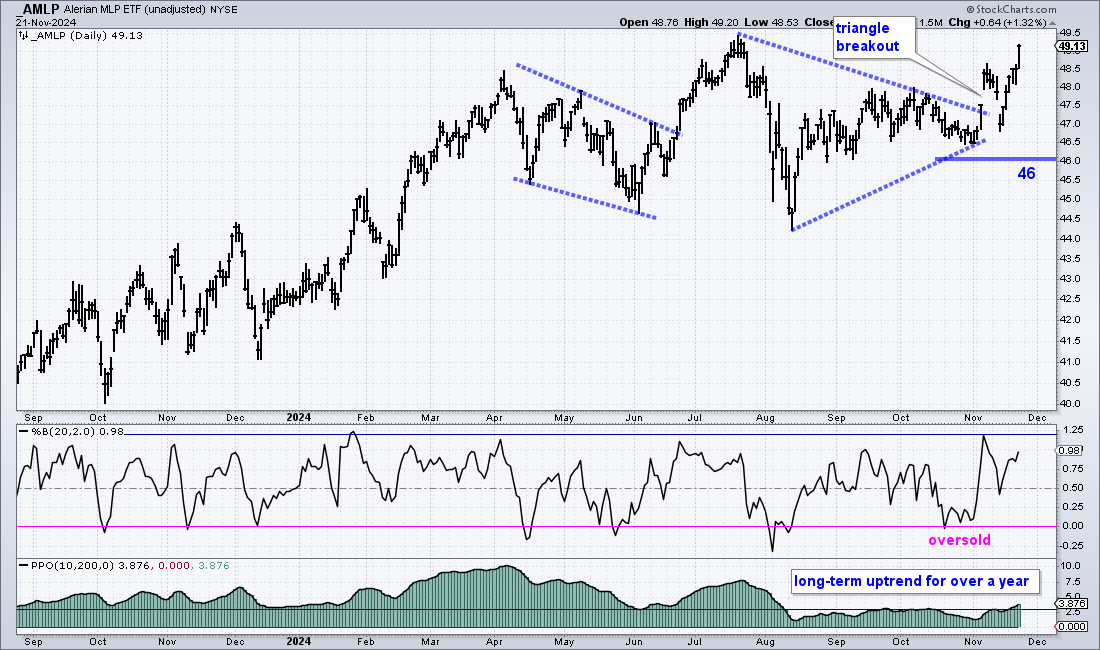
The next chart shows the MLP ETF (AMLP) with a long-term uptrend and a triangle breakout. Overall, the long-term trend is up as the ETF hit a new high in mid July and the PPO (10,200,0) is in bull mode. A large triangle consolidation formed from mid July to October and the ETF broke out with a surge on November 6th. There was a sharp pullback to 47 and then an immediate recovery to solidify the triangle breakout. I view this as bullish and would mark re-evaluation support at 46.
Is Lithium Turning the Corner?
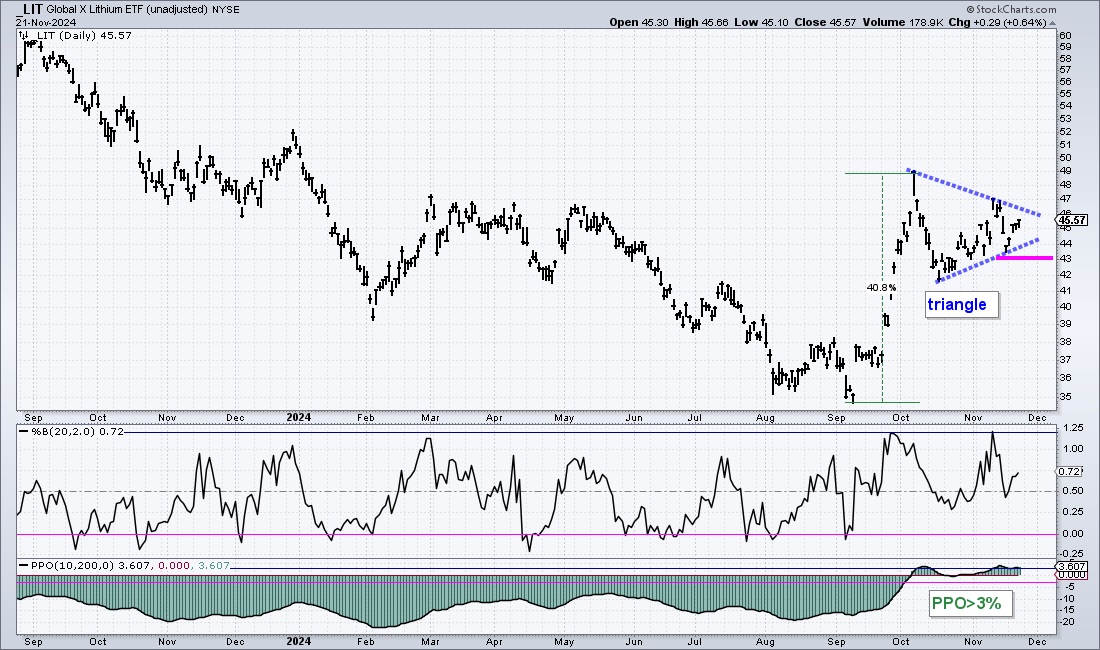
The next chart shows the Lithium ETF (LIT) with a 40% surge in September-October and the PPO(10,200,0) turning long-term bullish. The PPO (bottom window) crossed above +3% and this signals a long-term uptrend. LIT formed a triangle consolidation after the 40% surge and I view this as a bullish continuation pattern. A breakout at 47 would signal a continuation higher and I would then mark re-evaluation support at 43. This is a volatile ETF so prepare for a wild ride. There were also some fake-out breakouts in August 2022 and July 2023.
Uranium ETF Breaks Out after Shallow Retracement
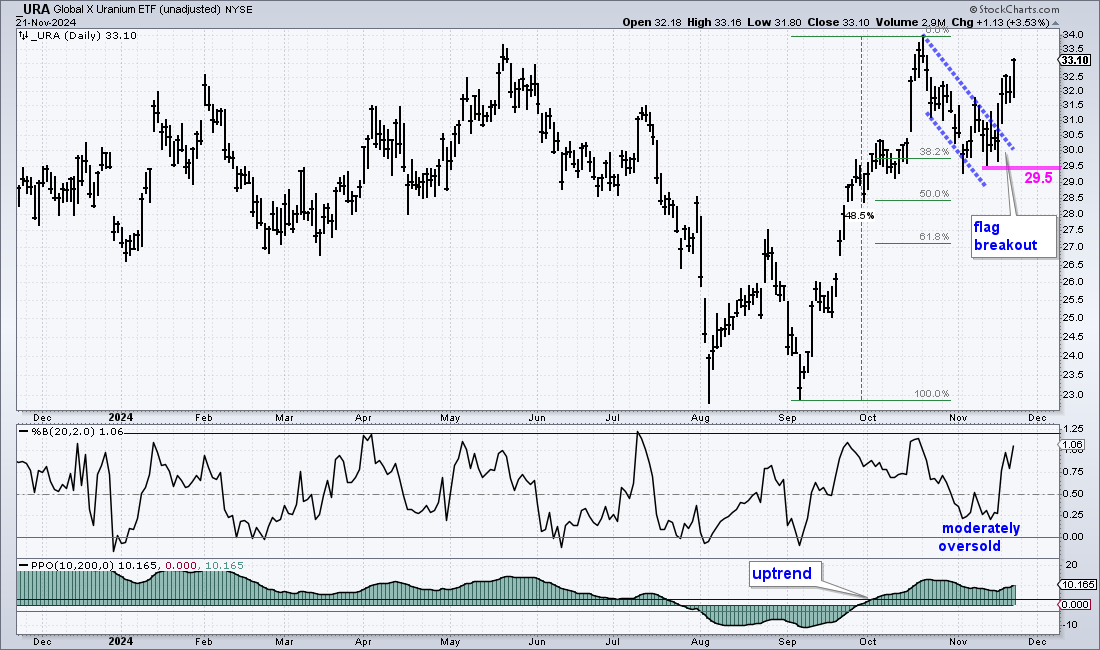
The Uranium ETF (URA) led the market higher from early September to mid October with a 48% surge. That right there tells you something about the volatility and risk in this ETF. URA then pulled back with a falling flag that retraced around 38% of this surge. %B also became moderately oversold with a move below .25 (twice). This was the setup and the ETF broke out with a surge the last four days. The long-term trend is up (PPO) and this breakout signals a continuation higher. New highs are expected. I would set a re-evaluation level at 29.50 (pink line).
Two Breakout Leaders (TJX, VRSK)
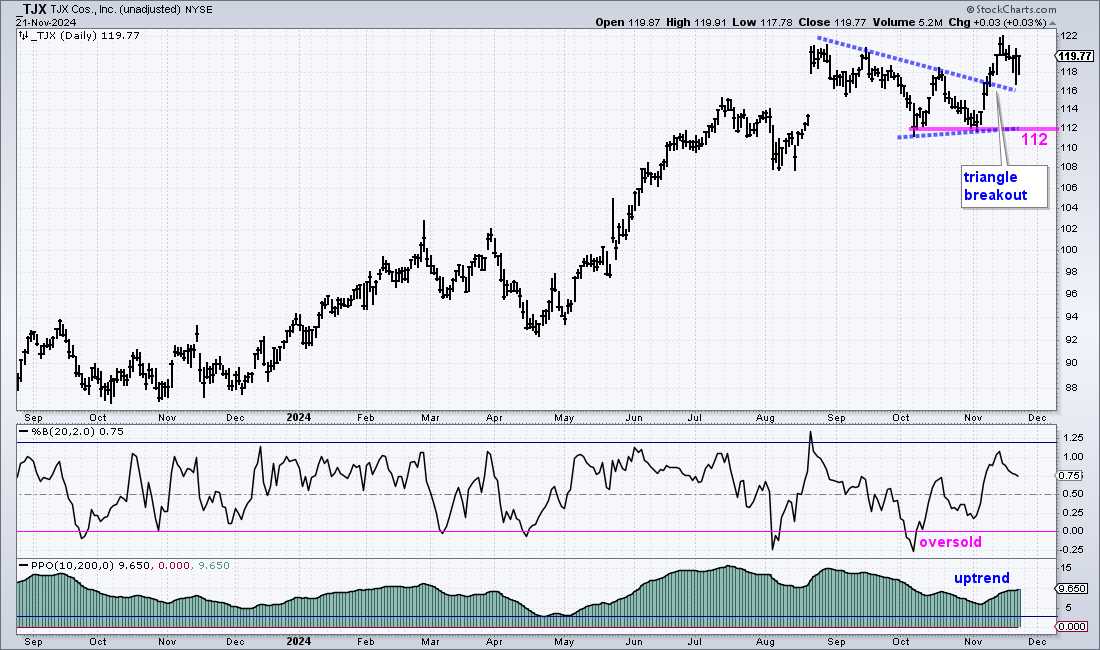
The next chart shows TJX Companies (TJX), which operates off-price department stores selling apparel and home accessories. TJX is a market leader because it is in a strong uptrend and it recorded a new high here in November. Most recently, the stock surged in August and then formed a triangle consolidation. I view this triangle as a bullish continuation pattern and TJX broke out with a strong move in early November. This breakout signals a continuation of the long-term uptrend. I am setting re-evaluation support at 112.
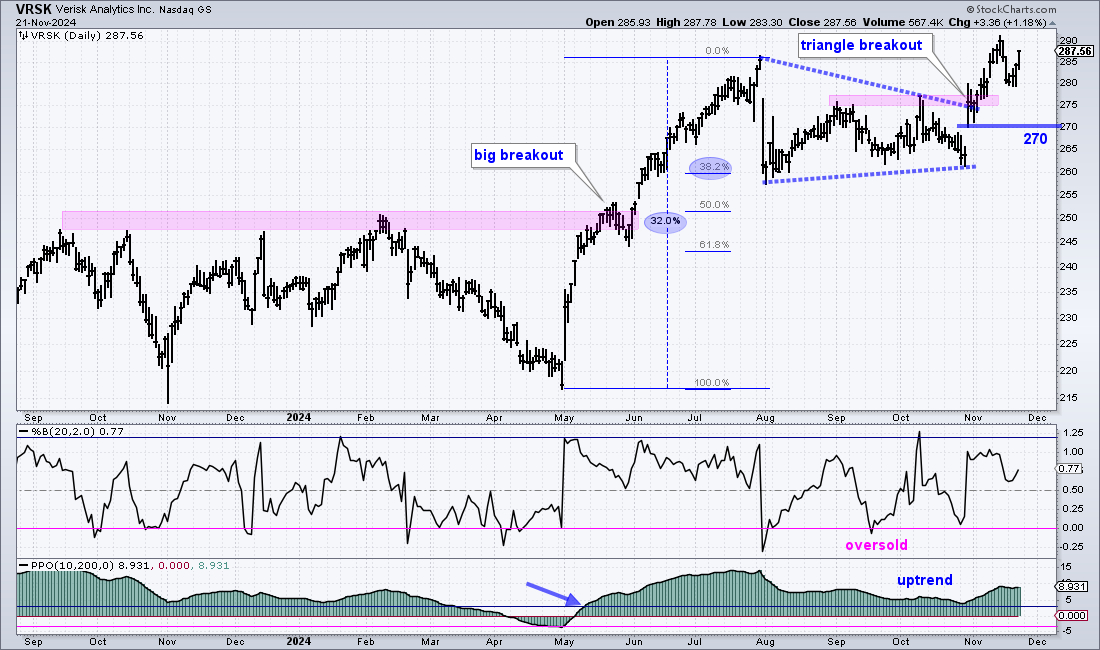
The next chart shows Verisk Analytics (VRSK), which provides data analysis and risk assessments to insurance companies. VRSK is in a leading uptrend because it hit a new high here in November and the PPO (10,200,0) is firmly positive (+8.9%). The stock surged 32% from late April to late July and then formed a triangle consolidation. VRSK retraced around 38% of the prior advance with this consolidation and then broke out with a gap-surge in late October. This breakout signals a continuation of the long-term uptrend. I would mark the first re-evaluation level at 270.
Two Former Leaders with Pullbacks (AVGO, UHS)
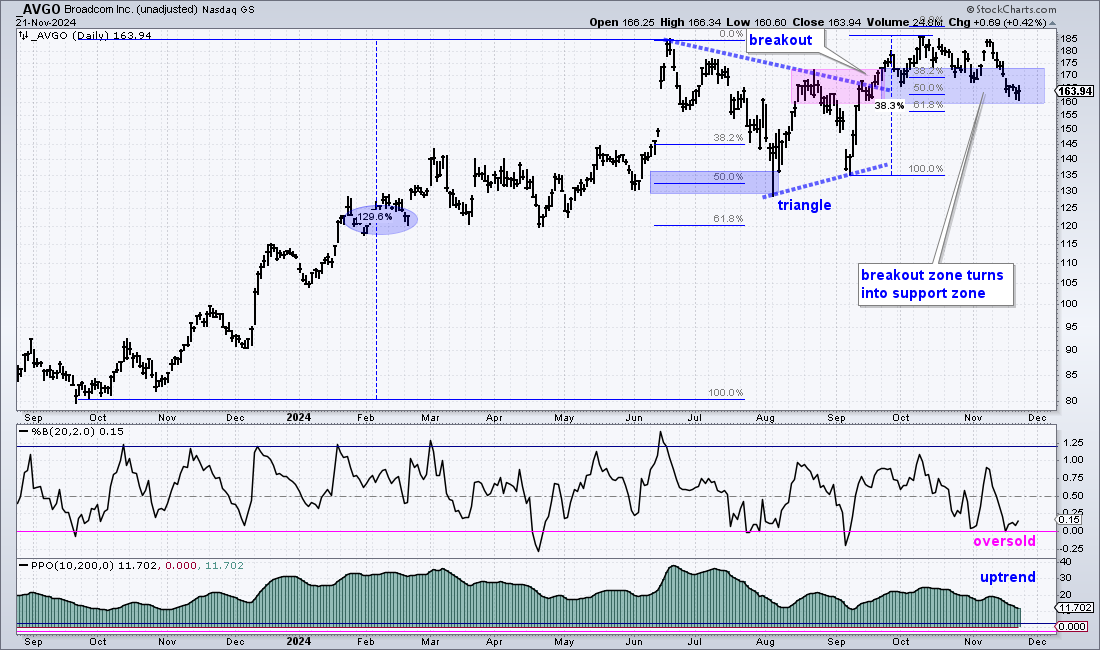
Semiconductors fell on hard times since the Semiconductor ETF (SOXX) peaked in July. SOXX is down around 18% since mid July and down 10% since mid October. Note that I covered SOXX and SMH on Tuesday (here). BroadCom (AVGO) is holding up better than SOXX. For example, the PPO (10,200,0) is at +11.7% for AVGO and slightly negative for SOXX. This means the 10-day EMA is well above the 200-day EMA for AVGO, but the 10-day EMA is below the 200-day EMA for SOXX.
On the price chart, AVGO hit a new high in June after 130% advance and then formed a large triangle that retraced 50%. AVGO broke out in late September, but did not follow through as industry group weakness weighed. Short-term, the stock advanced 38% in September and then retraced 50-61.8% with a decline back to the low 160s. I see the triangle breakout zone as a possible support zone (pink/blue shading). I also view the 50-61.8% retracement zone as an area that could give way to a bounce. Also notice that %B hit .01, which is close enough to zero for me to call it short-term oversold. Thus, we have a setup in AVGO. I do not see a nice triangle or flag. I will simply watch for some sort of short-term upside catalyst, such as a pop above 170.
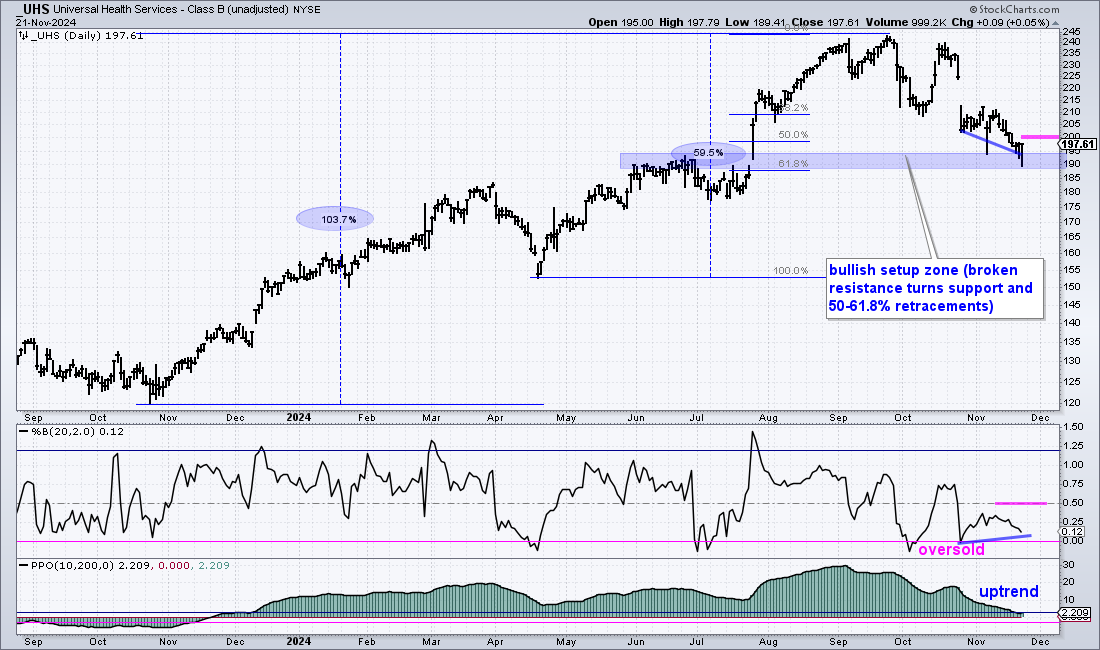
The next chart shows United Health Services (UHS) with a surge to new highs in September and a pretty sharp decline into November. Overall, the long-term trend is still up and I view this as a correction. While I do not see a robust falling wedge or tradable pattern, the stock is trading in a bullish setup zone in the 190 area. This zone stems from broken resistance, which turns support, and the 61.8% retracement line.
%B became oversold twice in October and is now forming a possible bullish divergence. This occurs when price forges a lower low (late October to now) and %B does not become oversold again (higher low). Downside momentum is waning. An upturn and breakout at .50 would confirm this divergence in %B. I am also marking a tight short-term resistance level at 200 on the price chart. Watch this level for the first signs of an upturn.
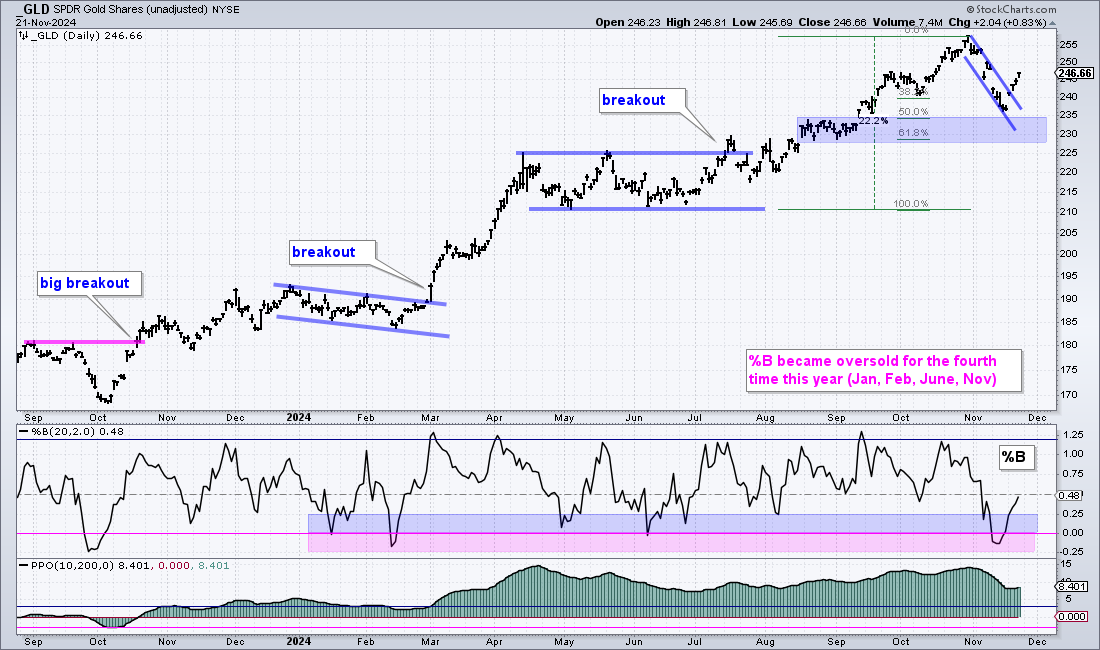
The Gold SPDR (GLD) got slammed the first two weeks of November and became oversold for the fourth time this year. Note that I am using %B instead of RSI. It is a little more sensitive. The pink line is at 0 and this denotes an oversold condition. On the price chart, GLD surged 22% from June to October and then retraced around 50% with a falling flag. GLD held just above the bullish setup zone (blue shading) and broke out with a bounce the last four days. This breakout is short-term bullish.
TLT Extends Downtrend
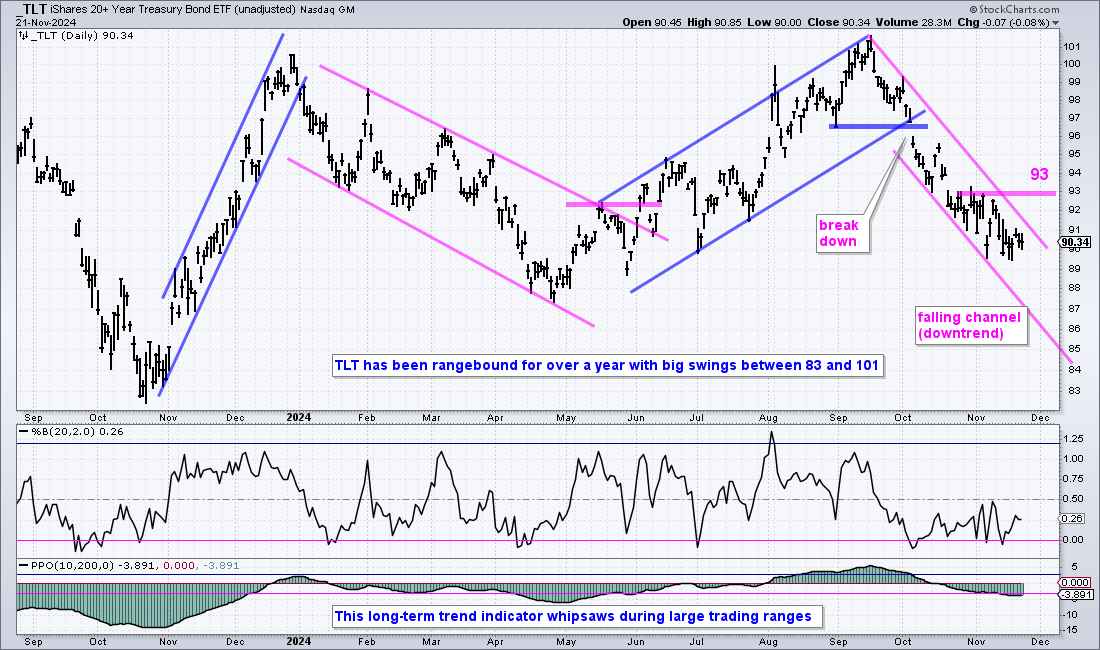
There is no change in the 20+ Yr Treasury Bond ETF (TLT). TLT remains in a downtrend since the breakdown in early October. Resistance is set at 93. Overall, TLT has been rangebound between 83 and 101 for over a year. There are four big swings and the current swing is down after the October reversal (break down). The rate of descent is fairly steep and I am using the late October close to mark resistance at 93.
Bitcoin Nears 100K
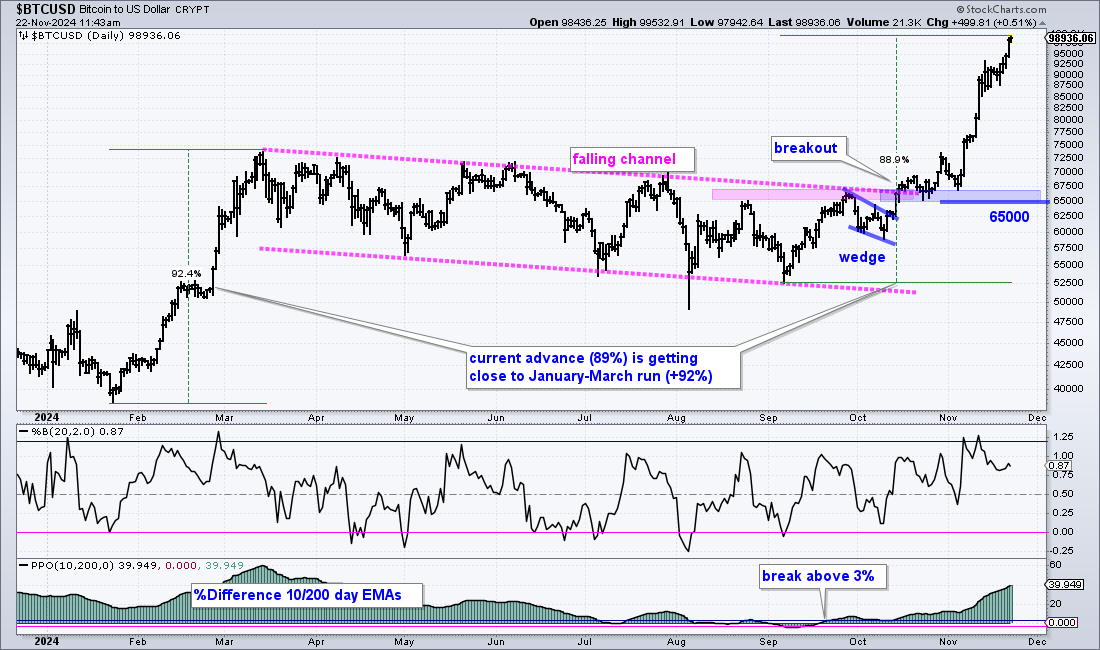
There is no change on the Bitcoin chart as it broke out in the second half of October and surged towards the $100,000 mark. I am not going to call a top in this runaway train, but it is getting frothy and ripe for a rest. Support is set at 65000. Overall, BTC advanced 92% from late January to mid March, declined with a long falling channel and broke out with a surge in mid October. Price surged in a parabolic manner the last few weeks. Notice that the current advance (89%) is almost the same as the January-March advance (92%).