The next report will be posted on Thursday morning, December 12th.
Report Headlines
Market Remains in PullBack Mode
10-yr Treasury Yield Surges
SPY Holds Near High as QQQ Surges
S&P SmallCap 600 SPDR Pulls Back
A Miserable Failure for ITB
Gold Forms Potentially Bearish Wedge
ITA Becomes Oversold within Strong Uptrend
Network Appliance Goes for Triangle Breakout
Workday Resumes Leadership Role with Breakout
I will post a video on Wednesday morning (before 8AM ET)
Market Remains in PullBack Mode
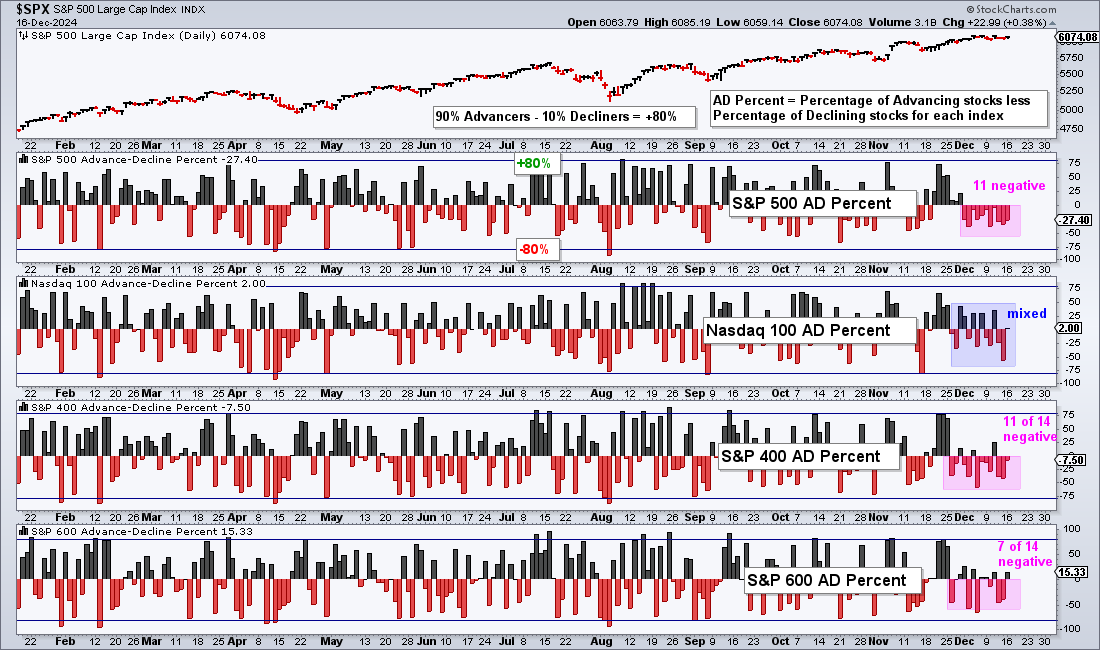
Stocks remain in pullback mode with short-term breadth showing more declining stocks than advancing stocks over the last three weeks. The chart below shows Advance-Decline Percent for the S&P 500, Nasdaq 100, S&P MidCap 400 and S&P SmallCap 600. AD% measures daily up/down participation within each index. SPX AD% has been negative 11 days in a row, which means there were more declining stocks each of the last 11 days. NDX AD% is mixed, while MID AD% and SML AD% show deeper dips on the negative side. Overall, this means the broader market is in pullback mode as most stocks declined over the last 2-3 weeks.
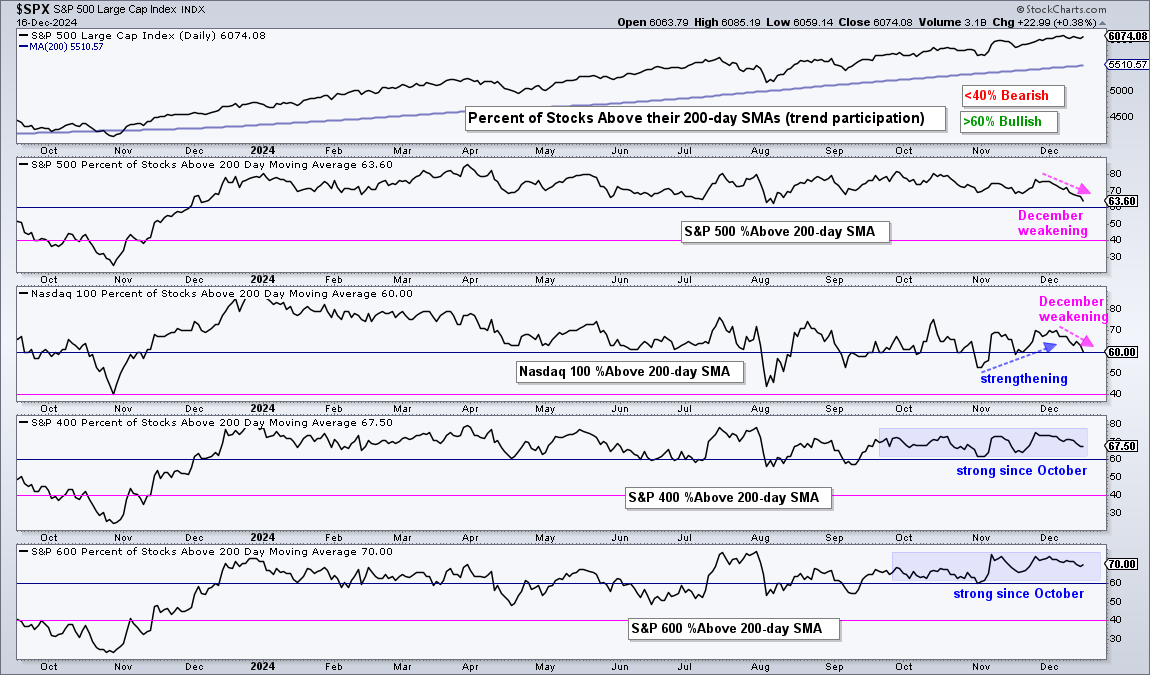
The next chart shows the percentage of stocks above their 200-day SMAs for each index. SPX %Above 200-day fell from 77% in late November to 63.6% in mid December, while NDX %Above 200-day fell from 70% to 60%. This means fewer stocks are holding above their 200-day SMAs. While short-term negative, I do not see enough deterioration to turn long-term bearish on this indicator. The trouble starts when they break 50% and a bearish signal triggers when they break 40%.
The lower window shows MID %Above 200-day and SML %Above 200-day SMA holding up rather well the last few weeks. They are both below their late November highs, but above 65%. This means small-caps and mid-caps are holding up better during this market pullback. This is not evident on the charts because QQQ hit a new high, SPY is near a new high and the S&P SmallCap 600 SPDR (IJR) is 4% below its late November high.
10-yr Treasury Yield Surges
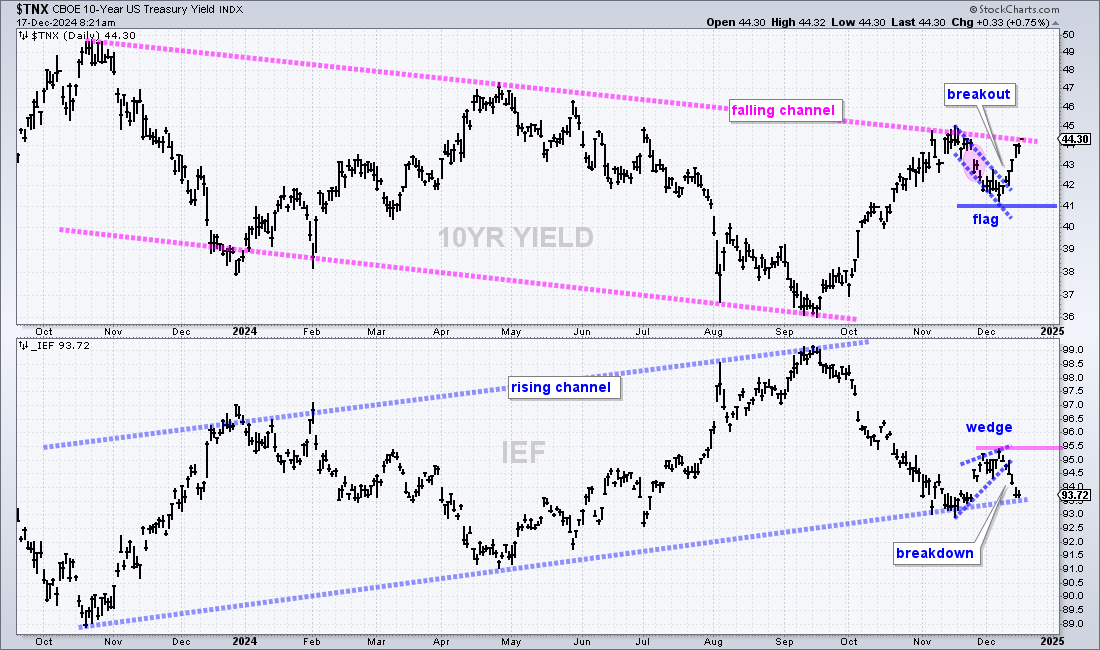
The next chart shows the 10-yr Treasury Yield ($TNX) in the top window and the 7-10 Yr Treasury Bond ETF (IEF) in the lower window. $TNX fell in the second half of November and appeared to be reversing within a large falling channel. The bond vigilantes had other ideas as TNX sharply reversed last week with a falling flag breakout. This breakout move was quite strong and follow through would push yields out of the long-term falling channel. I would then target a move to 5% (50 on the chart). Such a move could provide a headwind for stocks, especially small-caps, housing and banks.
SPY Holds Near High as QQQ Surges
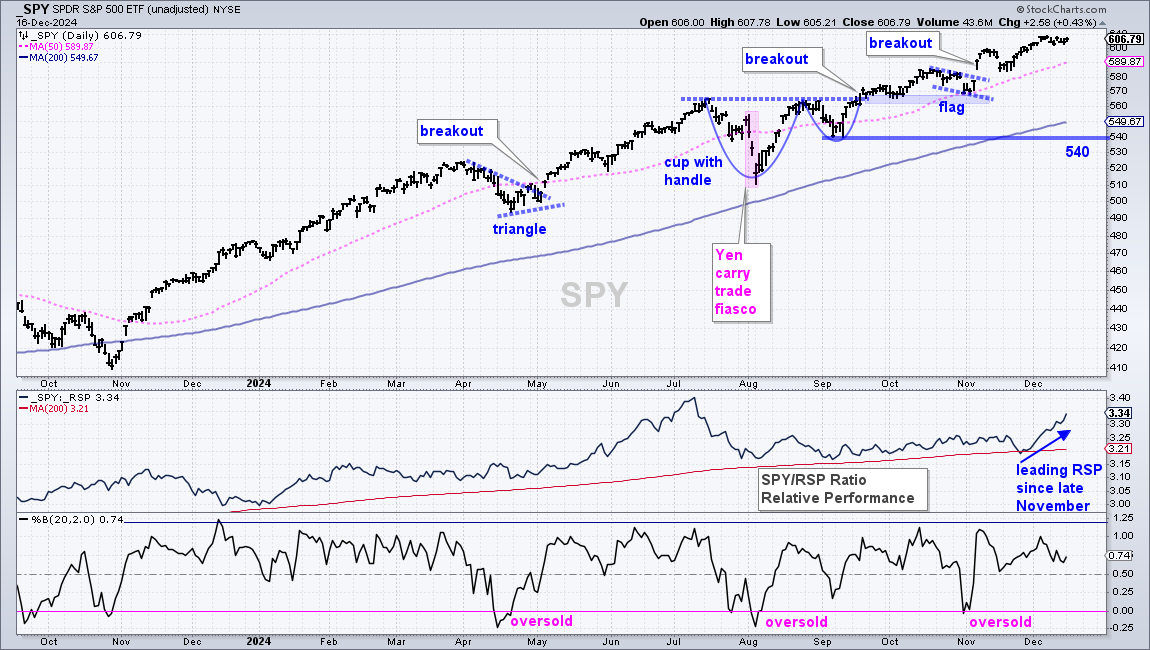
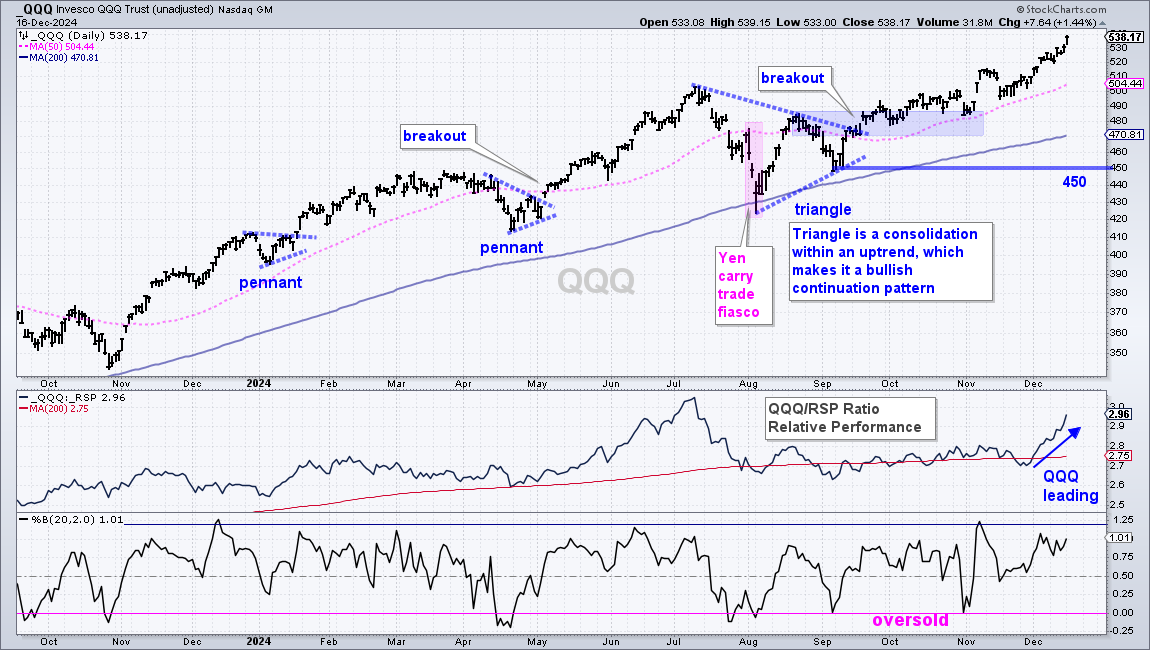
There is no change on the SPY chart. The long-term trend is up and SPY is trading near a new high. The ETF hit a new high on December 6th and then stalled with a small pennant. I am not drawing this pattern because it is too small for my trading style. Overall, I do not see setup for SPY. The stock is simply in an ongoing uptrend and leading the S&P 500 EW ETF (RSP). The middle windows shows the SPY/RSP ratio moving sharply higher the last three weeks.
There is no change in the QQQ chart as the ETF surges to another new high. The July-August triangle was the most recent pattern at work and the ETF is extending on this breakout.
S&P SmallCap 600 SPDR Pulls Back
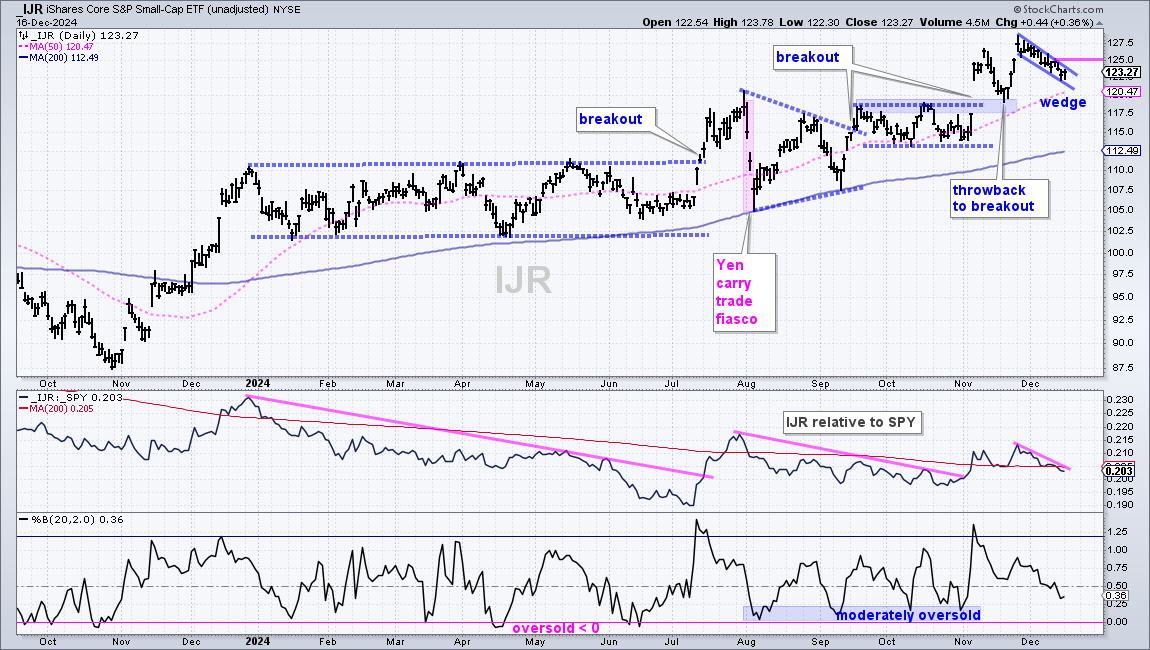
The S&P SmallCap 600 SPDR (IJR), S&P 500 EW ETF (RSP) and Russell 2000 ETF (IWM) have the same pattern at work over the last few weeks: a pullback after the surge and new high in November. The chart below shows IJR with a surge in late November and a falling wedge the last three weeks. I view this as a pullback within a long-term uptrend and a breakout at 125 would be bullish. The middle window shows IJR relative to SPY. IJR started to lead with the July surge, but the price-relative is largely flat since this surge. It is a tall order to outperform a MAG7 led SPY.
A Miserable Failure for ITB
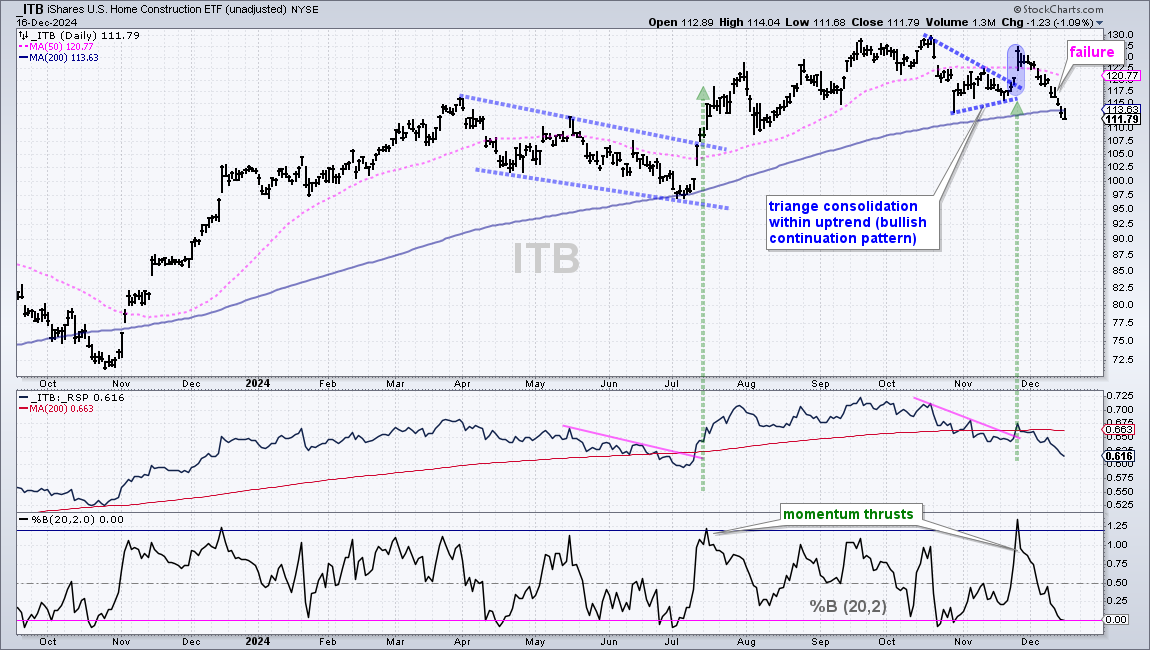
There is some concern with the Home Construction ETF (ITB) because housing remains an important part of the economy. ITB broke out with a momentum thrust in late November and the ITB/RSP ratio also moved back above its 200-day SMA (green arrow). This breakout was similar to the mid July surge and breakout. Note that small-caps also surged in mid July. ITB failed to hold the late November breakout as it fell below the October low and 200-day SMA. The price-relative (ITB/RSP ratio) also sank. Housing is not looking good and this is a possible negative for small-caps.
Hard Time for Hard Assets
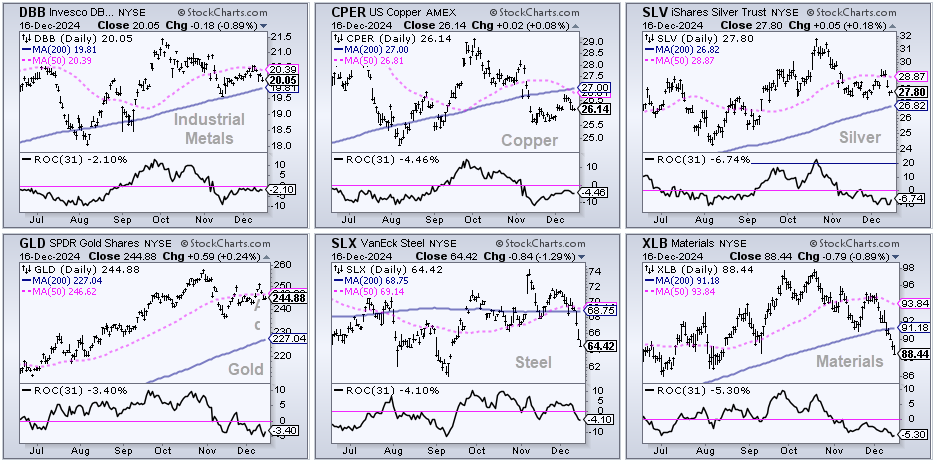
Before looking at gold, note that hard assets are having a hard time. The DB Base Metals ETF (DBB) and Copper ETF (CPER) are weak, the Silver ETF (SLV) failed to hold its breakout, the Steel ETF (SLX) got clobbered the last few weeks and the Materials SPDR (XLB) plunged below its 200-day SMA. The CandleGlance chart below shows these ETFs with the 31-day Rate-of-Change to measure performance since November. All are down. I realize that gold marches to the beat of its own drummer, but the backdrop for hard assets does not look good. Also note that there are a slew of economic reports on deck this week and the Fed makes its policy statement on Wednesday. These macro events could move the Dollar, stocks, bonds and gold.
Gold Forms Potentially Bearish Wedge
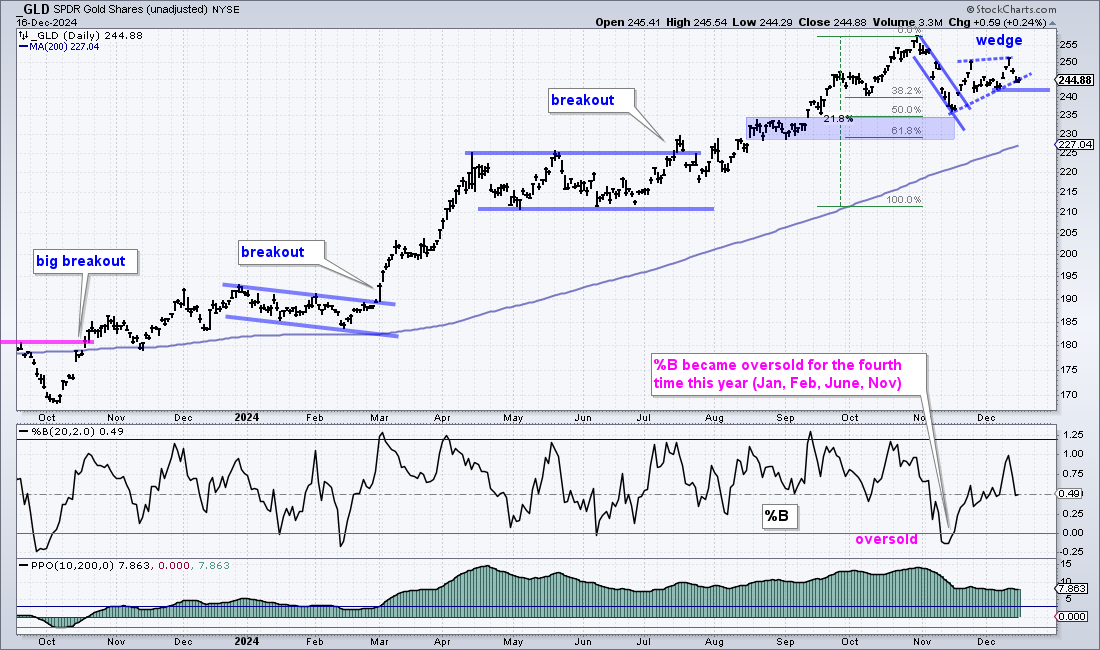
The chart below shows the Gold SPDR (GLD) in a long-term uptrend with a new high in late October. GLD corrected with a falling flag into November, reversed near the 50% retracement and broke out with a surge above 245. This breakout is bullish and holding. My concern here is that a bearish wedge is taking shape. The December low marks support at 242 and a break here would argue for a continuation of the early November decline. This would target a move to the rising 200-day SMA (227-230).
ITA Becomes Oversold within Strong Uptrend
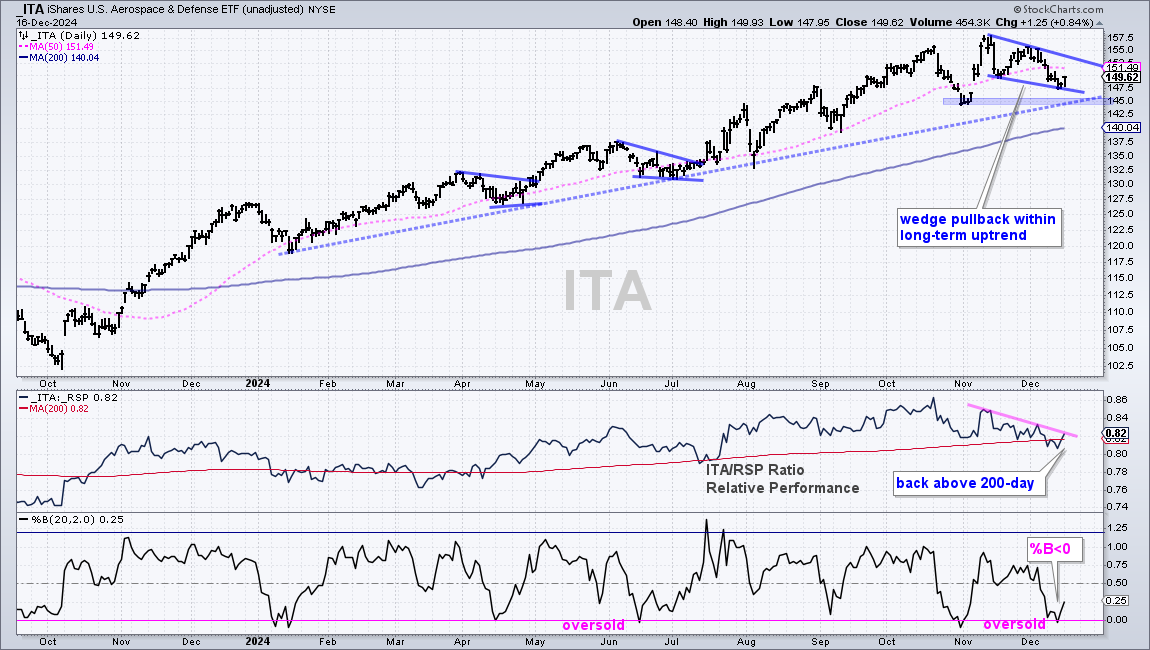
The next chart shows the Aerospace & Defense ETF (ITA) becoming oversold as %B dipped below 0 last week. This creates an oversold condition within a long-term uptrend. ITA hit a new high just after the election and then fell back with a falling wedge correction into December. I view this as a correction within the uptrend and a bullish continuation pattern. The middle window shows the ITA/RSP ratio hitting a new high in October and falling below its 200-day SMA in December. It turned up the last two days and is back above its 200-day SMA. This means relative strength could be returning.
Network Appliance Goes for Triangle Breakout
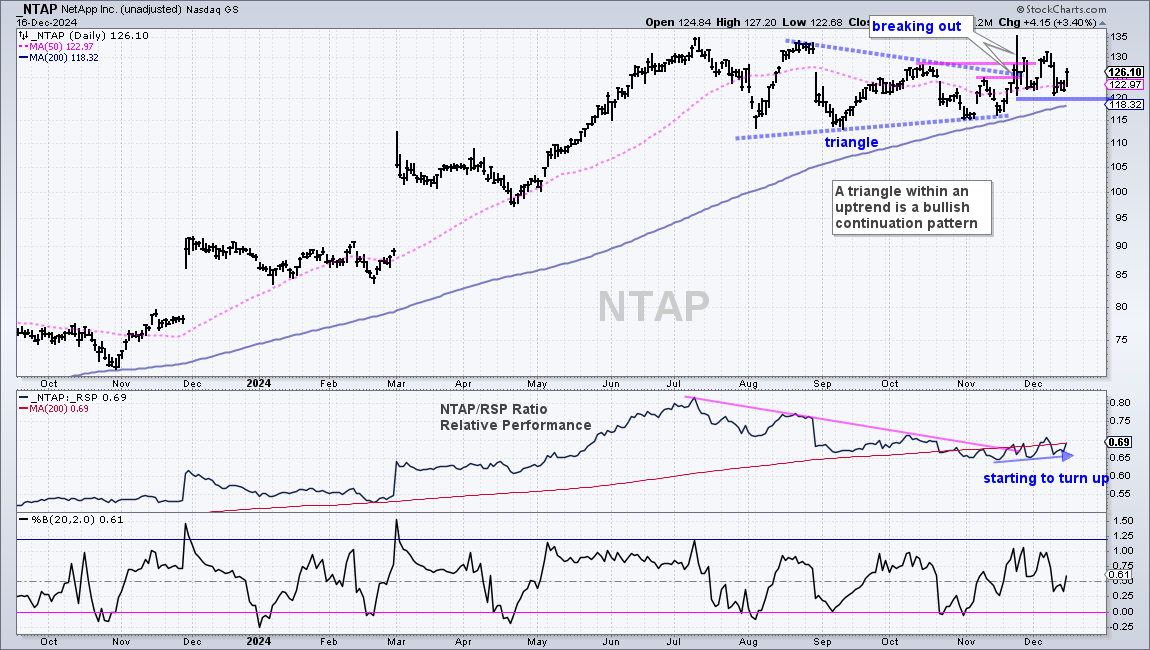
The next chart shows Network Appliance (NTAP), which is part of the Nasdaq 100 Next Gen ETF (QQQJ) and Technology SPDR (XLK). The company provides software, systems, and services to manage data infrastructure in the cloud. On the price chart, NTAP led the market into July with a strong run to new highs and then moved into a consolidation phase. A triangle formed over the last few months and I view this as a consolidation within an uptrend, which is a bullish continuation pattern. NTAP is attempting a breakout with two surges in late November. NTAP fell sharply last week and recovered to established support at 120. This is the first level to watch for a failure. The middle window shows the NTAP/RSP ratio starting to turn up, which means the stock may be poised to outperform again.
Workday Resumes Leadership Role with Breakout
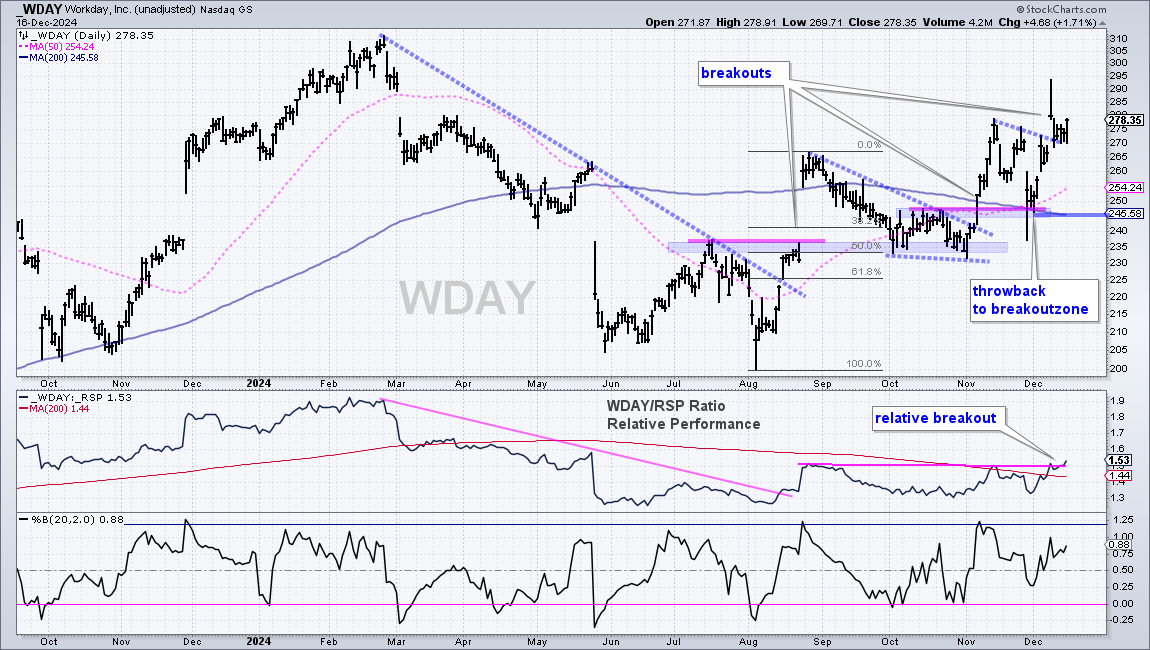
The next chart shows Workday (WDAY), which is part of the Nasdaq 100 ETF (QQQ) and Cloud Computing ETF (CLOU). Workday provides cloud-based application software and services. WDAY led the market with a run to new highs in February, but then embarked on an extended decline back to the October-November lows. WDAY found support in the low 200s and broke out with a big move in August. A falling wedge correction unfolded into October and the stock broke out again in early November. After a throwback to the breakout zone in early December, the stock is on the move again with a breakout surge above 270. A lot can happen between 280 and 245, but I view this breakout as bullish with first support marked at 245. The middle window shows the WDAY/RSP ratio turning up in December and breaking above its prior highs.
")