")
I will post a report and video on Monday, December 23rd.
Report Headlines
- Broad Selling Pressure Hits
- Treasury Yields and Stocks
- S&P 500 Advance-Decline Percent Extends Streak
- S&P 500 Becomes Most Oversold Since April
- Beware of the Dead-cat Bounce
Stocks Get Hit Hard
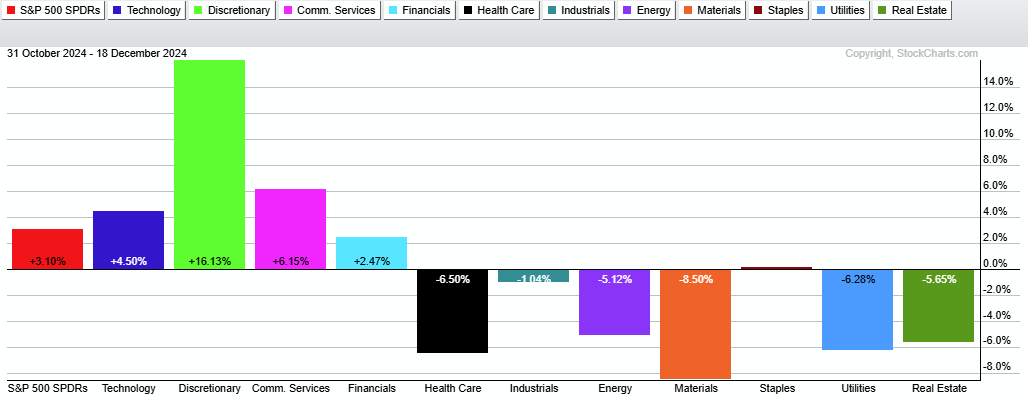
Stocks were pummeled after the Fed policy statement as over 90% of issues on the S&P 1500 declined on the day. All 11 sectors were down with the Consumer Discretionary SPDR (XLY) leading the way (-4.51%) and the Healthcare SPDR (XLV) holding up the best (-1.36%). The PerfChart below shows sector performance since November 1st. SPY is up, but six of the eleven sectors are down, including the Industrials SPDR (-1.04%). The market is split at best.
The market reacted to the possibility that interest rates will be higher for longer. The 10-yr Treasury Yield surged the last eight trading days and broke back above its 40-week SMA. Today’s report will start with the 10-yr Treasury Yield and the S&P 500 EW ETF (RSP). We will then look at oversold conditions in the S&P 500 and key breadth levels to watch for a bounce.
Holiday Schedule
Note that I will post a comprehensive report and video on Monday. There will be no reports between Christmas and New Years (25-Dec to 1-Jan). I will resume on January 2nd with a report and video.
- Monday, December 23th: Report and Video
- Wednesday, December 25: Christmas
- Wednesday, January 1: New Years Day
- Thursday, January 2: Report and Video
Treasury Yields and Stocks
The 10-yr Treasury Yield is breaking out of a large falling wedge and this breakout looks similar to the breakout in early July 2022. The July 2022 breakout foreshadowed a move to 5% and stocks were hit with strong selling pressure from August to October 2022. History could be repeating itself.
The chart below shows the 10-yr Treasury Yield with the S&P 500 EW ETF (RSP), which is perhaps more sensitive to interest rates than the S&P 500 SPDR (SPY). RSP struggled from January 2022 to October 2023 as the 10-yr Treasury Yield surged from low levels (1.5%) to relatively high levels (above 4%). Of note, there was a falling wedge breakout in early July 2022 and TNX extended to 5% in October 2023. This breakout and surge coincided with a three month decline in RSP (August to October). After peaking near 5%, the yield fell to the 4% area in early December 2023 and broke the 40-week SMA. This decline and break coincided with a breakout in RSP.
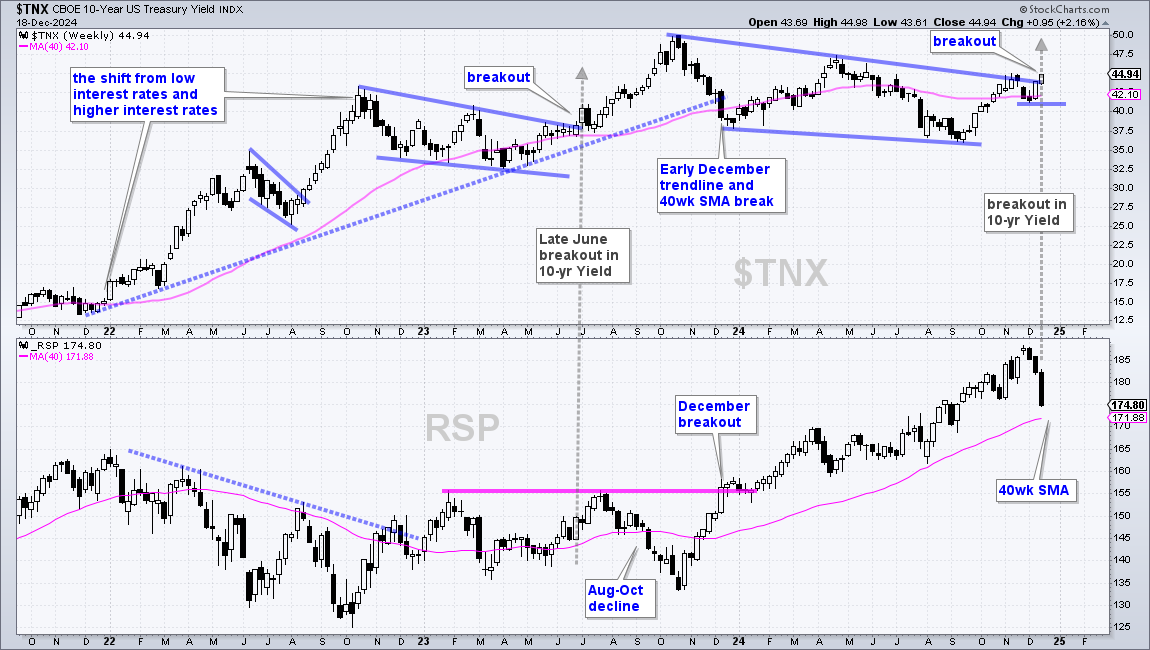
The 10-yr Treasury Yield fell from November 2023 to November 2024 and the S&P 500 EW ETF (RSP) advanced some 30%. This dynamic is shifting because the 10-yr Treasury Yield is breaking out of a long falling wedge to signal a continuation of its long-term uptrend. The next target is around 5% (50 on the chart). RSP fell sharply the last three weeks and is trading just above its 40-week SMA. RSP is short-term oversold right now and ripe for a bounce, but further strength in the 10-yr Treasury Yield would likely lead to a break of the 40-week SMA.
S&P 500 Advance-Decline Percent Extends Streak
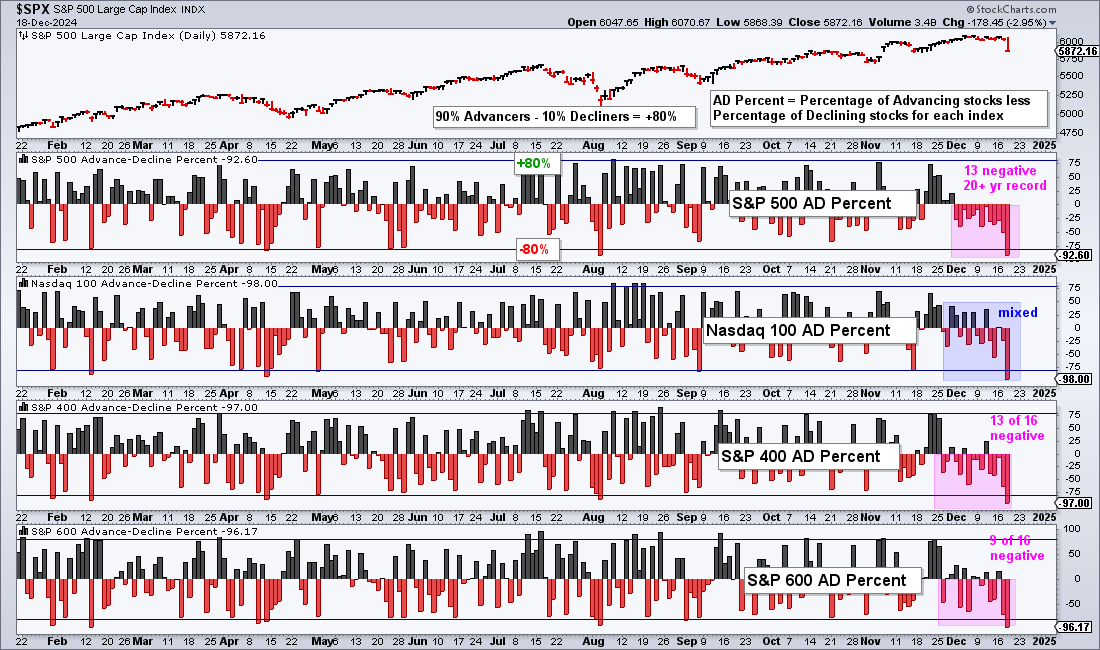
Advance-Decline Percent for the S&P 500 extended its negative streak to 13, which is the longest in over 20 years. AD% is the percentage of advancing stocks less the percentage of declining stocks. The negative readings were relatively tame until SPX AD% ($SPXADP) dipped to -50% on Tuesday and -92.6% on Wednesday. This means 96.3% of components were down and 3.7% were down on the day. The market threw out the baby with the bath water and stocks are very oversold right now.
S&P 500 Becomes Most Oversold Since April, and Could Remain So
We will next look at four oversold indicators: two momentum oscillators and two short-term breadth indicators. Stocks are oversold, but history suggests that they could remain oversold. We will show current oversold conditions and they identify the key levels to watch for an upside reversal. This section continues for subscribers.
S&P 500 Becomes Most Oversold Since April
The next chart shows SPY with four indicators to measure oversold conditions. First, the percentage of S&P 500 stocks above the 50-day SMA becomes oversold with a dip to 30% or lower and thee percentage above the 20-day SMA becomes oversold with a dip to 20% or lower. These are short-term breadth indicators. For price, RSI(10) becomes oversold with a dip below 30 and %B becomes oversold with a dip below 0. Three of the four are oversold right now and this is the most since April. Note that the pink lines show when at least two of the four are oversold.
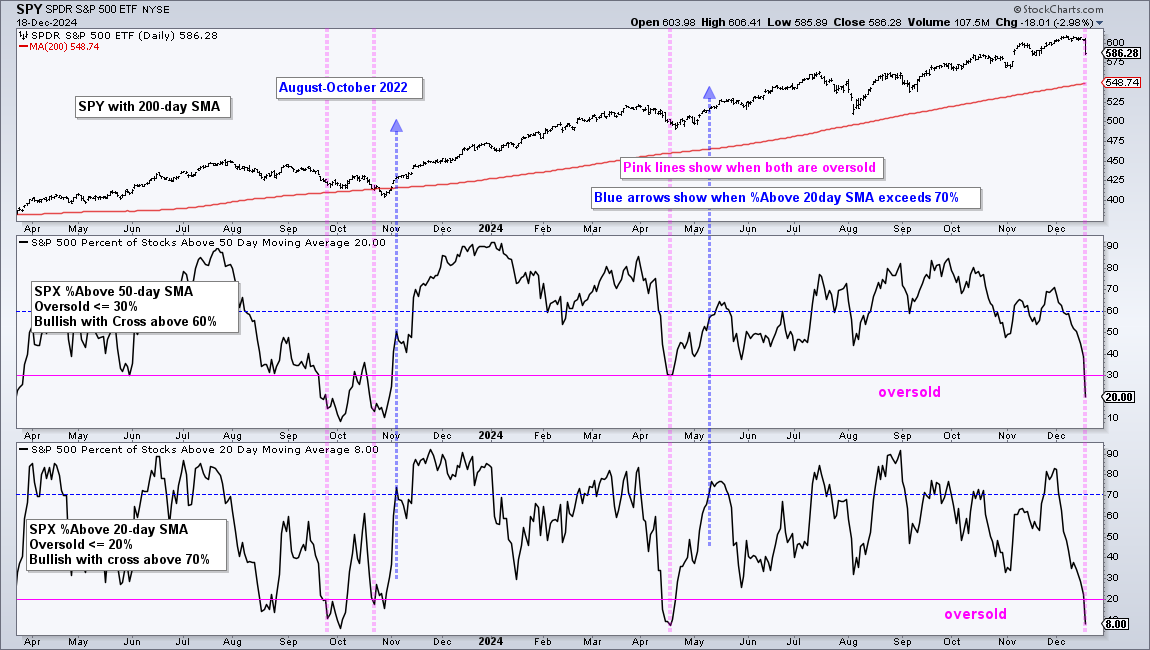
Oversold is a double-edged sword. Oversold conditions reflect strong selling pressure, but excessive selling pressure can lead to a bounce. First, oversold conditions are present because of strong selling pressure. With the current readings, we have seen the strongest selling pressure and weakest breadth readings of the year. Only 20% of S&P 500 stocks are above their 50-day SMAs and only 8% are above their 20-day SMAs. Second, stocks do not always bounce right away. Oversold conditions in early August led to an immediate bounce, but stocks continued lower after becoming oversold in mid April. The bounce materialized in late April.
Beware of the Dead-cat Bounce
So we are oversold and the 10-yr Treasury Yield is breaking out. This is eerily similar to the summer of 2022. The 10-yr Treasury Yield broke out of a falling wedge in early June (around 4%) and surged to 5% by October. Stocks were hit with strong selling pressure in the first half of August 2022 and became oversold. They got an oversold bounce in the second half of August, but continued lower in September and October.
How can we distinguish between a strong oversold bounce and a dead-cat bounce? Chartists can quantify strength by using a bullish threshold to identify a strong increase in upside participation. The chart below focuses on the two breadth indicators. They both became oversold in September and stocks bounced, but the bounce was weak. Once oversold, I place bullish thresholds at 60% for SPX %Above 50-day SMA and 70% for SPX %Above 20day SMA. A bullish signal triggers when one of these indicators exceeds the bullish threshold.
Stocks became oversold in September and bounced in October, but neither breadth indicator cleared its bullish threshold. Both indicators became oversold again in October and stocks bounced in November. This time, SPX %Above 20-day SMA exceeded 70% to show a strong increase in upside participation. Stocks again became oversold in mid April (pink line). It took a couple weeks for stocks to find their footing and SPX %Above 20-day SMA surged above 70% in early May.
What now?
Stocks are both oversold and under pressure. The decline in the S&P 500 is like a boxer getting hit with a right hook and falling to the floor. Rarely, does the boxer jump right up and begin punching. Instead, the boxer slowly comes to his feet and stabilizes as the standing eight count begins. Stocks were hit hard and may need some time to stabilize. I will be watching for a move above the breadth thresholds to signal that stocks are ready to resume higher. Until then, stocks are in correction mode and the pressure remains.