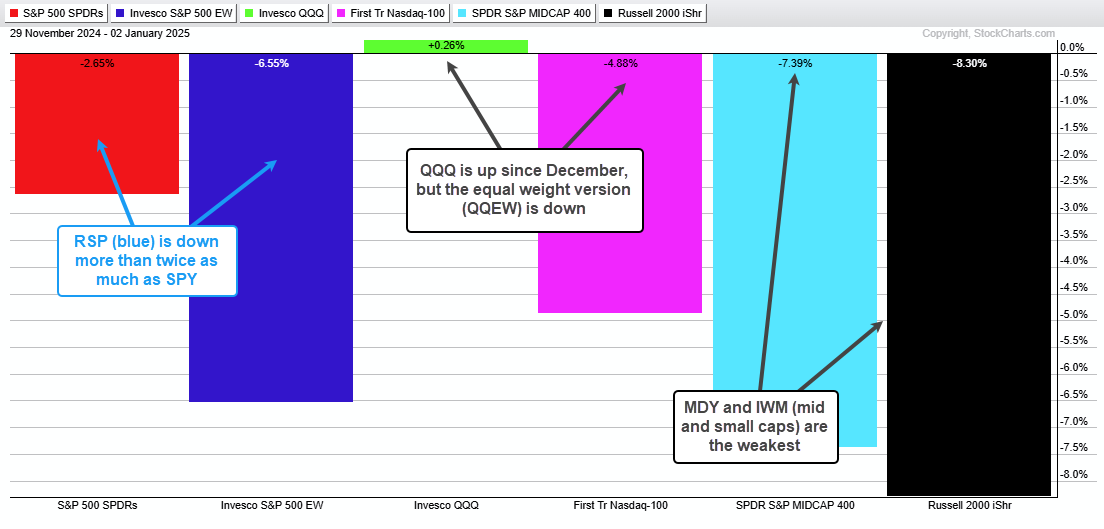
2024 was a good year for stocks, but December was a rough month for the average stock. The S&P 500 EW ETF (RSP), S&P MidCap 400 SPDR (MDY) and Russell 2000 ETF (IWM) were down between six and eight percent in December. Their December declines erased their gains from November. Thus, the Trump bump did not hold for small-caps and mid-caps. The PerfChart below shows performance since December. QQQ is the only ETF with a gain (thanks to the MAG7). The S&P 500 EW ETF (blue) is down more than twice as much as the S&P 500 SPDR (red).
These ETFs are still in long-term uptrends and the December declines are viewed as pullbacks within these bigger uptrends. At this point, however, they have fallen and cannot get back up. We need to see short-term breakouts and breadth thrusts to signal that the pullbacks are ending and the bigger uptrends are resuming. Note that I covered short-term breadth on Thursday and set the key levels to watch. Today’s report will focus on the December pullbacks in several ETFs and set the short-term resistance levels to watch going forward.
Mid and Small Caps Firm Near Retracements (RSP,MDY,IJR,IWM)
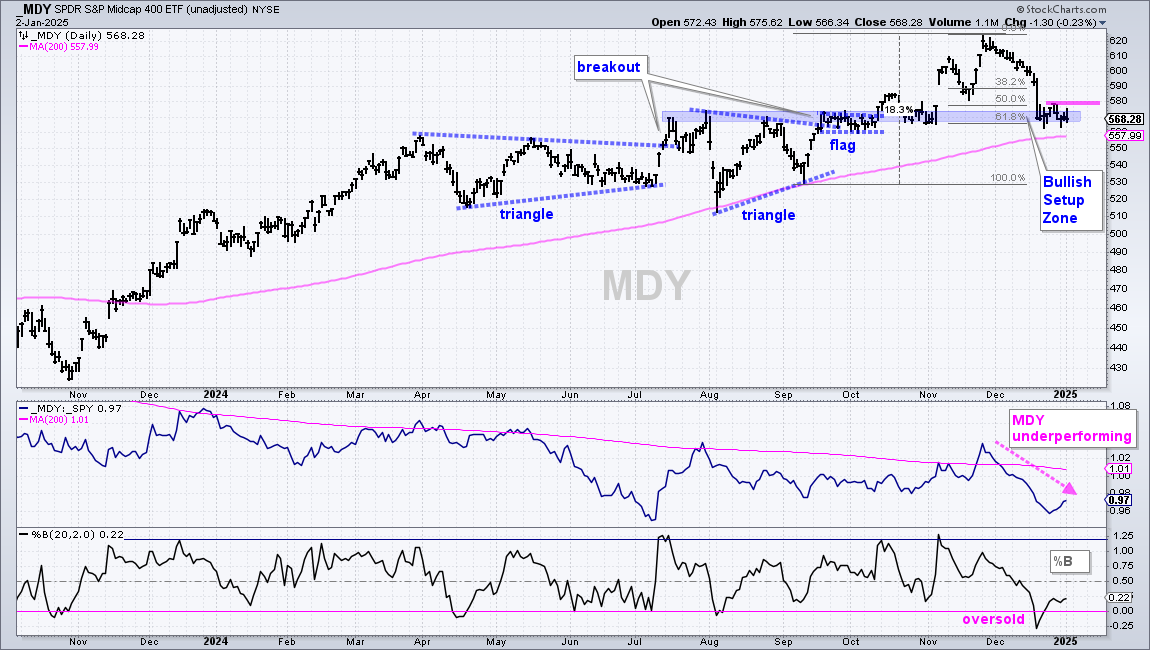
The chart setups are the same for the S&P 500 EW ETF (RSP), S&P MidCap 400 SPDR (MDY), S&P SmallCap 600 SPDR (IJR) and Russell 2000 ETF (IWM). These ETFs represent the average stock in the stock market (sans large-caps). I will focus on the MDY and IWM charts. MDY surged to a new high in late November and fell back to a Bullish Setup Zone in December (blue shading). Broken resistance from the August-September highs turns into support and the decline retraced 50-61.8% of the 18.3% advance. Also notice that MDY is just above the rising 200-day SMA (pink line). This bullish setup zone is an area to watch for firming and a possible reversal. MDY firmed the last two weeks and established short-term resistance at 580. A breakout here would be bullish.
The first indicator window shows the price-relative (MDY/SPY ratio) falling in December as mid-caps underperform large-caps (and large-caps outperform mid-caps). The lower window shows %B dipping below 0 to become oversold. This means MDY closed below the lower Bollinger Band (20,2). Thus, MDY was oversold within an uptrend, which means there was a pullback. A pullback within an uptrend is an opportunity and MDY is in a Bullish Setup Zone. A breakout is the only thing missing here.
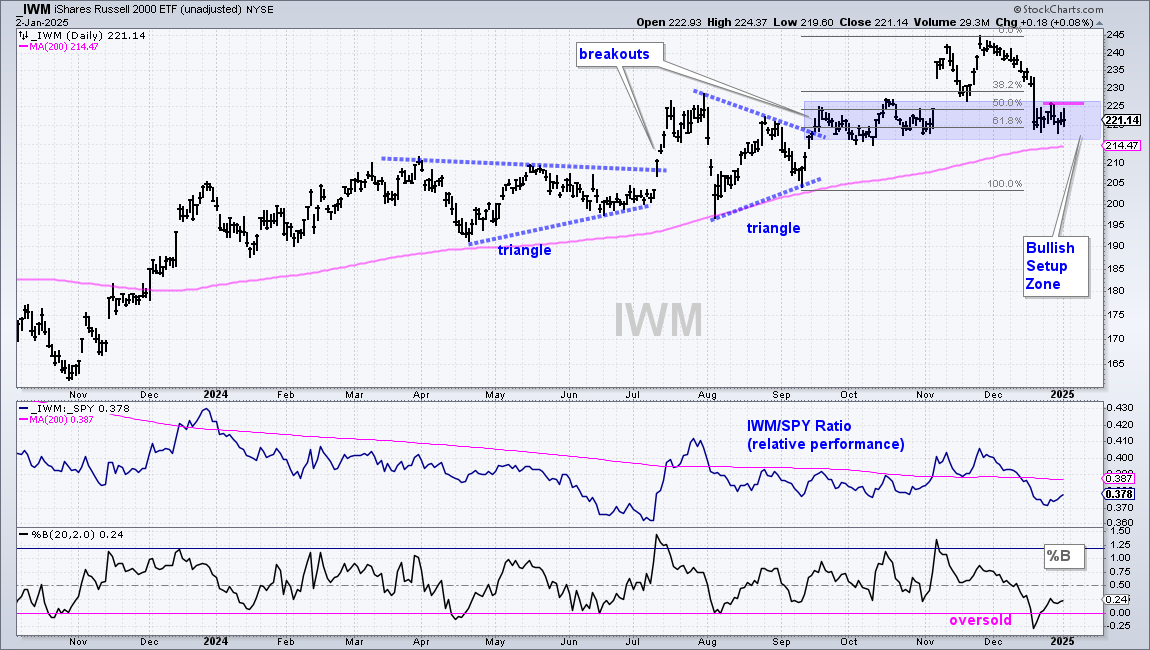
The next chart shows IWM with similar characteristics.
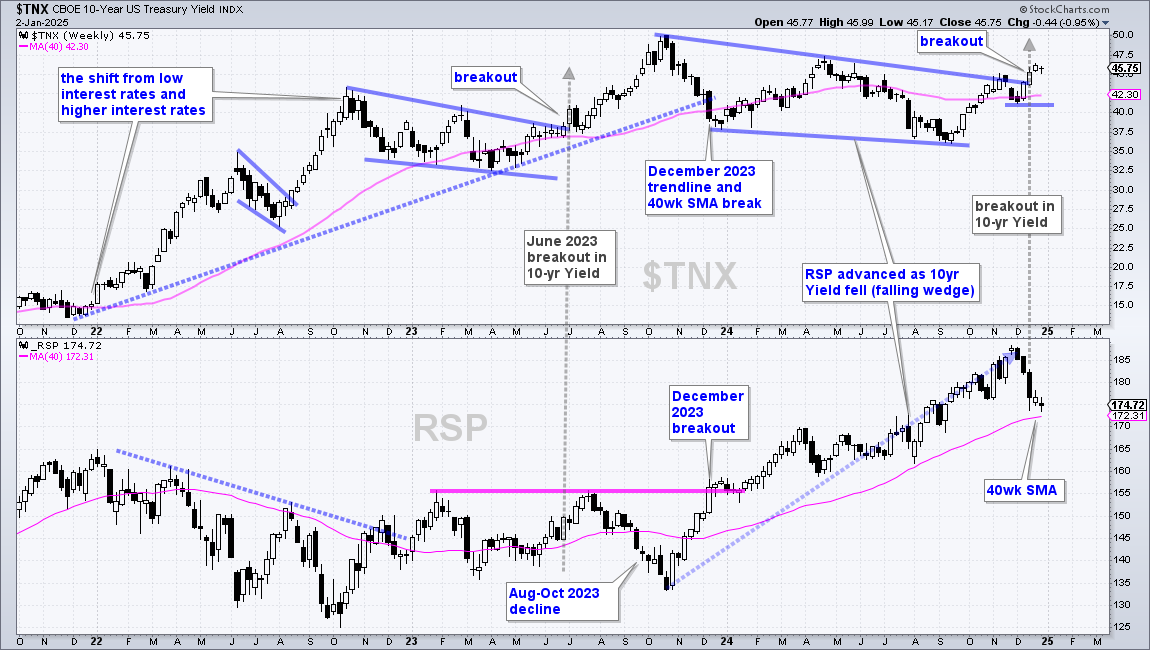
10-yr Yield Holds the Key for Small-caps ($TNX, IEF)
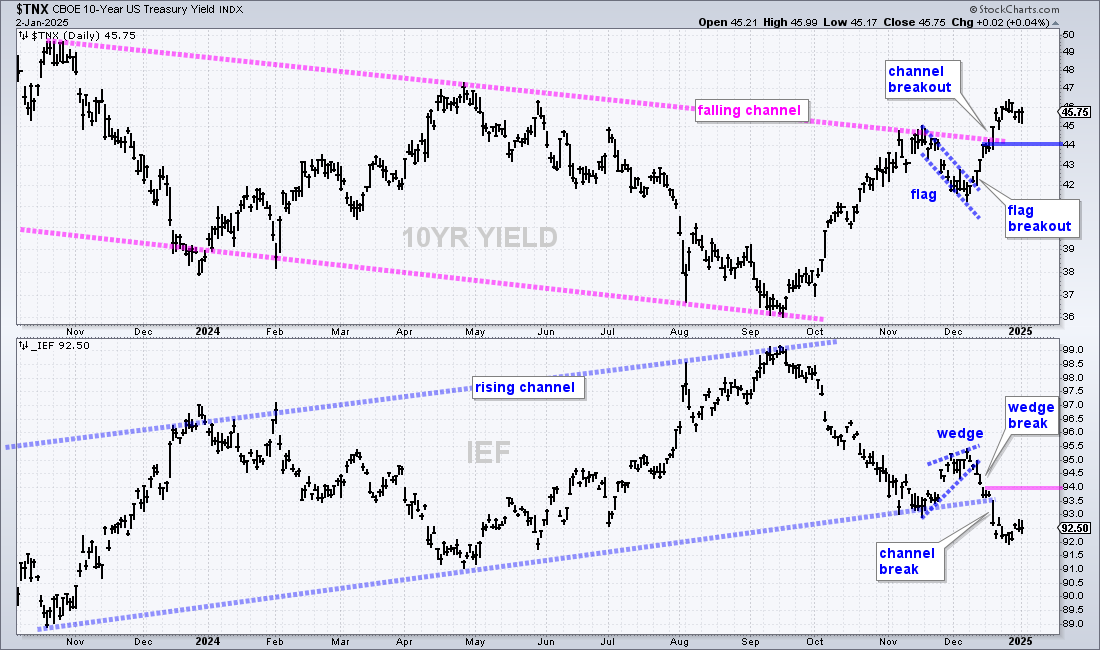
The 10-yr Treasury Yield surged from 4.2% to 4.6% in December and broke out of a large falling channel. This steep move weighed on small-caps as the Russell 2000 ETF (IWM) fell around 7% during this time. Small-caps are more sensitive to interest rates and this breakout bodes ill for the group. This breakout is valid as long as 44 holds (4.4%). A move back below 44 would put the 10-yr Treasury Yield back in the falling channel and this would be positive for small-caps.
Long-term, the 10-yr Yield is breaking out of a large falling wedge and this breakout looks similar to the breakout in late June 2023. This breakout foreshadowed a move to 5% and stocks were hit with strong selling pressure from August to October 2023. History could be repeating itself. The chart below shows the 10-yr Yield with the S&P 500 EW ETF (RSP), which is perhaps more sensitive to interest rates than the S&P 500 SPDR (SPY). RSP fell from January to October 2022 as the 10-yr Treasury Yield surged from low levels (1.5%) to relatively high levels (above 4%). After a respite, there was a falling wedge breakout in late June 2023 and TNX extended to 5% in October 2023. This breakout and surge coincided with a three month decline in RSP (August to October). After peaking near 5%, the yield fell to the 4% area in early December 2023 and broke the 40-week SMA. This decline and break coincided with the December 2023 breakout in RSP.
Most recently, the 10-yr Treasury Yield fell from November 2023 to November 2024 and the S&P 500 EW ETF (RSP) advanced some 30%. This dynamic is shifting because the 10-yr Treasury Yield is breaking out of a long falling wedge to signal a continuation of its long-term uptrend. The next target is around 5% (50 on the chart). RSP fell sharply the last five weeks and is trading just above its 40-week SMA. RSP is short-term oversold right now and ripe for a bounce, but further strength in the 10-yr Treasury Yield would likely lead to a break of the 40-week SMA.
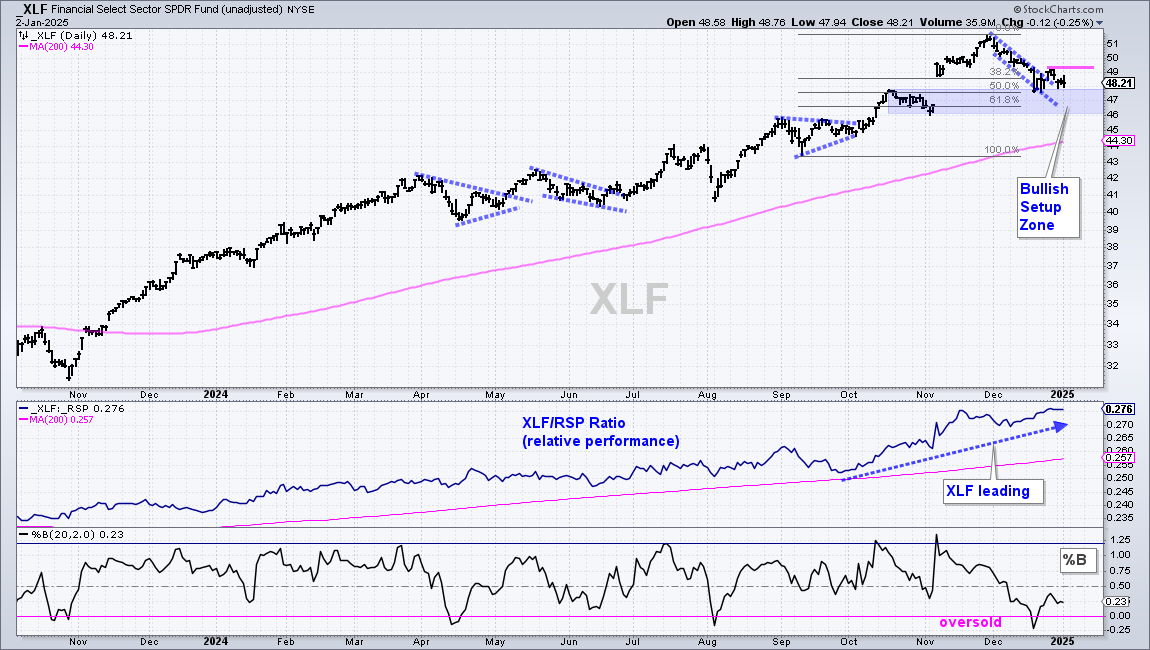
Finance and Banks Correct within Leading Uptrends (XLF, KRE, KIE)
Stocks and finance-related groups led the market into November and then pulled back into December. Some pulled back more than others. The first chart shows the Finance SPDR (XLF) in a long-term uptrend with a new high in late November and price well above the rising 200-day SMA. XLF formed a falling flag that retraced around 50% and moved into the early November gap zone. The ETF is attempting to firm and a breakout at 49.25 would be bullish.
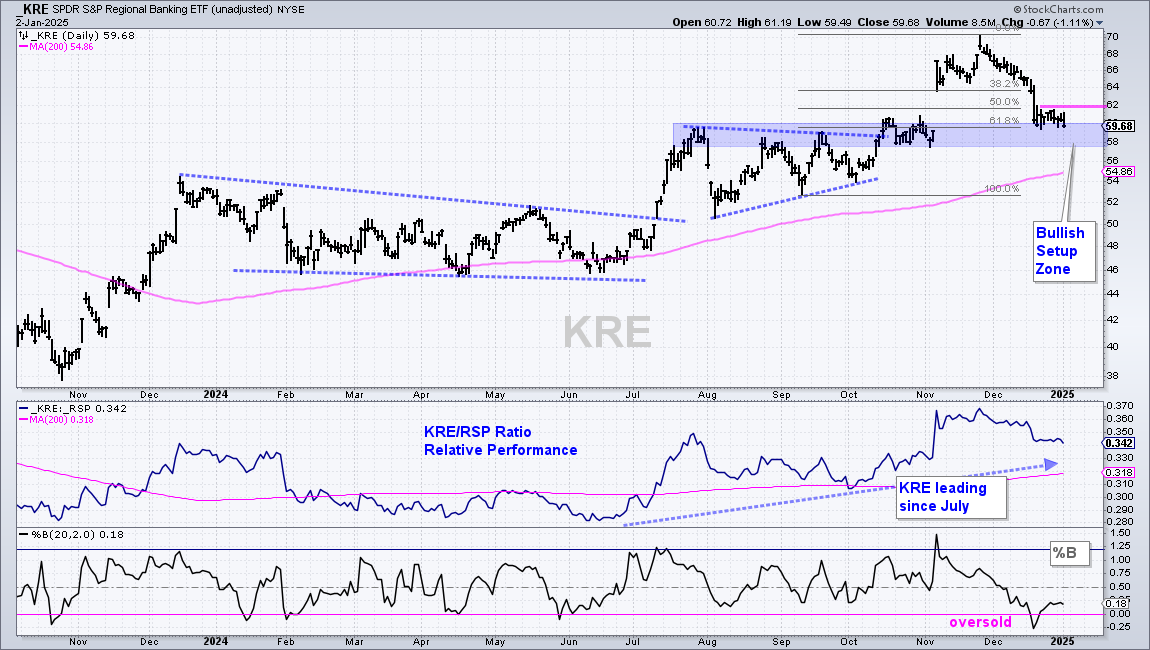
The next chart shows the Regional Bank ETF (KRE) hitting a Bullish Setup Zone marked by broken resistance and the 61.8% retracement. Also notice that %B became oversold in mid December (<0). KRE firmed the last two weeks and established resistance at 62. A breakout here would be bullish.
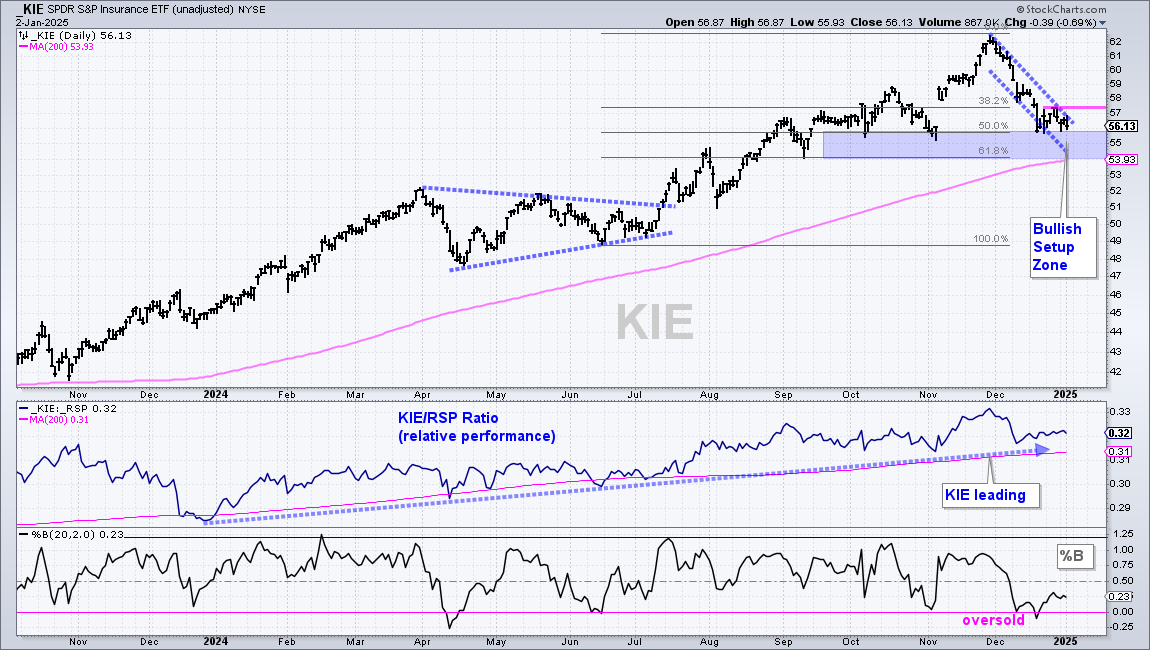
The next chart shows the Insurance ETF (KIE) with resistance marked at 57.50
Pullbacks within Uptrends for Five ETFs
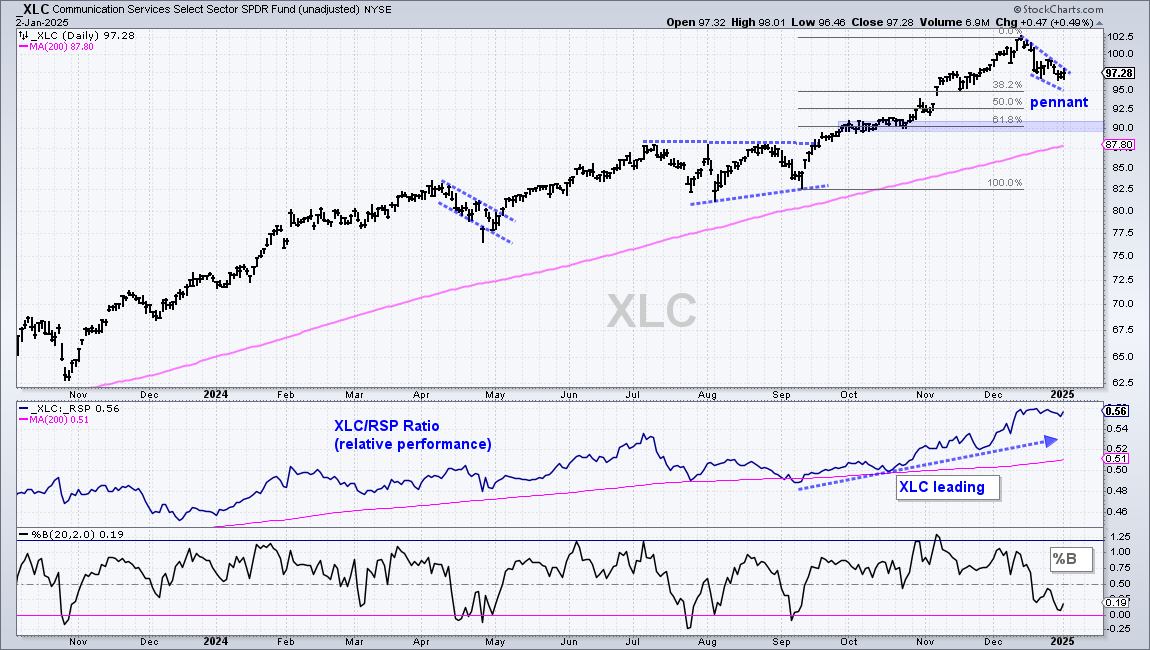
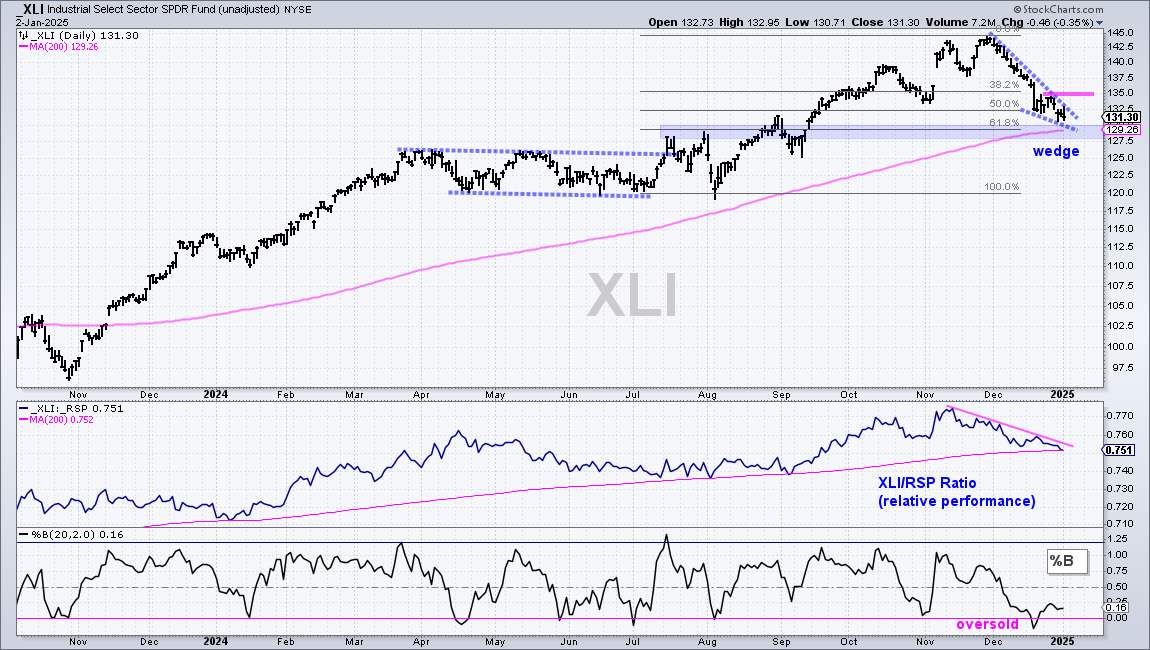
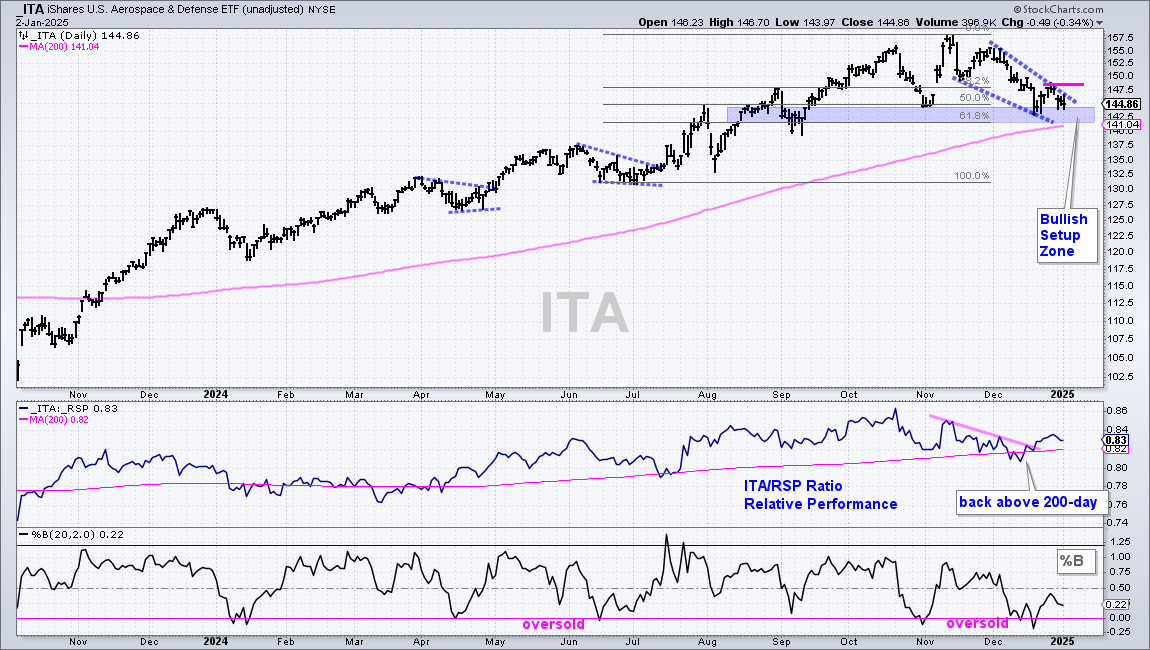
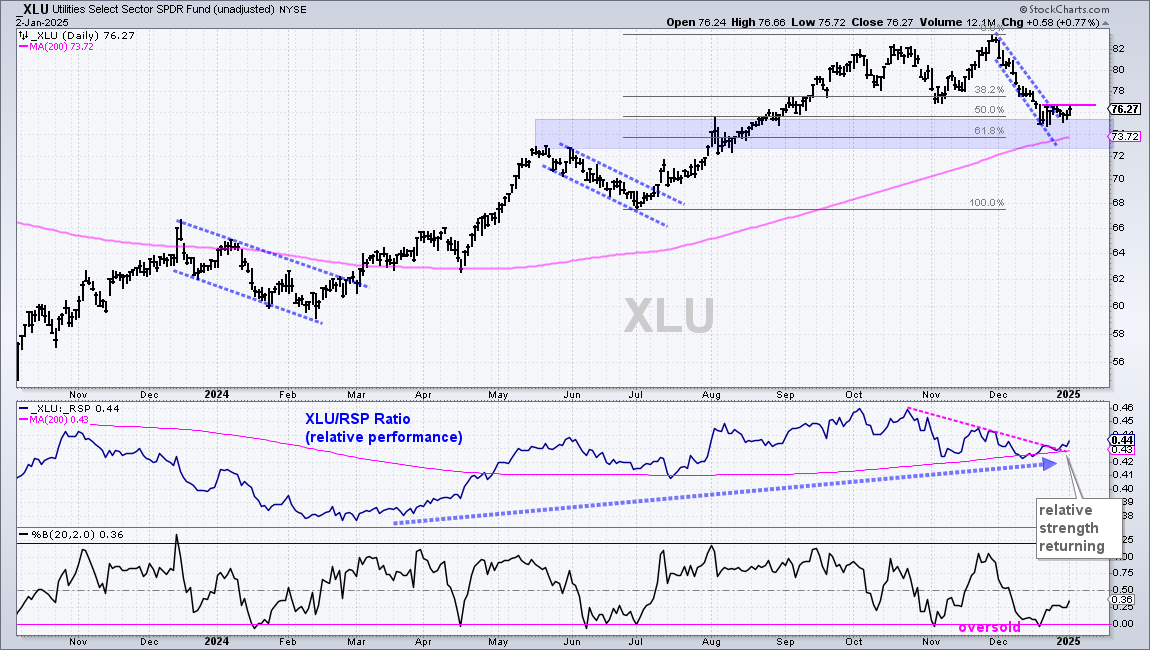
The next charts show pullback setups for five ETFs. All five are in long-term uptrends. They all pulled back to various degrees and pullbacks within uptrends are opportunities. The charts show flags, pennants, wedges and/or Bullish Setup Zones. Check out the middle window, which shows the price relative for each ETF. Some are showing relative strength the last few weeks as their price-relatives turned up.
Comm Services Forms Pennant (XLC)
Industrials Pullback after Leading Uptrend (XLI)
Defense Corrects within Uptrend (ITA)
Utes Become Oversold within Uptrend (XLU)
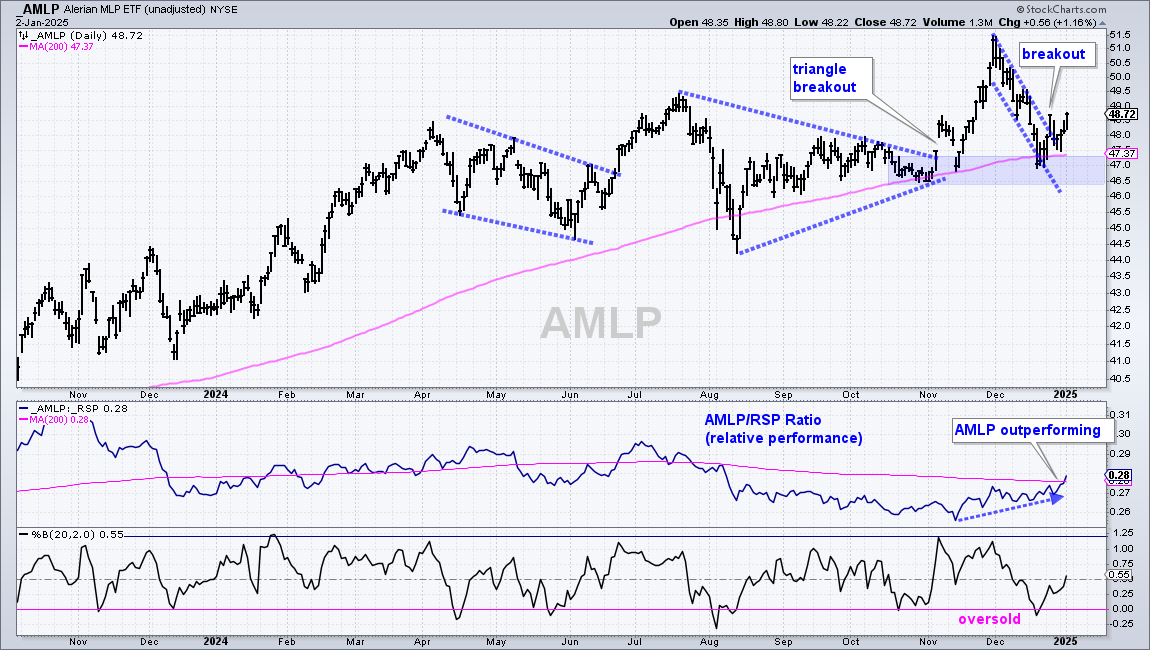
MLP ETF Breaks Out after Pullback (AMLP)
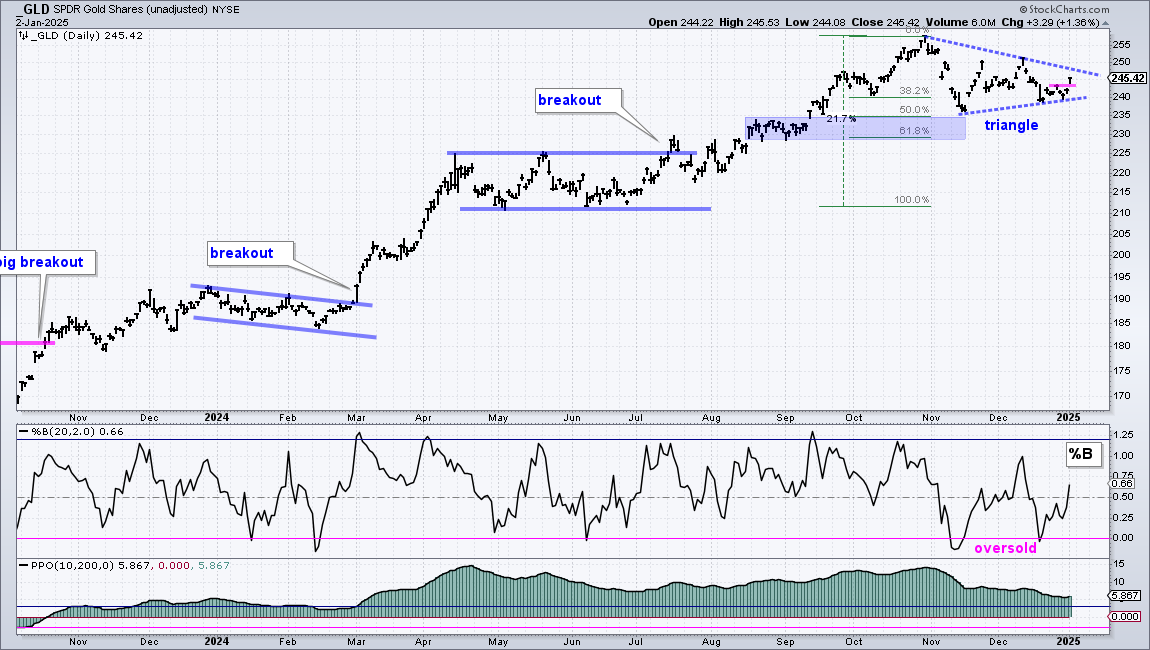
Gold SPDR Forms Bullish Triangle (GLD)
The Gold SPDR (GLD) is forming a triangle consolidation within a long-term uptrend. GLD hit a new high in late October and then corrected with a triangle the last two months. The swing within the triangled turned down with a sharp decline in mid December, but GLD firmed around 240 and broke short-term resistance with a bounce the last two days. The swing within the triangle is now up and this increases the chances for a bigger breakout at 250. Also notice that there were two oversold readings as %B dipped below 0 in mid November and mid December.
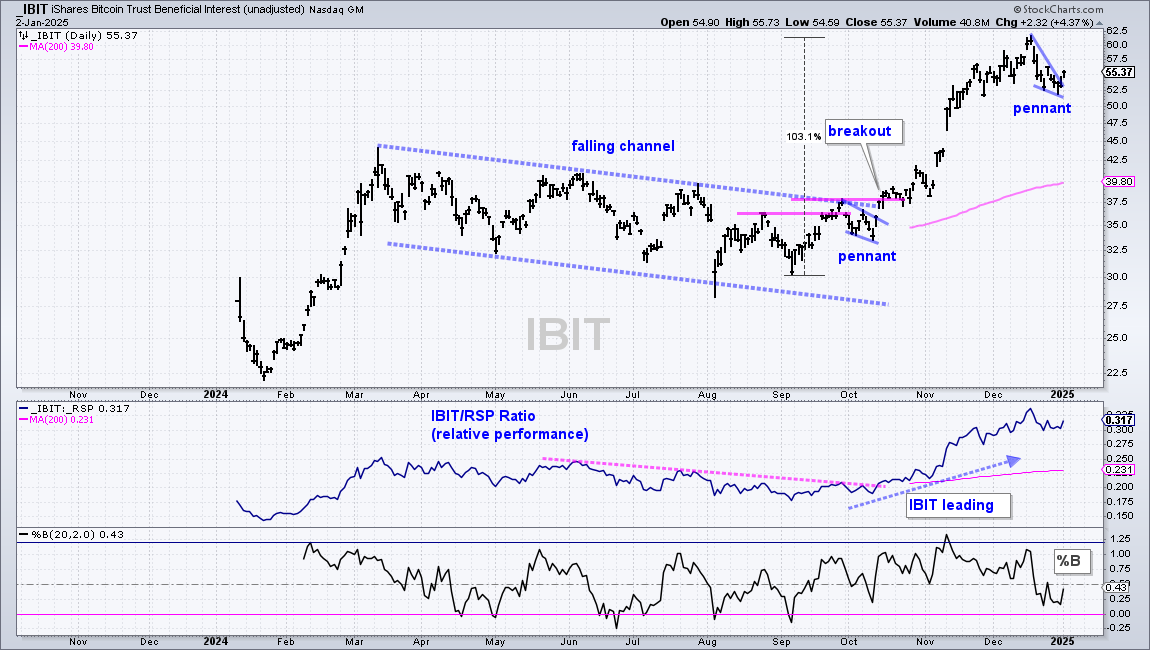
Bitcoin Breaks Out of Pennant (IBIT)
The Bitcoin ETF (IBIT) doubled from early September to mid December and then fell back into yearend. The ability to double in three months tells us that this is one volatile ETF. This pullback formed a pennant and IBIT broke out with a 4.37% gain on Thursday. This breakout is bullish and argues for a continuation of the bigger uptrend. A close below 52 would call for a re-evaluation.
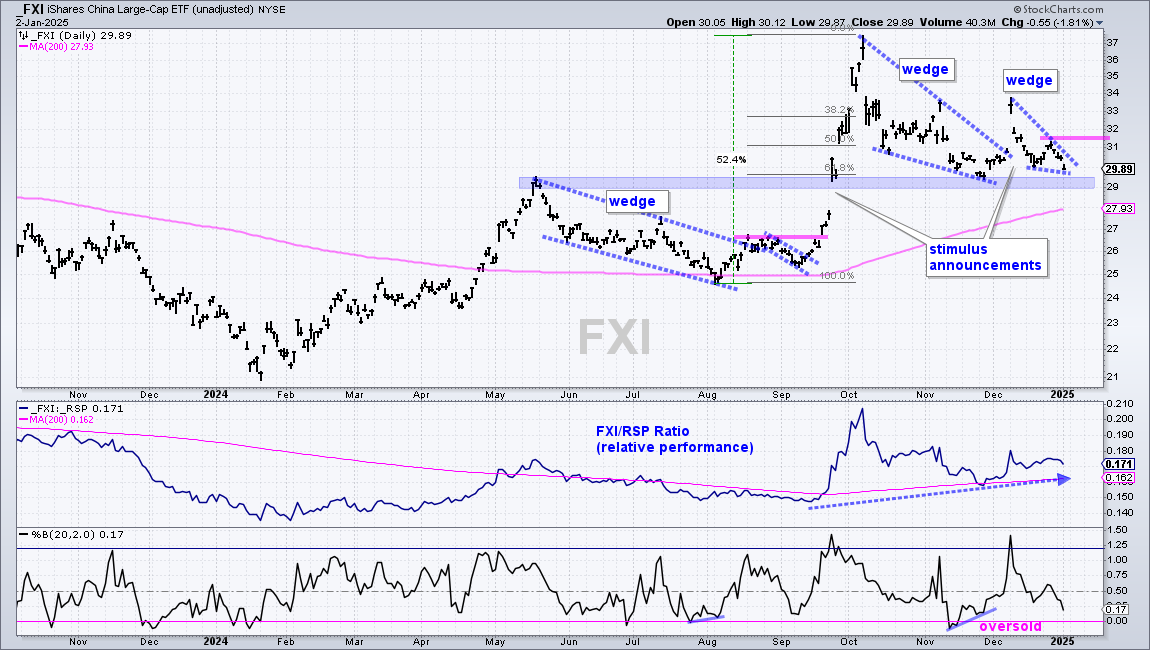
China Large-Cap Falls Back After Breakout (FXI)
Chinese authorities are throwing the kitchen sink at the economy and the China Large-Cap ETF (FXI) is not responding well. Announcements generated big moves in late September and early December. While governments and central banks usually get what they want, the market remains unconvinced. The chart shows FXI with a 52% surge-breakout in late September, a big falling wedge into November and another surge-breakout in early December. FXI surged above 33 in early December and already fell back below 30. The gains are gone. China announced another stimulus on Friday and I am marking wedge resistance at 31.50. A breakout here would reinforce support and keep the uptrend alive. Failure to break out would show a negative reaction to “good” news. Failure to advance in the face of good news is a bad omen.
")