
")


The stock market has been churning the last few weeks with indecisive price action producing a fair number of whipsaws and head fakes. The old school ETFs associated with industrials, materials, REITs, housing, steel, metals and agriculture continue to lead. The high-beta high-flyers of 2020 continue to lag and many did not even make it back above

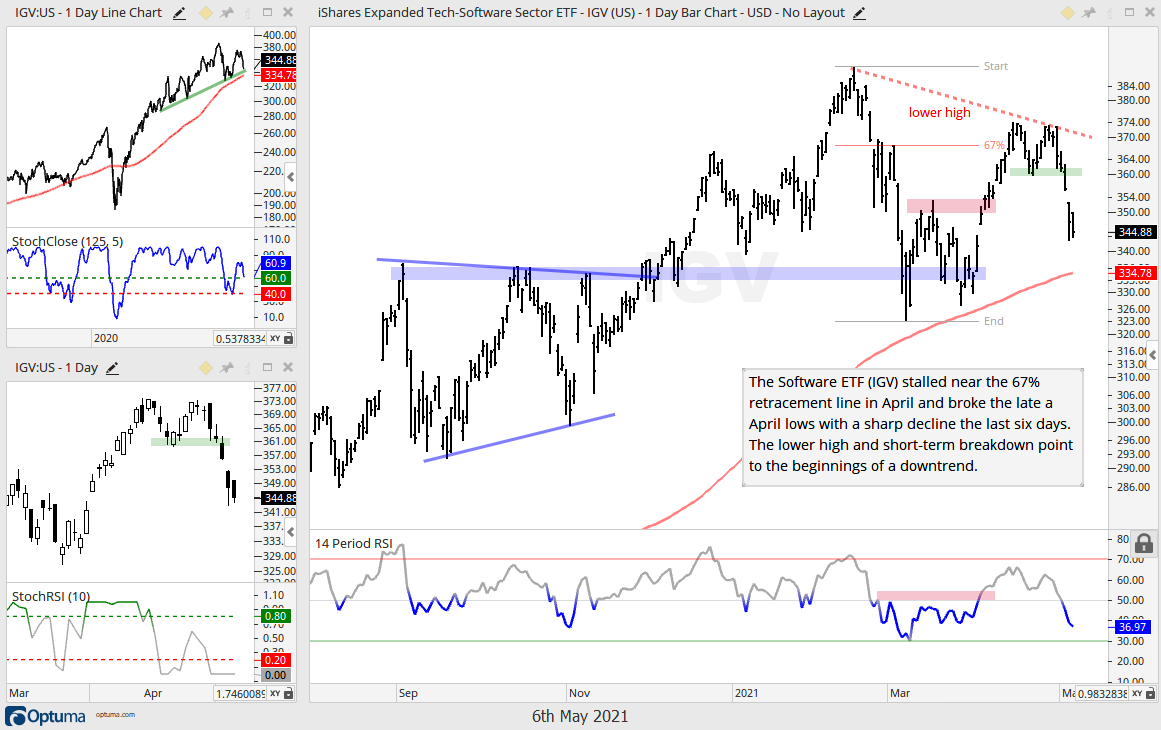
The long-term trend for the Semiconductor ETF (SMH) remains up, but the ETF is coming under some selling pressure and underperforming the broader market. While this is not enough reason to turn long-term bearish, it does increase the odds of corrective period in the coming weeks.
Semis Loose their Shine (Free) Read More »

The bulk of the evidence remains bullish for stocks, but we are seeing a short-term non-confirmation from QQQ and continued relative weakness in IWM. SPY remains the leader of the group with a new high this week. However, the current leg up is also getting quite extended because we have not seen a decent correction in six months. Even though the risk appetite returned to QQQ and

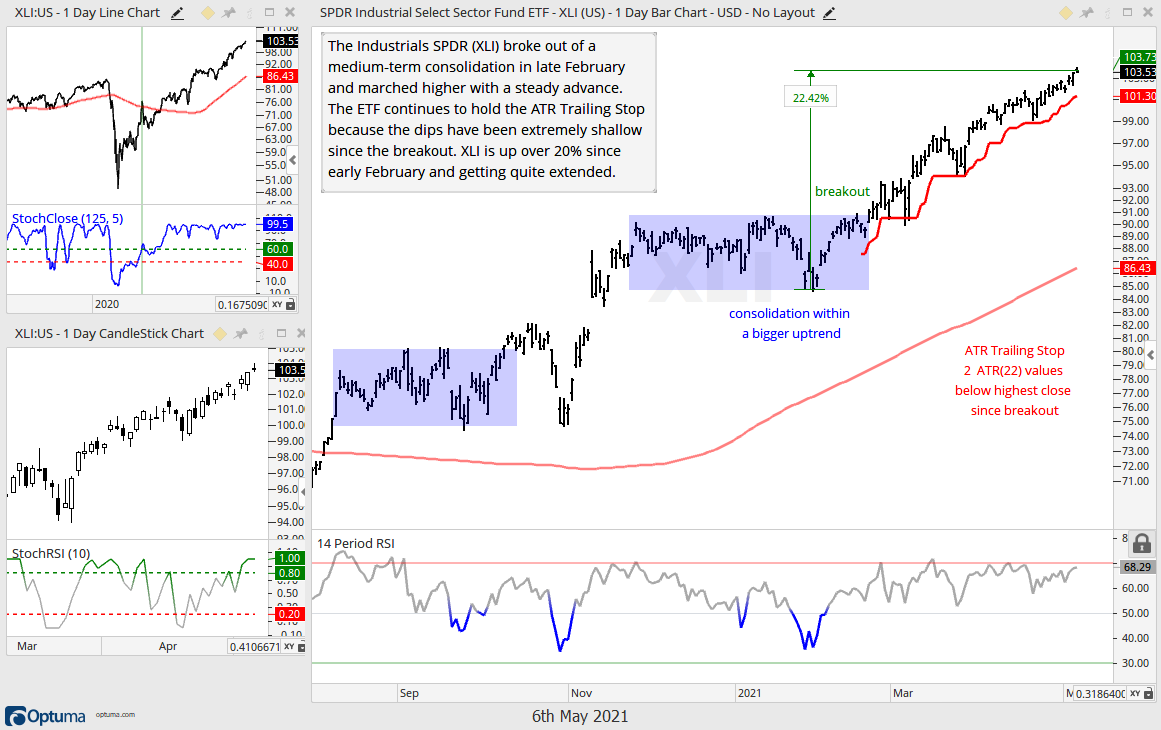
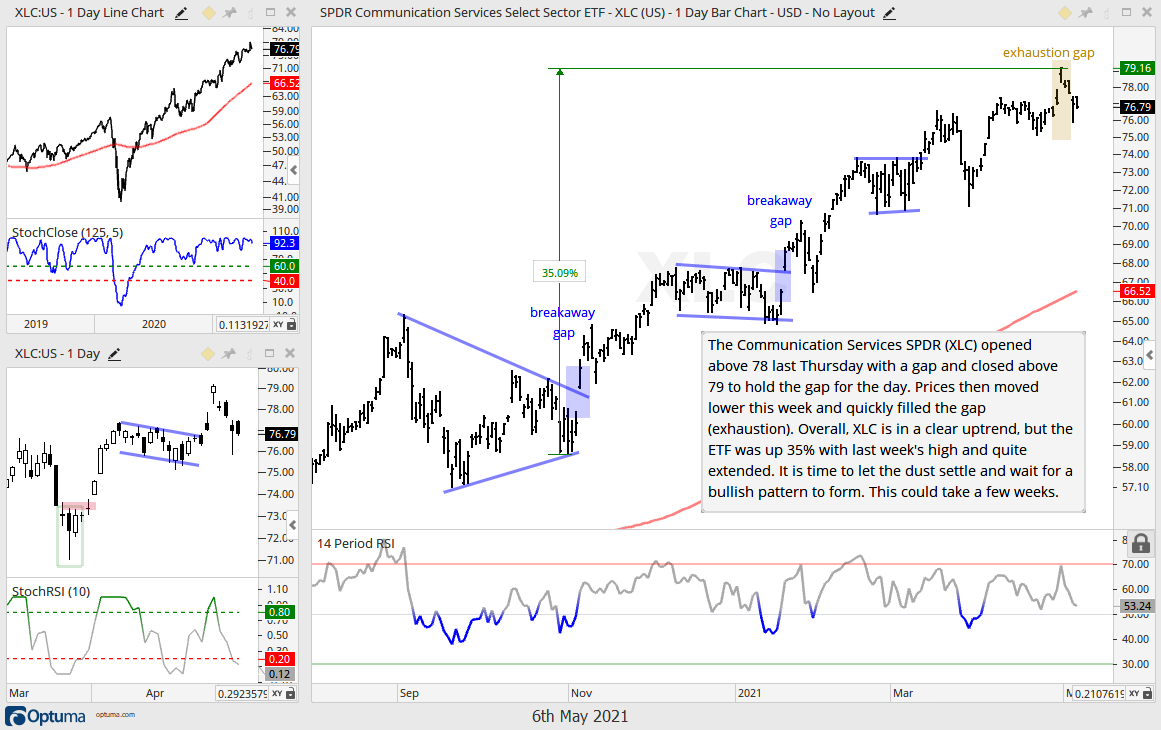
There are dozens of ETFs in the trend-monitoring phase because their setups evolved in February-March, they broke out at least a month ago and moved higher the last two months (or more). There is no real analysis to be done with these ETFs because they are in their post-breakout moves (trend-monitoring phase). Today’s report will show charts for these ETFs first.

It has been a wild ride for the Russell 2000 Growth ETF (IWO) and Nasdaq 100 Next Gen ETF (QQQJ) over the last two weeks as they went from emerging leaders to overreaction laggards and back to leading. The lagging part occurred last Tuesday when stocks fell sharply during the day. This whipsaw action is looking more like short-term noise because these two are leading again with strong recoveries.
Growth and High-Beta Start to Lead – Brazil and Emerging Markets Break Out (Subscribers) Read More »

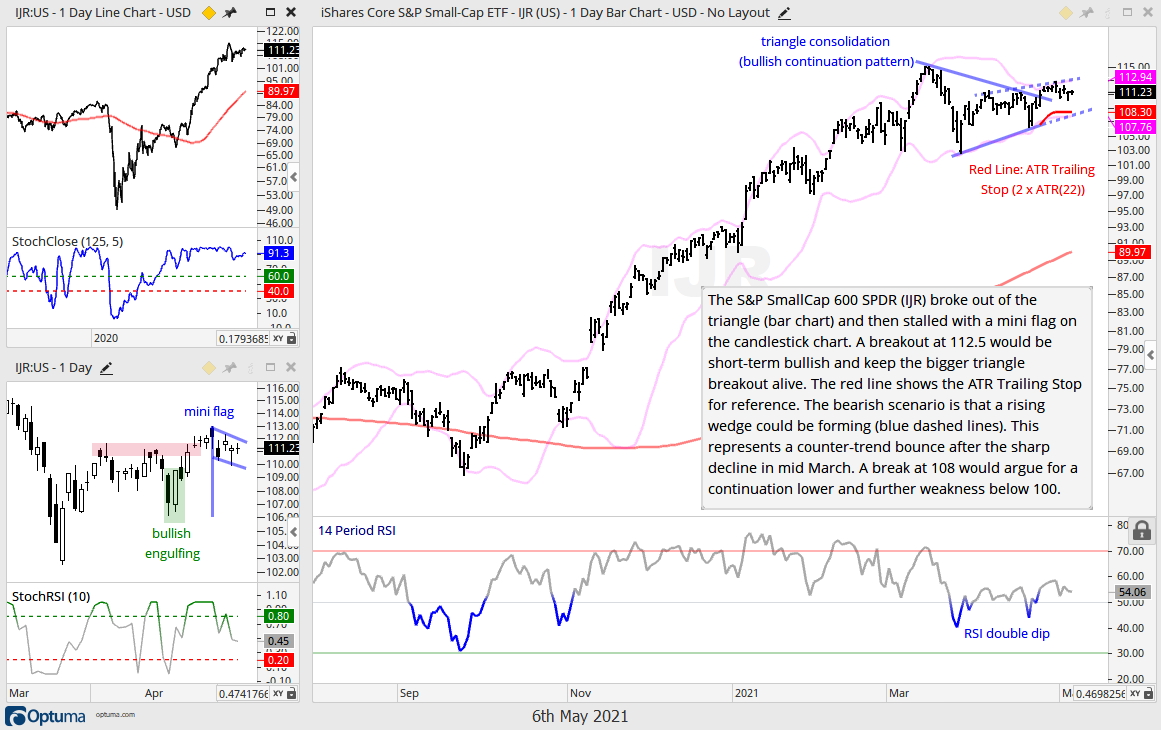
The S&P SmallCap 600 SPDR (IJR) and Russell 2000 ETF (IWM) are lagging the market, but they are still in uptrends and the noose is tightening. Today we will look at the volatility contraction in IJR and the loss of trend in IWM
Small-caps Keep Everyone Guessing – Here’s Mine (Free) Read More »
After getting derailed with a curve ball on Tuesday, the bulls rebounded stocks ended the week on a high note. Again, a wide array of ETFs recorded fresh 52-week highs and there are plenty of strong groups in the stock market. This week we are seeing a possible return to growth, clean energy and China

Small-cap breadth is seriously lagging large-cap breadth, but we have yet to see a bearish breadth thrust or a breakdown in the S&P SmallCap 600 SPDR (IJR), which is currently consolidating. This commentary will look at the breadth thrust signals and compare the percentage of stocks above the 50-day SMA for the S&P 500 and the S&P SmallCap 600.
Small-cap Breadth Relative to Large-cap Breadth (Free) Read More »
The bulk of the evidence remains bullish for stocks, but some yellow flags are starting to appear. Yellow flags argue for some caution and are not outright bearish. For example, defensive sectors are leading, but the offensive sectors are still holding up, even though they are lagging. Small-caps are
The market turned mixed the last six to eight weeks with defensive and high-yielding ETFs leading. ETFs related to Healthcare, Utilities and REITs hit new highs this week and produced market leading moves since early March. Growth oriented ETFs

The Composite Breadth Model remains bullish and this means we are still in a bull market environment. Nevertheless, the odds for a correction are building and we are now seeing a dramatic move away from small-caps, which is reflected in some key breadth metrics. I will show a new twist on
A Serious Deterioration in Small-cap Breadth Relative to Large-cap Breadth (Premium) Read More »

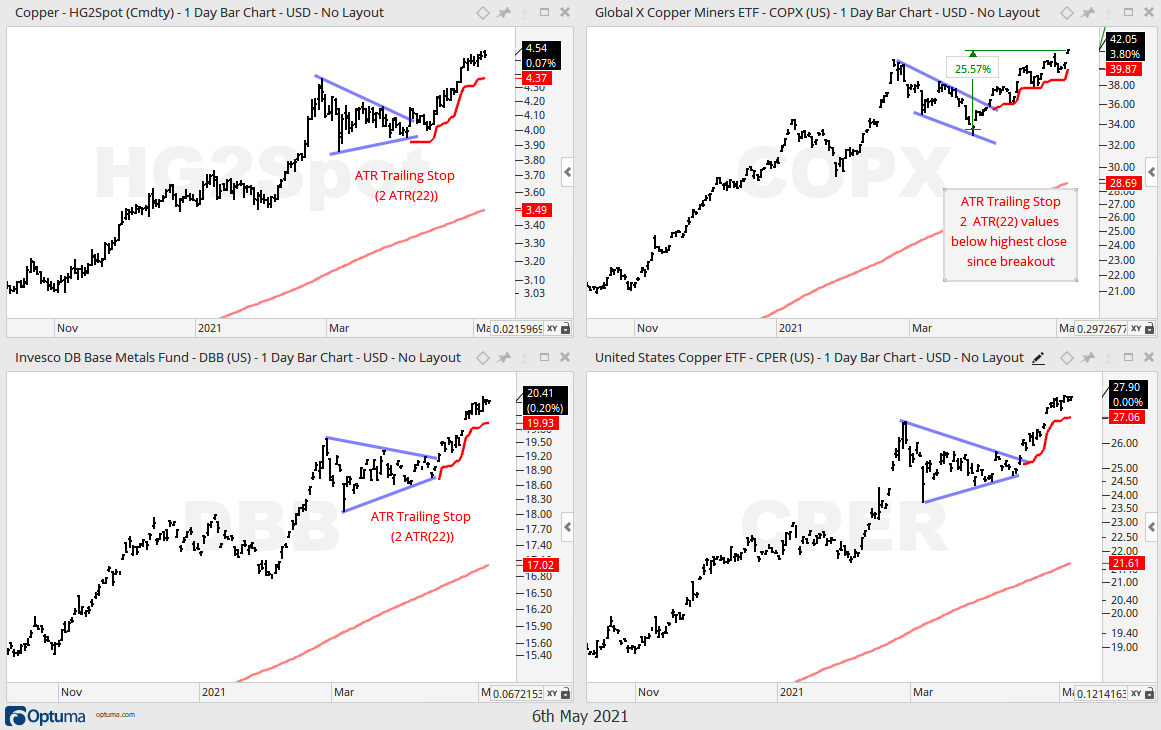
I am always interested in themes that can drive secular trends. These include electronic payments, electric vehicles, clean energy, marijuana and such. These themes involve narratives and I am always careful with narratives. We all love a good story and stories help sell us
Copper, All Things Electric and some Broad Market Thoughts (Premium) Read More »
The DB Base Metals ETF (DBB) is breaking out of a bullish continuation pattern after a Bollinger Band squeeze and this signals a continuation of the long-term uptrend.
Base Metal ETF Gets the Squeeze (Free) Read More »
SPY hit yet another new high, nine sector SPDRs hit new highs and the breadth indicators show broad strength within this large-cap benchmark. QQQ also hit a new high as large-cap techs extended their rebound. Small-caps and small-cap growth remain the laggards, but their cups are still half full
Large-caps and large-cap techs ripped higher the last five-six weeks with SPY and QQQ hitting new highs. The Technology SPDR and Consumer Discretionary SPDR are leading the charge among the sectors with 13+ percent gains. Keep in mind that Amazon accounts for 23.5% of XLY and Tesla accounts for 14.45%. These two are not exactly pure plays in the
There is plenty of strength within the stock market and also a few pockets of weakness, or lackluster performance. SPY and QQQ hit new highs this week. This shows broad strength within the S&P 500 and large-cap tech stocks. There were new highs in ETFs related to finance, tech, industrials, materials, healthcare, housing, steel, REITs, semiconductors

The Healthcare SPDR (XLV) formed two bullish continuation patterns within its long-term uptrend and recent breakouts bode well for further gains.
Healthcare SPDR Looks Poised to Extend Uptrend (Free) Read More »
Equity-related ETFs continued strong this week with large-cap techs leading the way here in April. SPY also hit a new high, but small-caps are lagging as IWM stalls. Bank and energy related ETFs are also dragging their feet a little. Relative weakness is not a concern because IWM, KRE and XES
The S&P 500 SPDR hit a new high to affirm the bull market and seven sector SPDRs joined the new high parade (XLK, XLY, XLC, XLI, XLB, XLRE, XLP). The Finance SPDR (XLF) and Healthcare SPDR (XLV) are within 2% of 52-week highs. Strength within the S&P 500 is broad and supportive of a bull market. Today’s report will show QQQ close to a new high and IWM struggling, but still bullish. Technology and Consumer Discretionary
There are plenty of strong pockets in the stock market with several cyclically oriented ETFs hitting new highs and large-cap techs coming back to life. This month we are seeing new highs in ETFs related to industrials, materials, housing, semiconductors, transports and steel. We are also seeing some big moves in ETFs dominated by large-cap tech. The Consumer Discretionary SPDR hit a new high and I consider Amazon, its