The slow rotation continues in the stock market. Tech and biotech related ETFs lagged over the last five days with declines, while ETFs related to housing, retail, banks and small-caps picked up the slack. Note that SPY is down .53% the last five days and the S&P SmallCap 600 SPDR (IJR) is up 1.94%.
This is still a slow rotation and I would not exactly label the Regional Bank ETF (KRE) and S&P SmallCap 600 SPDR (IJR) as leaders. KRE remains below its falling 200-day and IJR is not even close to a new high. They are still lagging longer-term. Moreover, large-caps account for 80 plus percent of the US stock market and they are the main drivers.
As featured in today’s commentary, we saw good follow through to breakouts in ITB and XRT, but the size of these moves was extraordinary. Gold and TLT continue strong and this shows continued demand for stock alternatives. Even though the S&P 500 EW ETF, Russell 2000 ETF and Industrials SPDR are holding their Bollinger Band breakouts, follow through was uninspiring. Several tech-related ETFs are stalling and this could foreshadow a much needed correction after massive advances.
ETF Ranking Table and Scatter Plot
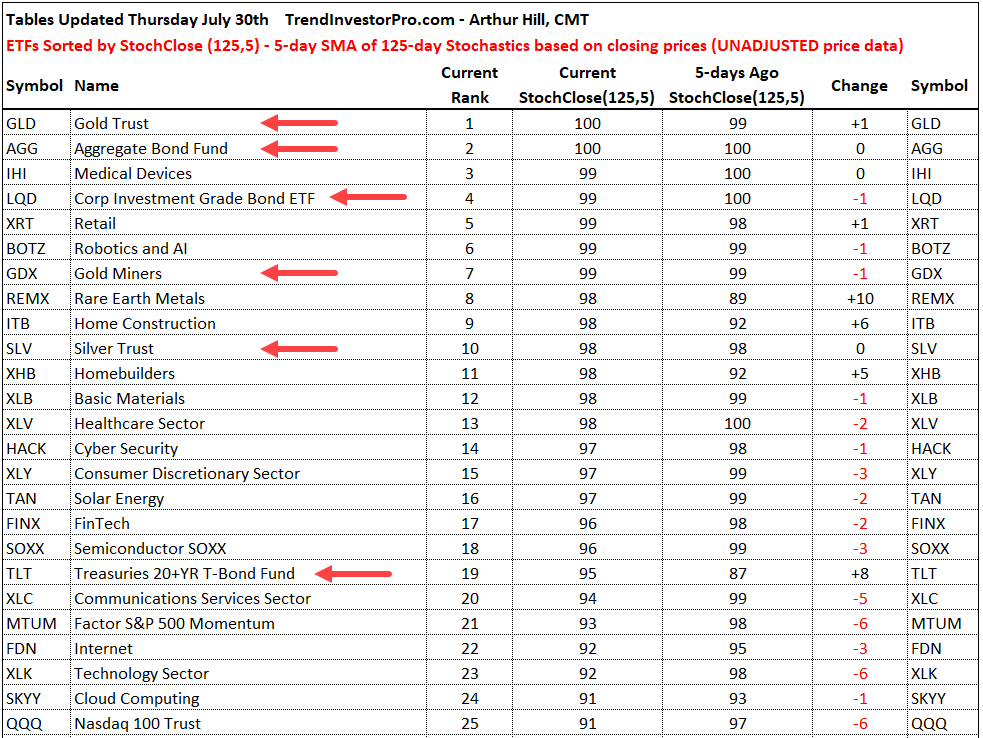
The first image shows the ranking table for the top twenty ETFs in the core list. As the red arrows show, six are alternatives to stocks. Yes, I am including the Gold Miners ETF (GDX) because it is driven by gold and silver. Corporate bonds (AGG, LQD) remain strong and the 20+ Yr Treasury Bond ETF (TLT) cracked the top 20 with a big jump in the StochClose (+8) over the past week. Elsewhere, we are seeing continued strength in retail (XRT), housing (ITB, XBH) as well as some tech and healthcare related ETFs.
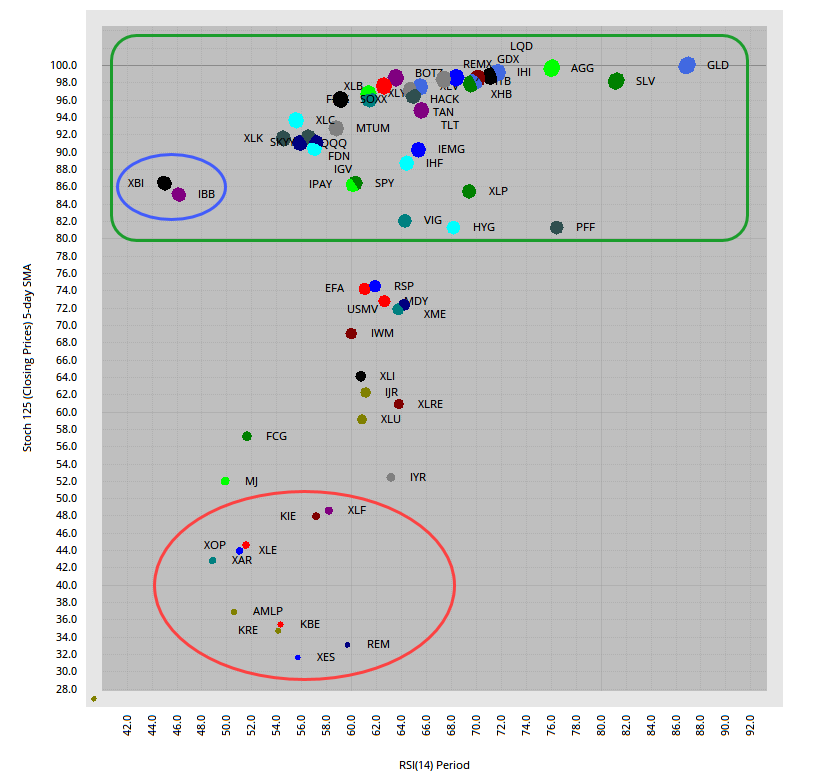
The next image shows a scatter plot with StochClose (125,5) on the y-axis and RSI(14) on the x-axis. 36 ETFs have StochClose values above 80 and are in clear uptrends (green outline). The Biotech ETF (IBB) and Biotech SPDR (XBI) are to the far left, which means they have the lowest RSI values and are mildly oversold (blue oval). This means they could be ripe for a mean-reversion bounce. The laggards are highlighted with the red oval. Here we find ETFs related to finance, banking, energy and defense.
New High and Leading
BOTZ, TAN, GDX, AGG, GLD, SLV
It is all about the Gold SPDR (GLD), Silver ETF (SLV) and Gold Miners ETF (GDX) this week as all three surged to new highs. 14-day RSI for GLD finished at 86.89, which is the highest level ever for the ETF. 14-week RSI, however, remains below 80. Note that 14-week RSI hit 80 at least 4 times during the bull run from 2006 to 2011 and the PPO(1,40,0) exceeded 20% at least three times. 14-week RSI exceeded 80 in August and the PPO has yet to exceed 20. Even though gold is overbought and going parabolic, the trend is up and the weekly chart shows more room to run.
SLV and GDX broke out of consolidation patterns in late June and raced higher the last six weeks. Both are up over 35% and getting pretty extended/overbought. Overbought is a double-edged sword though. It takes strong buying pressure to become overbought and this is bullish longer term. On the other side, the odds of a pullback or consolidation increase after such a sharp advance.
Even though the 20+ Yr Treasury Bond ETF (TLT) belongs in a lower group, I am going to show it next because it is in an uptrend and very close to its April high. TLT has been above its 40-week SMA since December 2018 and sports at least three breakouts since early 2019. The blue lines mark pullbacks into March 2019, January 2020 and June 2020. Most recently TLT retraced 61.8% of its January-March surge and broke out in late June. Also notice how 14-week RSI bottomed near 50.
While it is certainly possible for gold, Treasury bonds and stocks to rise at the same time, the parabolic move in gold and continued strength in Treasuries suggests that something is not quite right in the kingdom of stocks. It is not just gold and Treasuries. The 24-July report noted irrational exuberance in QQQ and the 17-July report noted weak seasonal patterns beginning in August. I will cover broad market conditions in Friday's report.
The first group of ETFs are leading because they broke out a few weeks ago and moved to new highs over the last few days. FINX and HACK are the only two tech-related ETFs in this group. The rest of the tech-related ETFs are in a lower group because they consolidated the last few weeks and did not hit new highs over the last few days.
Above 200-day, Breakout and New High
The Medical Devices ETF (IHI) followed XLV higher with a triangle breakout in early July and new highs throughout the month. The Healthcare Providers ETF (IHF) broke out in mid July, which was a little later. Nevertheless, the breakout is holding and IHF looks poised for a new high. I put the IHF chart with XLV and IHI, but performance-wise it belongs a little lower because it has yet to hit a new high.
The Home Construction ETF (ITB) advanced some 25% since late June and hit a new high on Tuesday. The trend is up, but the ETF is getting extended short-term and ripe for a rest. XRT shows similar characteristics with a breakout, 17% advance and new high.
Keep in mind that the 25 and 17 percent advances in ITB and XRT in four to five weeks are extraordinary, especially on top of 50 plus percent advances prior (late March to early June). Extraordinary also implies "not normal". Clearly, volatility is above average and high volatility translates to above average risk.
The Cyber Security ETF (HACK) and the FinTech ETF (FINX) show big moves, consolidations (blue lines) and breakouts. Both moved to new highs last week and HACK notched a new high this week. These two are only up 10 to 12 percent since late June, which looks rather tame after seeing XRT and ITB.
Consolidating after New High
QQQ, MTUM, XLK, XLC, SKYY, FDN, SOXX, IGV
Now we get to the majority of the tech-related ETFs and start with QQQ. Note that AMZN, AAPL and GOOGL report after the close on Thursday. Expectations are high for Apple and Amazon after both pretty much doubled from mid March to mid July. GOOGL was only up around 50% – what a laggard!
While ITB, XRT and IHI raced to new highs, QQQ and several tech-related ETFs stalled. The chart below shows QQQ surging over 50% from late March to mid July and then stalling the last three weeks. This could be a falling flag, but I suspect that a deeper pullback is needed to digest a 50% gain. The green zone marks support from broken resistance and the June consolidation.
The indicator window shows RSI holding above 50 since April 6th (79 days) and volatility flattening (ATR and $VXN). Note that volatility is flattening above the January-February levels and remains above average (risk). Upside breakouts in these two would show more volatility and be negative.
The next chart shows the Semiconductor ETF (SOXX), Internet ETF (FDN) and Software ETF (IGV) consolidating the last few weeks. Technically, upside breakouts would be bullish and signal a continuation of the prior advance. However, all three were up some 70% without much of a correction. The green zones mark potential correction targets and modest retracements (~38%).
New High and Sharp Pullback to Breakout Zone
IBB, XBI
The Biotech ETF (IBB) and Biotech SPDR (XBI) broke out in mid June and hit new highs into mid July. They were leading, but fell rather sharply the last seven days and are mildly oversold (RSI in the 40-50 zone). The chart below shows IBB falling back to the breakout zone, which turns first support. With RSI in the 40-50 zone, this is the first area to watch for a bounce.
Above 200-day, Breakout and Exceeded June High
SPY, IPAY, IHF, REMX, VIG, PFF, TLT, HYG, IEMG
ETFs in this group are just above the mid point in the rankings. They are in uptrends, but not as strong as the first four groups because they have yet to record new highs. They are above their 200-day SMAs and exceeded their June highs. The first chart shows SPY breaking out of a triangle in early July and exceeding its June high (barely). The breakout held with first support set at 310 and a close below this level would negate the breakout. The June lows and 200-day SMA mark key support in the 296-300 area.
The next chart shows the Mobile Payments ETF (IPAY) with a breakout in early July and modest extension higher the last few weeks.
The next chart shows the High-Yield Bond ETF (HYG) breaking out in mid July, moving above its 200-day last week and exceeding its June high this week. The rise in HYG means junk bond yield spreads narrowed further this week. Support is set at 82 and a break here would reverse the uptrend.
Above 200-day and Consolidation Breakout
XLP, XLRE, IYR
The Consumer Staples SPDR (XLP) extended its July run with a move above the April-June highs and the Real Estate SPDR (XLRE) came to life with a consolidation breakout. Procter & Gamble (PG) is the biggest holding in XLP (16.64%) and the stock hit a new high this week. Crown Castle (CCI) and American Tower (AMT) account for 25% of XLRE and both are tied to 5G.
Above 200-day and Breakout, but did NOT exceed June High
RSP, MDY, IWM, USMV, EFA, XME
Now we get to some of the Bollinger Band breakouts, which were featured in the commentary on July 16th. The S&P 500 EW ETF (RSP) and Russell 2000 ETF (IWM) broke out of contracting Bollinger Bands with surges in mid July and these breakouts are largely holding. However, follow through after the breakout was not that impressive. Follow through was stronger in SPY, ITB and IHI. The 15-July gaps mark the first support zone and a close below these levels would negate the Bollinger Band breakout. As far as the dreaded “head fake” is concerned, a break below the late June lows and lower Bollinger Band would be bearish.
Below 200-day, Breakout, but did not exceed June High
IJR, XLI, XLU
The Industrials SPDR (XLI) has chart characteristics similar to RSP and IWM, but it is just below its 200-day SMA. XLI broke out of a Bollinger Band squeeze on July 15th, but follow through has been minimal. The breakout zone is holding with first support set at 70. The June lows and lower Bollinger Band mark key support in the 66-67 area.
Well Below 200-day and Lagging, but Short-term Breakout
XLF, KRE, KBE, KIE, REM, MJ, FCG, XES
The Finance SPDR (XLF) and the Regional Bank ETF (KRE) are holding on to their short-term breakouts, but they are still lagging overall (well below their 200-day SMAs). The first chart shows XLF with a rising channel and the ETF is hugging the lower line. As with XLI and IWM, the mid July breakout is largely holding, but follow through has been minimal. I am marking support at 23 and a break here would reverse the upswing. The second chart shows KRE with similar characteristics and support at 36.
Well Below 200-day, Lagging and No Short-term Breakout
XAR, XOP, AMLP
The chart for the Oil & Gas Exploration & Production ETF (XOP) looks similar to the other energy-related ETFs (below the 200-day, a decline from early June to mid July and a breakout attempt). XES and FCG broke short-term resistance and are in the group above. Nevertheless, I am not interested in ETFs trading well below their falling 200-day SMAs because the bigger downtrend is the dominant force. XOP found support in the 47-50 area the last few weeks and a breakout at 55 would be short-term bullish, but the long-term downtrend keeps me away.
")