There are still a lot of uptrends out there in ETF land, and this includes some key stock-related ETFs. Nevertheless, we are seeing some rotation at work the last few weeks. The tech-related ETFs slowed their advance and some even failed to hold their breakouts. Meanwhile, ETFs related to consumer discretionary continued higher and are leading the pack. However, some of these new leaders are getting extended (XLY, XHB).
Bond and precious metals ETFs took a hard breather with pullbacks over the last few days. GDX, GLD and SLV corrected hard, which is not entirely unexpected given the prior run ups. The bond ETFs also fell back with the biggest four day declines since May-June. These ETFs may need a few days to settle, but they are in uptrends overall and a pullback within an uptrend is considered an opportunity, not a threat.
I would encourage you to check out the annotated chartbook, which is linked above. The charts are grouped according to their chart characteristics. In addition, the commentary is on the charts for easy access and there are plenty of annotations.
ETF Ranking Table and Scatter Plot
There is a new ranking table in town. I put the powers of Optuma to work and created a ranking table with the active StochClose signals. The columns on the table below and in the Ranking Table PDF above are as follows:
Name, which includes prefix for sorting
Code is the symbol
StochClose is the rounded value for StochClose (125,5)
5-day change is the absolute change in StochClose
Signal is the active signal, true for bullish and false for bearish
RSI 14 is the value for 14-day RSI
RSI Oversold shows green when RSI is between 30 and 50
Yearly Range shows current price level relative to 52-week range
The ETFs in the screen shot below are in strong uptrends with StochClose values at 95 or higher. ETFs related to Consumer Discretionary are leading with four in the top five (XLY, ITB, XHB, XRT). Tech remains strong overall with the Semiconductor ETF (SOXX) hitting a new high this week. Healthcare-related ETFs are also strong with XLV, IHI and IHF featuring in the top 25.
See this article to learn more about the StochClose indicator.
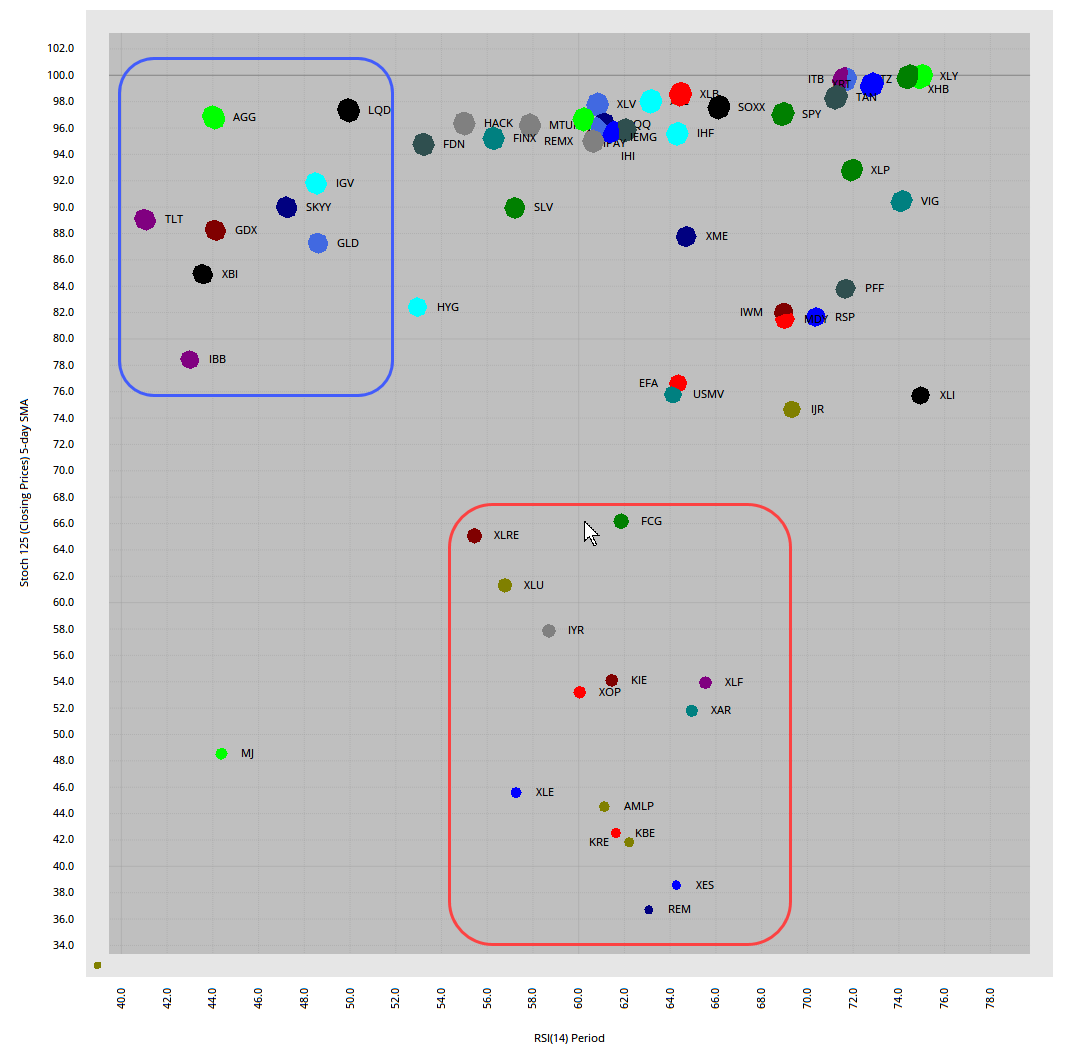
The next image is a scatter plot for the 60 core ETFs. StochClose (125,5) is on the y-axis and RSI(14) is on the x-axis. A big cluster formed in the upper left. These are ETFs with high StochClose values (> 70) and relatively low RSI values (< 50). This means they are in uptrends and mildly oversold, which could give way to an oversold bounce and they should be on our radar. ETFs in the red outline are the laggards because they have the lowest StochClose values (<70). Some have active bullish StockClose signals (FCG, XLRE, XLU), but most have bearish signals (XLF, KRE, XLE).
Changing of the Charts
Today’s charts look a little different because they were created in Optuma. Bear with me please. StockCharts is a fine charting platform, but falls short for my needs in a few areas. First, the default for data is to adjust for dividends and my preference is to not adjust for dividends. Second, I have much more flexibility with the charts. I can create a custom indicator (StochClose) and I can control the scale range for RSI. Third, I can create tables, scatter plots and more using my core ETF list.
The charts are linked to an equivalent StockCharts chart.
Today’s ChartBook is also different because the ETFs are sorted and arranged according to their groupings. This is what I originally had in mind when I launched TrendInvestorPro, but did not have the tools to make this happen in a workable manner. Optuma makes it easy to sort and publish a chart list.
New High and Leading
XLY, XLB, BOTZ, SOXX, ITB, XHB, XRT, TAN
ETFs in group 1 recorded new highs this week and are leading. XLY, ITB, XHB and XRT represent the consumer discretionary sector and the stimulus checks. Also note that the SOXX hit a new high and is leading. XLY and XHB are getting extended as 14-day RSI hits the mid 70s.
Consolidation Breakout and Near New High (again)
QQQ, XLK, XLC, HACK, FINX, IPAY, REMX
SPY, XLP, IHF
Consolidation Breakout and Near New High
Hard Pullback after New High
GDX, GLD, SLV, AGG, TLT, LQD
Bullish Consolidation Near New High
MTUM, XLV IHI
The next 3 ETFs hit new highs in July and then consolidated. A consolidation within an uptrend is a bullish continuation pattern.
ETFs in this next group have consolidation breakouts, extensions and higher highs (exceeded June high). They are also above their 200-day SMAs and their June lows mark key support. MDY, IWM, IJR and XLI had Bollinger Band squeezes and breakouts as well.
New High and Pullback
IBB, XBI
Near 200-day with Slow Grind Higher
XLU, XLRE, IYR
Near 200-day, Consolidation Breakout, Below June High
FCG, XLF, KIE, XAR
The next group of ETFs broke out in mid July, stalled into early August and moved higher the last week or so. They are near their 200-day SMAs, but they are below their June highs and lagging overall.
Below 200-day, Short-term Breakout, Below June High
KBE, KRE, REM, XLE, XES, XOP, AMLP
ETFs in this group have similar characteristics as the prior group, but they are further below their 200-day SMAs and weaker overall. StochClose is also bearish for all. The green zones mark fairly tight support levels because they are laggards.
")