There are times for setups and signals, and there are times to wait. The waiting game is either waiting for the next setup/signal to materialize or monitoring the current signal in play. At this stage, we are in the monitoring stage for several signals that triggered in the first half of July.
SPY consolidated into mid July and broke out (as did XLV, XLB, ITB, XRT and IHI). The Bollinger Bands narrowed for IWM and the ETF broke out (as did MDY and XLI). The Finance SPDR and Regional Bank ETF broke short-term resistance levels, even though they are lagging longer term. Many of the tech-related ETFs stalled the last few weeks, but HACK, FINX and SOXX broke out.
The majority of trends since late March are up and the short-term breakouts are holding. Some breakouts are less convincing than others though. In addition, participation in July is not as strong as it was in June. This is detailed in the Bullish Percent Indexes, 20-day High-Low Percent for SPX and the %Above 50-day SMA indicators below.
Less upside participation is not outright bearish, but we should be vigilant because the weakest two months of the year are here (August and September). The chart below shows monthly seasonal patterns since 1950 (histogram) and current performance (blue line). February, August and September are red, and the weakest three months historically. July is positive (green) and poised for a positive close as the blue line ticked up.
The images in this commentary are linked to StockCharts version when possible.
Further, gold is on a tear and the 20+ Yr Treasury Bond ETF continues to rise. As displaced as this seems, I will continue to base stock market decisions on indicators and ETFs directly connected to the stock market.
I remain focused on the medium-term uptrends, which began with the late March surge. The June lows mark key support for most of these uptrends and these uptrends were renewed with the July breakouts. The market is in good shape as long as the key ETFs and indexes hold support. Trouble starts when breakouts start to fail and support breaks follow.
Medium-term Indicators Remain Net Bullish
The song remains the same for new highs. The total number of new highs is underwhelming in the S&P 500, S&P MidCap 400 and S&P SmallCap 600, but there are even fewer new lows. There is a clear bullish bias as long as there are “some” new highs and fewer new lows. This means the High-Low Lines are rising and supportive of the medium-term uptrend.
All three Bullish Percent Indexes remain bullish with active bullish signals. The late July highs are still below the mid June highs and fewer stocks have double top breakouts working. We have to be very careful with bearish divergences. Notice that the divergences in April did not pan out. For a bearish signal, I would look for two of the three to break below 40%. Note that $NDXBPI is the lowest of the three (68%), but still well above 50%.
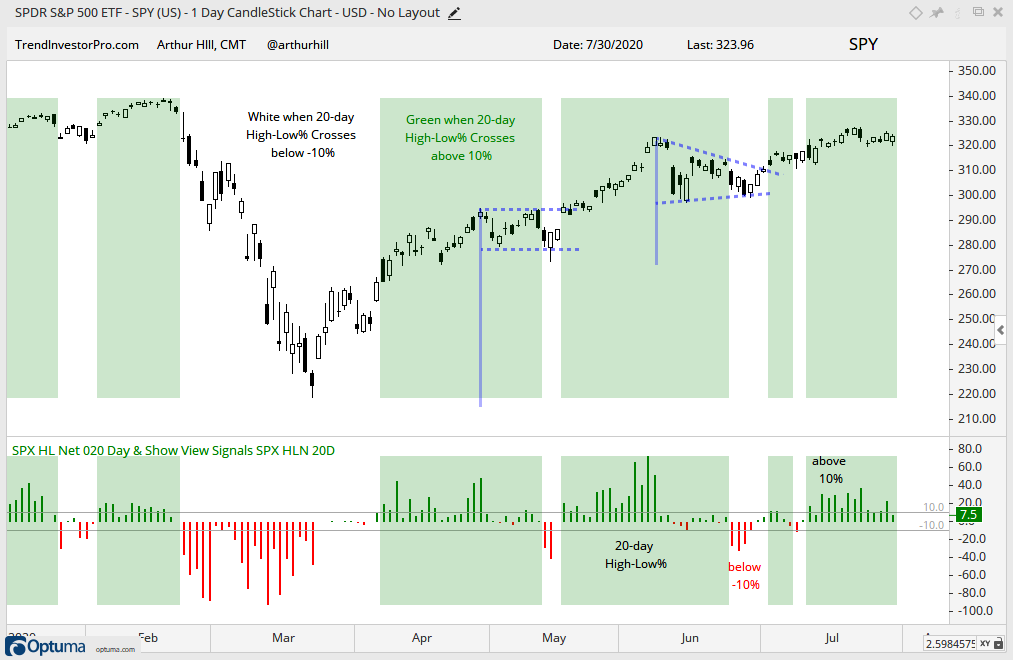
The 20-day High-Low Percent indicator triggered bullish on July 2nd and July 13th, with a whipsaw (bad) signal in between. The indicator remains bullish and it would take a move below -10% to turn bearish. Notice that this indicator was above 50% three times in early June (2nd, 4th, 5th). It did not exceed 40% in July and this shows fewer stocks participating in the July advance.
As a group, all three indicators are bullish and supportive of the medium-term uptrend. The group would turn net bearish when two of three trigger bearish signals.
Fewer Stocks above 50-day SMA
The next chart shows the percentage of stocks above the 50-day SMA for the S&P 500, Nasdaq 100, S&P SmallCap 600 and S&P MidCap 400. The Nasdaq 100 is doing fine because the %Above 50-day got back above 85% in July. However, the other three did not and formed lower highs as fewer stocks made it back above their 50-day lines. Note that SPY exceeded its June high this month and is well above its 50-day SMA (magenta line). At this point, it is less positive that fewer stocks are above their 50-day SMAs, but the indicator remains well above 50% and is not yet a negative for the broader market. Waning participation tells us to remain vigilant as we head into August and a weak seasonal period.
S&P 500 Remains in Bull Mode
The S&P 500 breadth model turned bullish on July 20th, while the 5-day SMA crossed above the 200-day SMA on May 29th. Currently three of the five breadth indicators are on active bullish signals and two are on active bearish signals (+3 – 2 = +1). On the price chart, SPY remains above the 200-day SMA, which turned up in the second half of June. The breakout from the small wedge is holding with first support set at 310 and key support set at 296. These numbers jibe with the bar chart.
The next chart shows the three bullish indicators: 10-day EMA of Advance-Decline Percent, %Above 100-day SMA and High-Low Percent. The %Above 150-day SMA and %Above 200-day SMA are just short of bullish signals. Moves above 65% and 55%, respectively, are needed to trigger these longer-term indicators bullish.
On the whole, the Sector Breadth Model remains firmly bullish. Keep in mind that this model is weighted by market cap because I am weighting the signals by the sector weight. Technology, Healthcare and Communication Services have been bullish since late April-early May and these three account for almost 50% of the S&P 500. Communication Services added a new bullish signal as %Above 200-day EMA exceeded 60%. Energy added a bearish signal as the 10-day EMA of Advance-Decline Percent exceeded -30% for a bearish breadth thrust.
XLU Turns Net Bullish
The Utilities SPDR (XLU) turned net bullish on July 22nd. The 10-day EMA of Advance-Decline Percent surged above 30% on July 17th for a bullish breadth thrust and the %Above 200-day EMA exceeded 60% for a bullish signal on July 22nd. High-Low Percent has yet to trigger, but two of the three are bullish. Thus, +2/3 is multiplied by the sector weight (3.12%) to derive the weighted signal (+2.08%).
On the price chart above, XLU surged in late March-early April and then worked its way higher the last three or so months (green channel). The blue lines show the pullbacks and breakouts. XLU is currently near the 200-day and early June high. Given the bullish breadth signals, I would expect a breakout and move higher. Utilities are defensive in nature and offer some yield. Also note that StochClose(125,5) moved above 60 on June 5th and is currently at 59. Thus, the bullish signal triggered and remains active until StochClose(125,5) moves below 40.
XLU is the Top Performing Sector in July
Just one more thing…XLU is up over 7% and the Consumer Staples SPDR (XLP) is the second leading sector this month (up around 7%). XLK is the weakest of the positive sectors and the Energy SPDR (XLE) is the only sector showing a loss. XLI is up, but up less than SPY and underperforming. XLF is also underperforming and weighing. It seems that money moved into defensive areas of the market in July.
QQQ Remains Bullish and Frothy
There is no change in the Nasdaq 100 breadth model or trend, which remain bullish. The 5-day SMA of QQQ, however, was over 20% above the 200-day SMA and this was the most since 2009. Overbought is not always bearish, but it does point to an overextended condition that makes QQQ ripe for a corrective period. The blue zone marks support from broken resistance and the June consolidation. A pullback to this area would retrace a quarter to a third of the prior advance, which is quite normal for a correction. In fact, it is even on the shallower side.
Note that I detailed the level of exuberance in QQQ in last week’s commentary. QQQ was over 20% above its 40-week EMA, Nasdaq volume was more than 3 times NYSE volume and 20-week Rate-of-Change in the _QQQ:_RSP ratio exceeded 30% twice in the last few months.
MDY Holds Breakout, Despite Weak Breadth
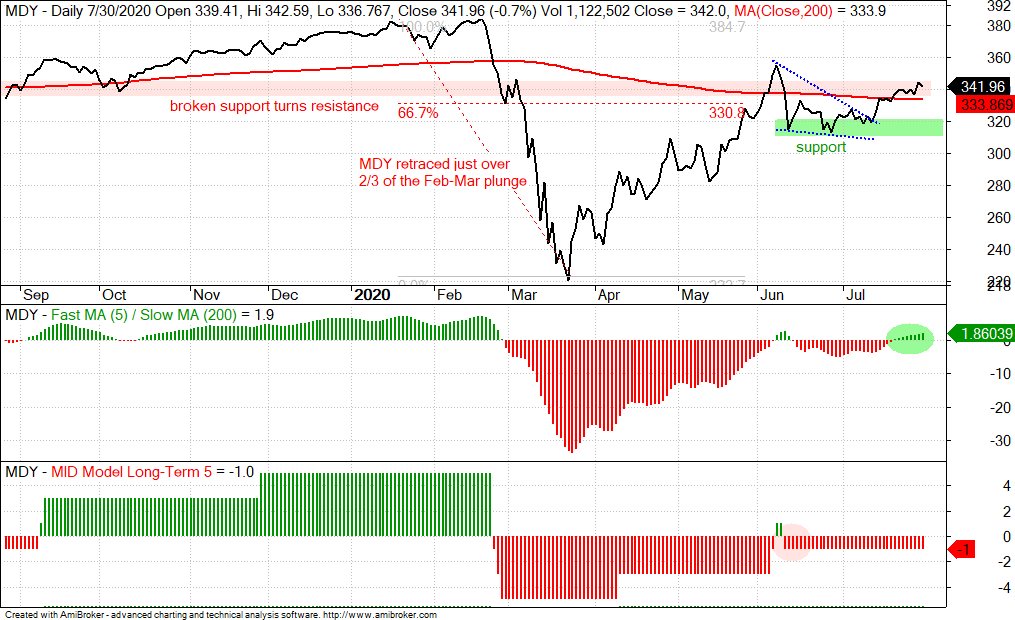
The S&P MidCap 400 breadth model remains net bearish with three indicators on bearish signals and two on bullish signals. The S&P MidCap 400 SPDR (MDY) is just above its 200-day and the 5-day SMA is just above the 200-day. On the price chart, MDY broke out of a small falling wedge and also triggered bullish for a Bollinger Band squeeze on July 15th. This breakout is holding and bullish, but should be watched closely. MDY did not exceed its June high and follow through after the breakout was not exactly inspiring. A break back below the 200-day, a bearish 5/200 cross and a break below the June lows would put MDY back in bear mode.
Small-cap Breadth Remains Bearish as IJR Battles 200-day
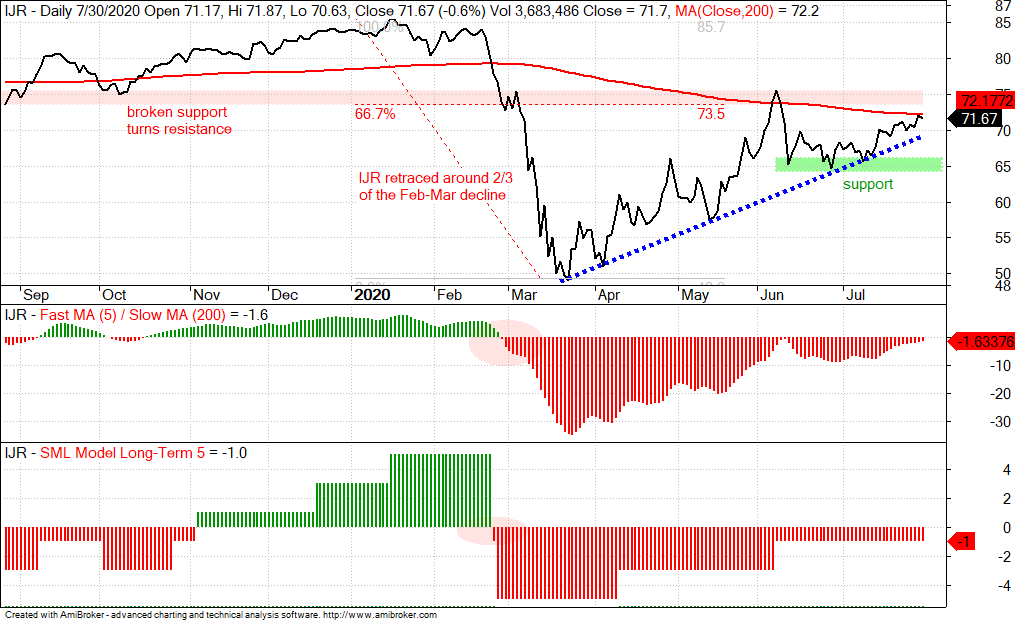
Small-cap breadth remains bearish and the 5-day SMA for IJR remains below the 200-day SMA (both since late February). IJR is near its 200-day with a short-term breakout on July 15th. This keeps the medium-term uptrend intact, but IJR is still at a precarious spot. The March-June advance retraced around 2/3 of the February-March decline and returned to broken support. This is still a possible reversal zone, but the medium-term uptrend remains as long as the June lows hold (green zone).
Yield Spreads and Fed Balance Sheet
There is no real change in the yield spreads or the Fed balance sheet. As Chairman Powell suggested, the onus is now on Congress to pass the next stimulus bill. The Fed did its job to prop up the bond market and prevent a credit crisis. The Fed also provided some $3 trillion in liquidity and some of this money probably found its way into the financial markets (sans Treasury bonds).
The AAA and BBB spreads are back to pre-crisis levels and normal. This shows no stress at the investment grade end of the bond market.
Junk bond spreads fell further this week and are back below the pre-crisis high, which was 5.38 in January 2019. Thus, the junk bond market is normal and not showing signs of stress. The CCC spread also fell, but has yet to move below their pre-crisis highs.
The Fed balance sheet contracted a little this past week.
")