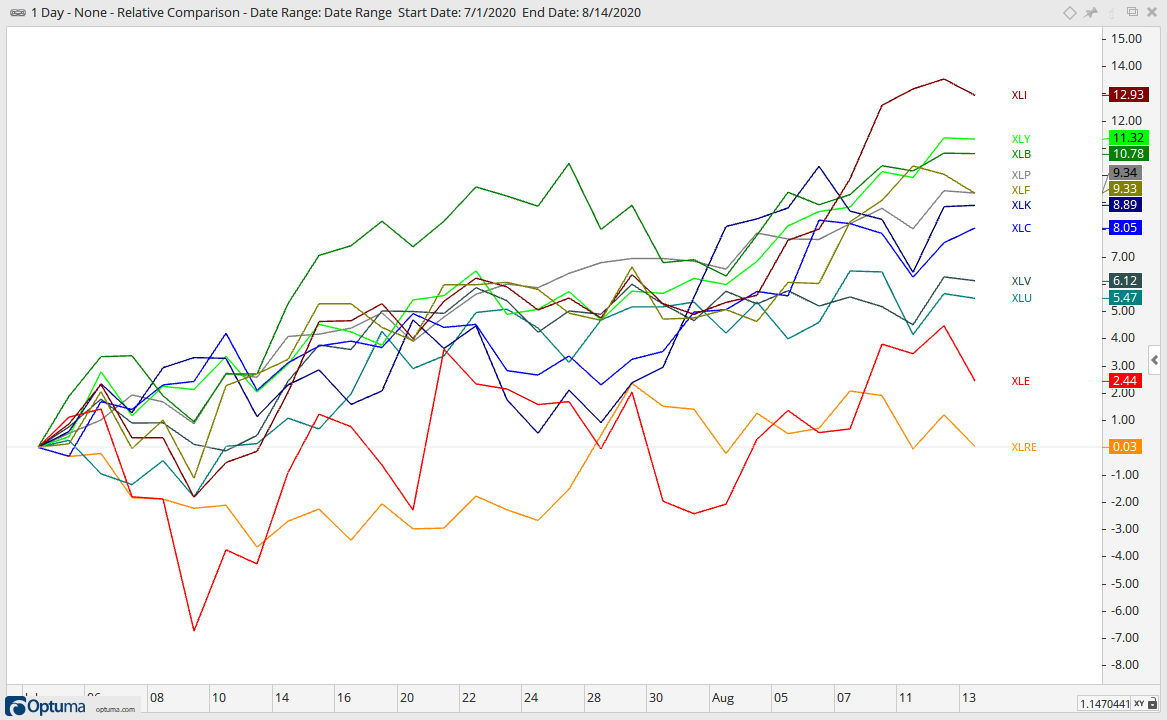
Even though the current advance is getting quite extended, the broad market environment remains bullish and the medium-term uptrends rule. Tech-related ETFs and stocks drove the market higher from late March to late June. Even though the tech surge slowed, participation broadened over the last six weeks as other groups picked up the slack. The Industrials SPDR (XLI) is the top performing sector since July 1st and the Finance SPDR (XLF) is the fifth best performing sector. As the chart below shows, XLF is just above the Technology SPDR (XLK) on the performance chart. XLF can thank Berkshire, which accounts for 14.75% of XLF and is up over 15% since early July.
The images in this commentary are linked to a StockCharts version when possible.
Pretty much everything is up since early July. The Real Estate SPDR (XLRE) is the weakest of the sector SPDRs and virtually unchanged. Even the lowly Energy SPDR (XLE) sports a modest gain of 2.44%. Overall, it is positive to see some rotation into the Industrials and Finance sectors. These two are part of the big six and part of the five offensive sectors. Consumer Discretionary, Technology and Communication Services are the other three offensive sectors.
Programming note: I will post my reports earlier next week. Look for the ETF Report on Wednesday and the Market Timing Report on Thursday. I am taking Friday (21-Aug) off for a last minute family outing to the beach.
SPY Erases the Crash
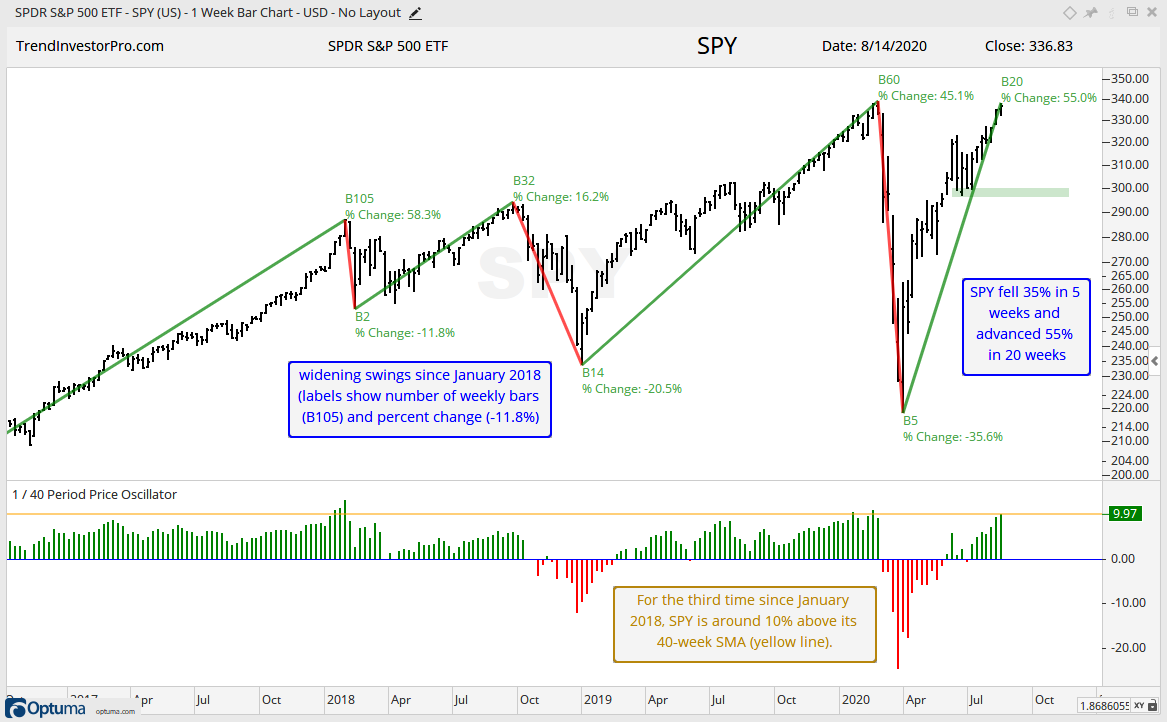
SPY surged back to its February high with a 55% advance the last 20 weeks. On the chart below, the text at the top left shows B20 for 20 bars (weeks) and 55% for the percentage change (low to high). Prior to this historic surge, SPY fell 35.6% in just five weeks. These moves are extraordinary and reflect a some serious volatility in the markets. In fact, volatility has been expanding since January 2018 as the swings just get bigger and bigger.
The six swings since January 2018 confirm that I should be focused on the swings within broadening range. The swing since late March is up with the July lows marking key support for now. The indicator window shows the 1/40 Price Oscillator, which measures the difference between the 1-week SMA (close) and 40-week SMA. SPY is around 10% above its 40-week SMA for the third time since 2018 (yellow line). This is not bearish, but it does point to an overextended condition that could give way to a correction at some point.
Average Stock Struggles, but Not Smalls and Mids
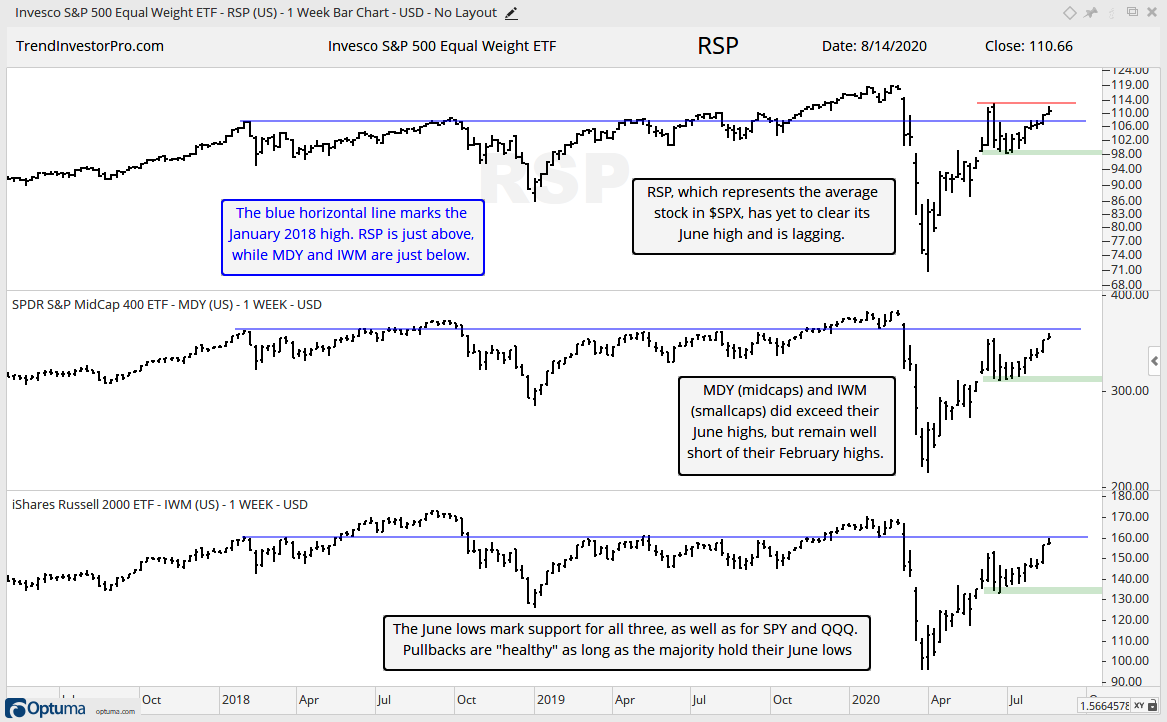
The “average” stock in the S&P 500 is not performing as well as the large-cap stocks (SPY). I blame the Energy and Finance sectors. The next chart shows the S&P 500 EW ETF (RSP) moving higher the last six weeks, but this equal-weight ETF has yet to exceed its June high and remains well below its February high. Nevertheless, the swing is up with the June lows marking support.
The S&P MidCap 400 SPDR (MDY) and Russell 2000 ETF (IWM) are actually stronger than RSP as both exceeded their June highs. These two remain short of 52-week highs, but the swings are up with the June lows marking support. Throw in QQQ, and the broad market upswing remains intact as long as the majority of these five hold their June lows.
Medium-term Indicators Remain Net Bullish
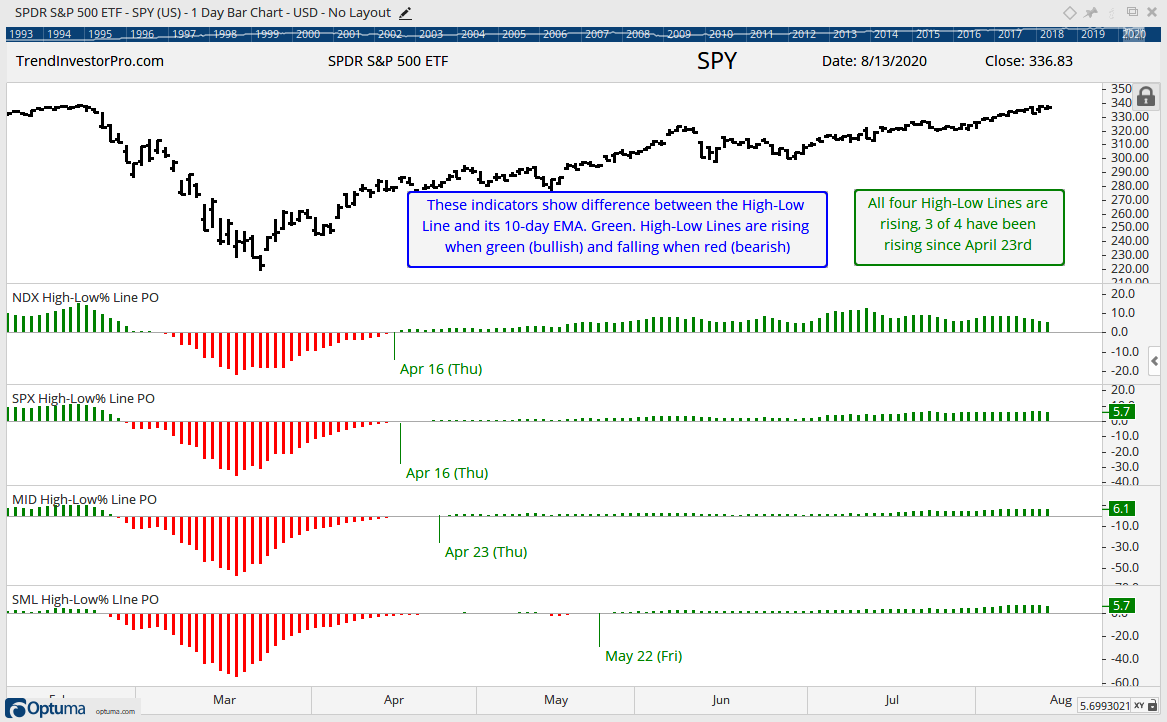
The next chart shows the High-Low Lines in a different format. The histograms reflect the percentage difference between the High-Low Line and its 10-day EMA. The histogram as green when the High-Low Line is above its 10-day EMA (bullish) and red when below. As the chart shows, 3 of 4 histograms have been positive since April 23rd and all four are currently positive.
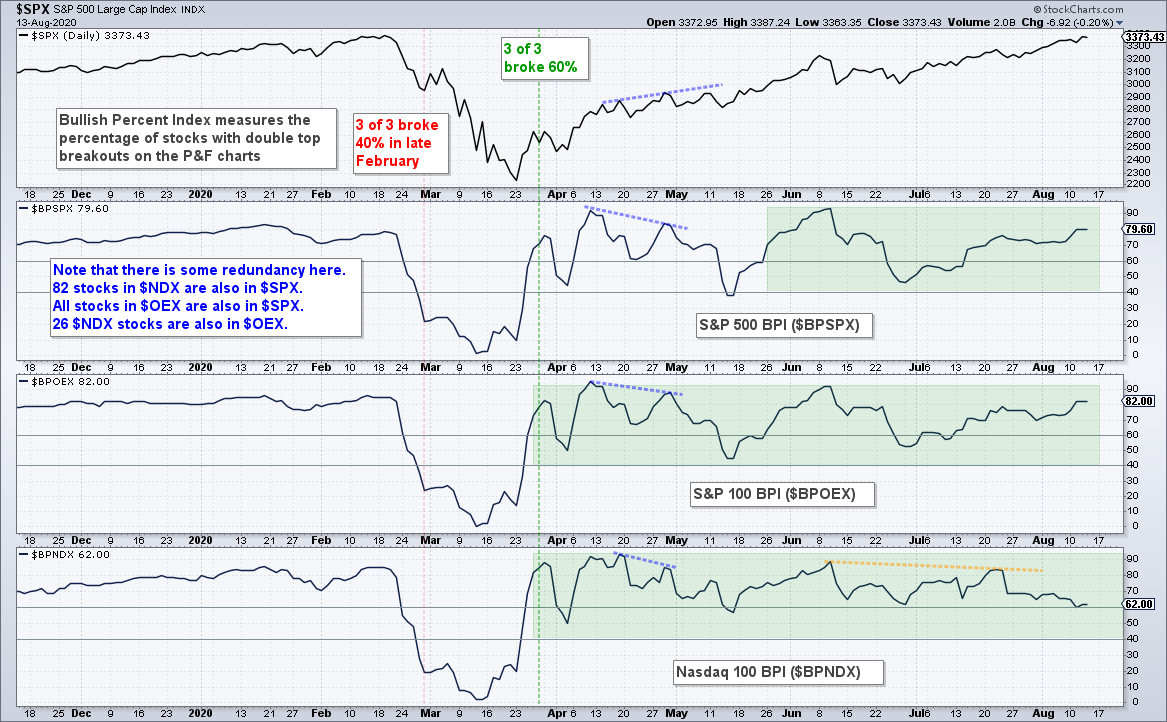
The Bullish Percent Indexes for the S&P 500 and S&P 100 turned up in August as the number of P&F buy signals expanded this month. This shows broadening participation. However, the Nasdaq 100 Bullish Percent Index ($BPNDX) edged lower and remains the lowest of the three (62%). Despite less upside participation in the Nasdaq 100, the Bullish Percent Indexes remain strong for $SPX and $OEX. A bearish signal would trigger should two of the three move below 40%.
20-day High-Low Percent exceeded 40% on Tuesday and this also reflects broadening participation in the S&P 500. This indicator has been net bullish since July 13th, which is when it crossed above +10%. It would take a move below -10% to turn this indicator bearish.
The volatility trends remain bullish. The next chart shows the High-Low Range indicator and normalized ATR (ATR(2)/Close). I applied a 5-day SMA for smoothing and am showing both as histograms. The blue line is a 10-day SMA of the histogram line. High and/or rising volatility is bearish, while low and/or falling volatility is bullish.
Both indicators fell sharply from March 19th to April 21st and remained low until the end of April. They then fluctuated around their respective thresholds until early July. Both moved below their thresholds (bullish) on July 1st and remain below. A move above these thresholds would show an uptick in volatility and this would be negative. It may not mark a top, but could at least mark the start of a corrective phase.
S&P 500 Model and Trend Remain Bullish
I managed to switch to Optuma for my SPX and NDX breadth charts. More work is required to set up small and mid caps. These charts are much nicer, but I will still use Amibroker for testing.
The first chart shows the 5/200 Price Oscillator for SPY turning positive on May 29th and the S&P 500 breadth model turning net bullish on July 23rd, two months later. This lag is because SPY is driven by market cap and large-caps are leading. The “average” stock in the S&P 500 drives the breadth model and many were struggling.
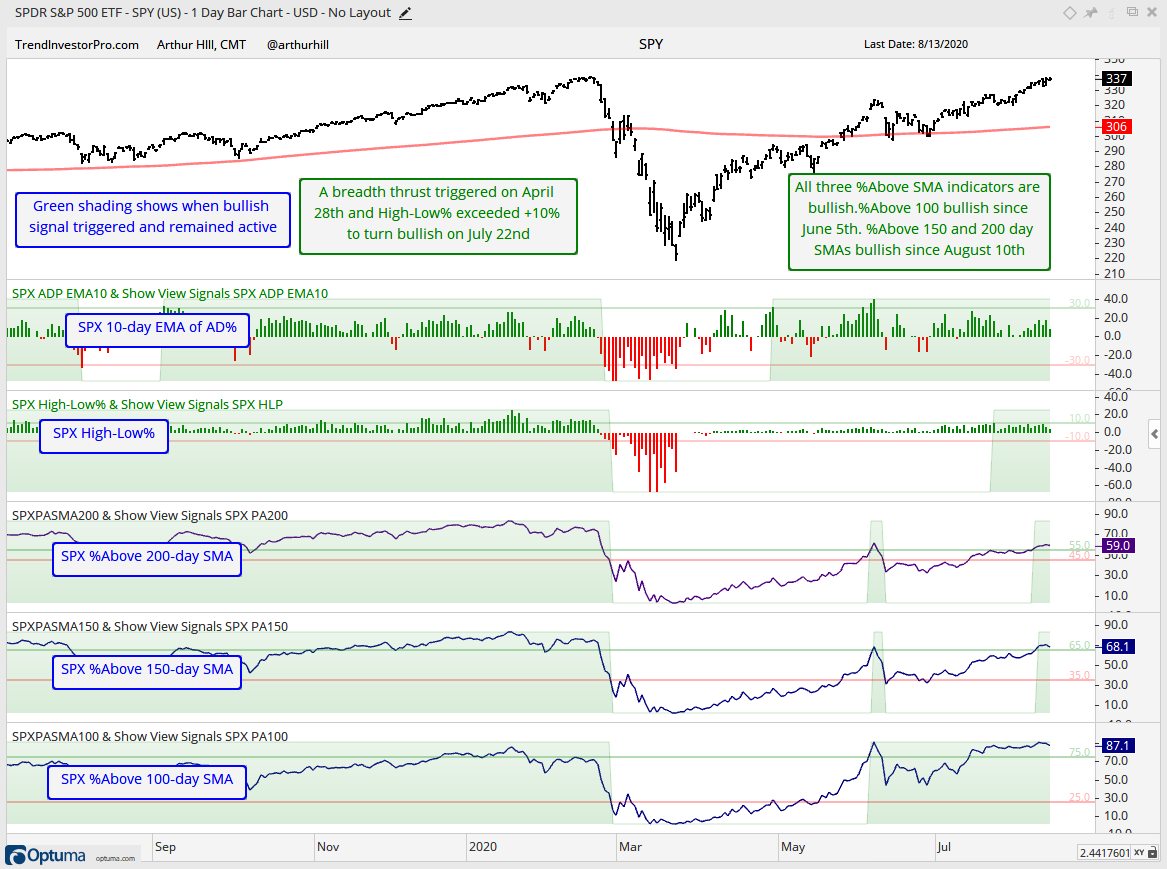
The chart below shows the individual indicators that make up the breadth model. The breadth thrust (10-day EMA of Advance-Decline Percent) and %Above 100-day SMA are the only two that remained bullish from mid May until now (green shading). The longer-term indicators are High-Low Percent, %Above 150-day SMA and %Above 200-day SMA. These struggled in June-July, but all three are now bullish and this means all five breadth indicators are on active bullish signals.
There is no change in the sector breadth model, which remains firmly bullish. 8 of 11 sectors are net bullish and 25 of 33 indicators are on active bullish signals. The four biggest sectors are all green with all three indicators on active bullish signals. The Finance sector, which is the fourth largest, fell just short of a bullish signal this week as Finance %Above 200-day EMA (!GT200XLF) hit 59% on Tuesday. A move above 60% is needed for a bullish signal. Finance, Energy and Real Estate are the weakest sectors right now. Note that
The sector breadth model is a check on the S&P 500 Breadth Model. The sectors and signals in the Sector Breadth Model are weighted by their sector weight, which means the largest sectors carry the most weight. The Index Breadth Model is more egalitarian because the indicator signals are not weighted. In theory, breadth should be egalitarian. In practice, however, stocks and sectors are not created equal and large-caps dominate SPY.
QQQ Hits New High
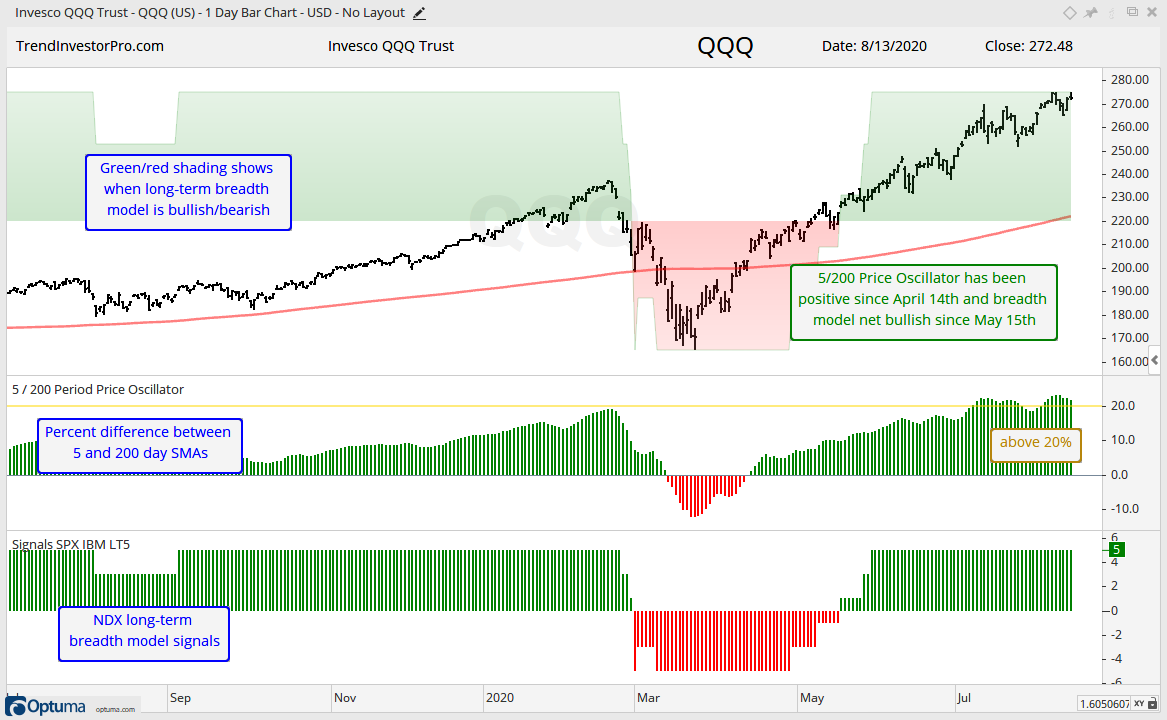
The stocks in the Nasdaq 100 also influence the S&P 500 and this is why the Nasdaq 100 is important. Notice that this model turned net bullish on May 15th. The 5/200 Price Oscillator turned positive a month earlier because large-cap techs were driving QQQ higher. The average stock in QQQ did not catch up until mid May. QQQ remains bullish overall, but is quite extended because the 5-day SMA is more than 20% above the 200-day SMA, which is more than in February.
Mid-caps Stronger than Small-caps
The mid-cap breadth model turned bullish this week as the %Above 150-day SMA moved above 65% to trigger bullish. This indicator joins the 10-day EMA of Advance-Decline Percent and %Above 100-day SMA with bullish signals. Some 52% of mid-caps are above their 200-day SMA and this indicator remains short of a bearish signal, which requires a move above 55%. High-Low Percent is also short and has yet to clear +10%.
The S&P SmallCap 600 SPDR (IJR) is above its 200-day SMA and the 5-day is above the 200-day, but the breadth model remains net bearish. Again, the long-term indicators are dragging their feet. %Above 150-day SMA, %Above 200-day SMA and High-Low Percent remain with bearish signals.
Yield Spreads and Fed Balance Sheet
There is no real change in the yield spreads or the Fed balance sheet. Congress is doing its usual theatrics regarding the next stimulus bill, but these things almost always go down to the wire and almost always pass.
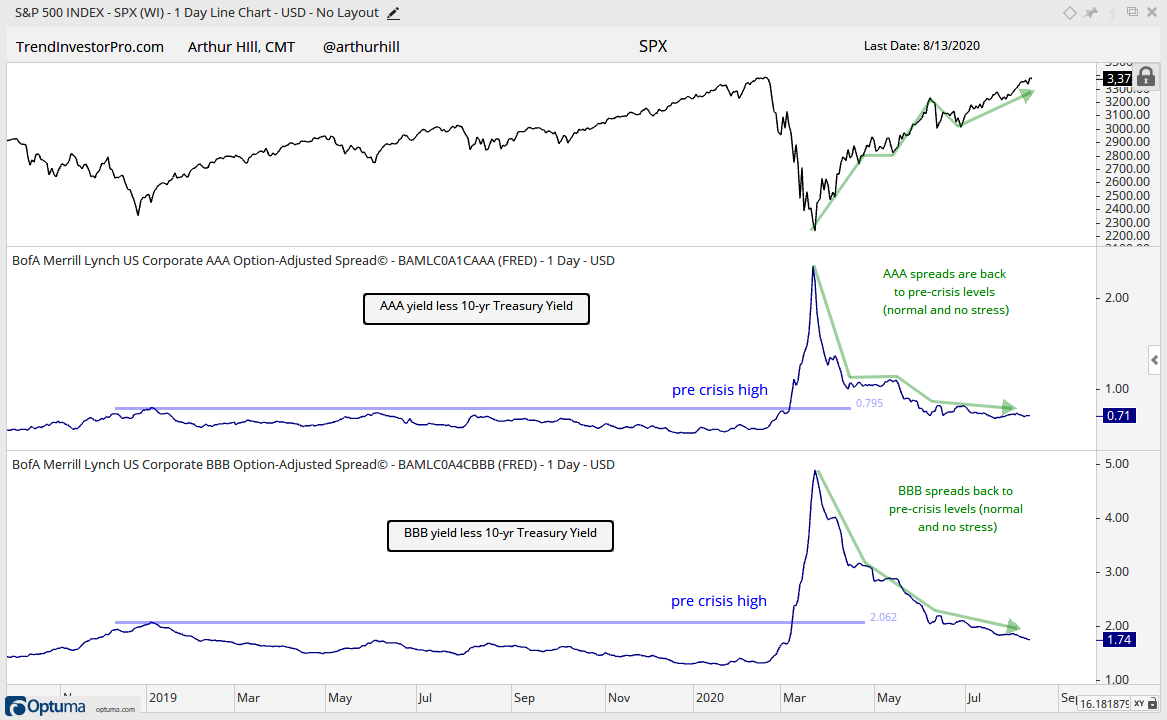
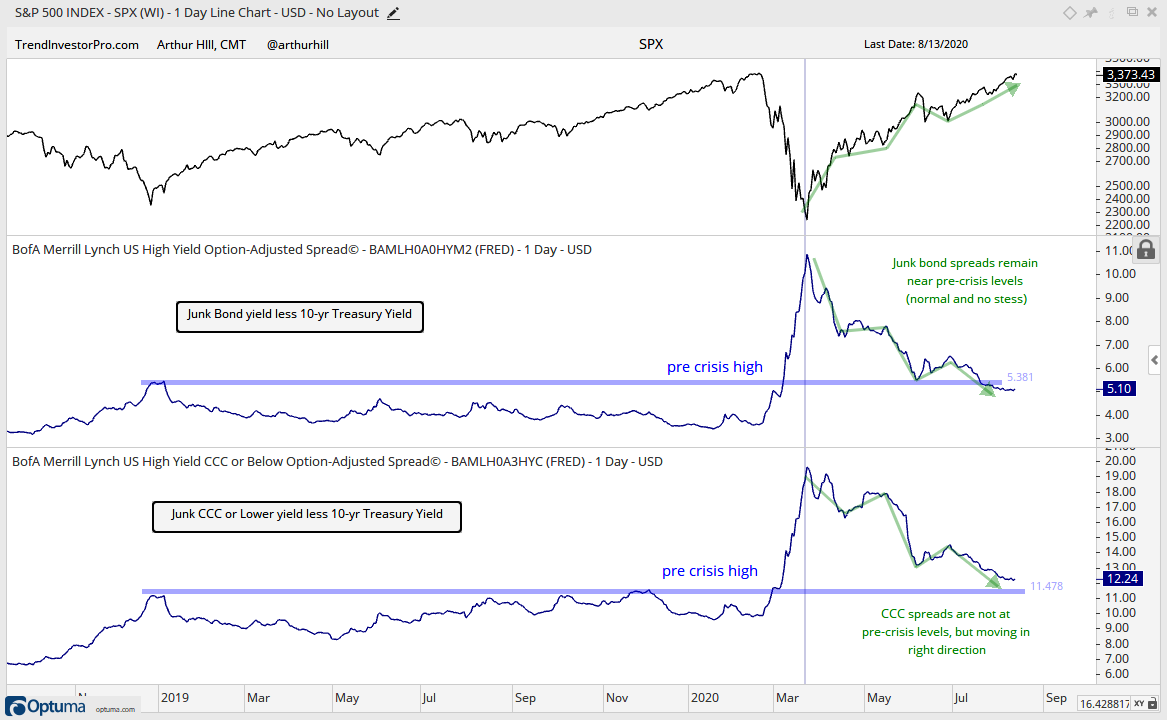
The AAA spread flatten out around .70 and remains below the pre-covid highs. The BBB spread continued to fall and reached its narrowest since early March. Overall, the BBB spread is narrow (bullish) and falling (bullish).
Junk bond spreads edged lower over the past week. The junk spread is near 5 and this is the lowest since early March, and below the pre-covid highs. The CCC spread remains above the pre-covid high, but it is moving in the right direction (narrowing).
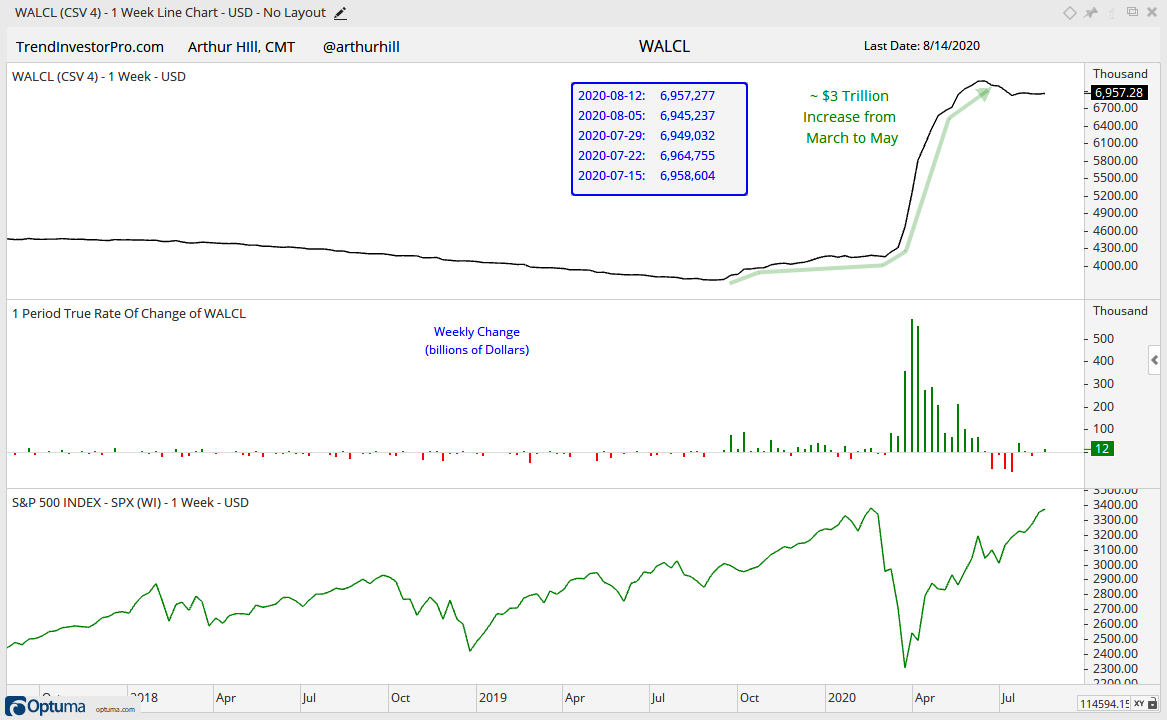
The Fed did its job by expanding the balance sheet by some $3 trillion in March, April and May. Balance sheet growth stalled over the last nine weeks, but we have not seen a major contraction that would be negative for the markets.
")