")
May was a volatile month for SPY with five swings of two percent or more, but the month ended slightly positive after a 3% upswing the last eight trading days. May is finished and now we head to June, which has a slightly negative seasonal bias. We will look at this seasonal pattern in today’s video and put the current 14 month advance into perspective. The yield spreads remain low and bullish, the Composite Breadth Model has been bullish for exactly a year and SPY remains in a tight rising channel. I will also weigh in on playing a breakout in IJR, choosing an ATR Trailing Stop in XLK, the 20% advance in PBW and the recent upswing in CARZ. Details and order of play are shown below:
Broad Market Notes
- Record 12 and 14 Month Periods
- SPY, QQQ and IWM Recapture 10-week SMAs
- BBB Spreads Hit Yet Another New Low
- Bull Market Signal Turns 1 Year Old
- Oil Forms Bullish Cup-with-handle
- Gold Extends on Break above 200-day
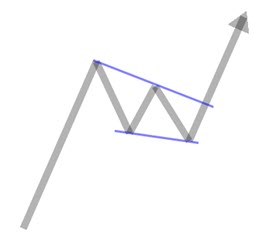
- Tainted TLT Forms Bearish Triangle
- Strong Euro Drives Dollar Lower
ETF Highlights
- ETF Ranking Table – No New Trend Signals
- Finance, REITs, Autos, Industrials Hit New Highs
- Russia, India, Brazil, Europe Hit New Highs
- Tight Channels for SPY and RSP
- IJR Goes for Breakout – How to Play It
- ATR Trailing Stops on XLK Breakout
- Pennant/Flag Breakouts for XLF, XLI and XLC
- XLE, XLB, XME Stall with Pennants
- Upswings within Triangles for IGV, FDN, CIBR
- Upswings within Uptrends for SOXX, IPAY, FIVG
- ITB and IHI Get Oversold Bounces
- ITA: Should have Known Better
- JETS Holds Breakout
- ICLN and PBW: Early Bird vs Second Mouse
- XES, XOP and FCG Hold Trailing Stops
- COPX, CPER, DBB, SLX, DBA Get Oversold Bounces
- CARZ, DRIV, IDRV, BETZ Turn up within Consolidations
Thanks for tuning in and have a great weekend!